Smart thermostat energy savings statistics from real homes tell a plainer story than the box does. The best field data puts the average cut at about a tenth of heating and cooling use. Careful billing studies often land lower, and one pilot found a model that raised gas use.
This page collects dated figures from federal agencies, national laboratories, state regulators, utility evaluators and peer-reviewed journals. Every number links to the document that produced it. Vendor claims are labeled as vendor claims, and the independent checks sit next to them.
Use it to set honest expectations with a customer, to judge a rebate program, or to check a number before you repeat it. Each stat appears once, so scan the headings for the question you need. The page is refreshed every month. For how much of a home’s energy goes to heating and cooling in the first place, see the HVAC energy consumption statistics page.
Key Takeaways
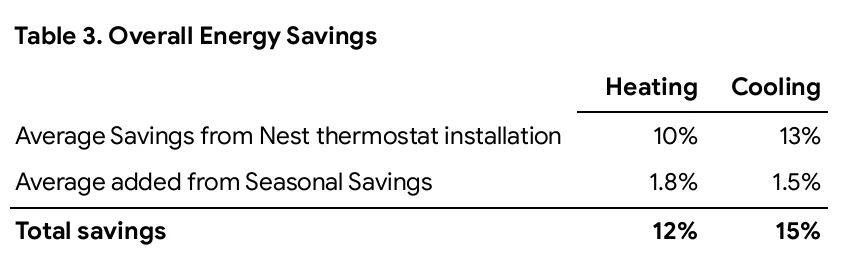
- Google Nest reports average savings of 12% on heating and 15% on cooling across its US studies and Seasonal Savings trials (Google Nest, Aug 2024).
- A California evaluation of more than 400,000 rebated and direct-install smart thermostats found savings significantly lower than claimed in every program year (DNV for the CPUC, Mar 2024).
- In an Oregon gas pilot, one smart thermostat model cut heating load by about 6% while the other model added 4% to 5% (Apex Analytics for Energy Trust of Oregon, Mar 2016).
- 12.78 million of the 123.53 million US homes had a smart or internet-connected thermostat in 2020 (EIA, Mar 2023).
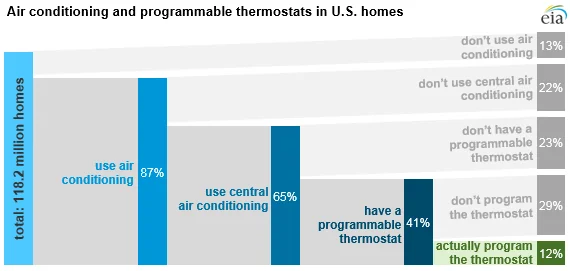
- Only 12% of US homes both use central air conditioning and have a programmable thermostat they actually program (EIA, Jul 2017).
- Turning a thermostat back 7 to 10 degrees F for 8 hours a day can save as much as 10% a year on heating and cooling (U.S. DOE, Aug 2022).
- 39% of programmable thermostat owners in a US survey did not use the programming features (Pritoni et al., Jun 2015).
- A UK trial of a smart thermostat package found a 5.0% cut in gas use, with a margin of error of 3.9 points (UK DESNZ, Jun 2023).
- A 10% cut in cooling energy equals only about a 2% cut in a home’s electricity use, because cooling is about 20% of the annual total in many regions (NREL, Jun 2023).
- ecobee’s eco+ software cut about 1.12 kW per thermostat during summer 2020 demand response events (Demand Side Analytics, Nov 2020).
- Smart thermostats were in 16% to 17% of US internet households in 2025 (Parks Associates, Aug 2025).
- ENERGY STAR certified connected thermostats shipped 4.365 million units in 2022, a 55% share of the US market (ENERGY STAR, Dec 2022).
How much energy do smart thermostats save in real homes?
The honest range is single digits to the low teens, measured as a share of heating and cooling use. That is worth having, but it is a long way from the “up to 20%” that vendors have claimed. The label that matters most is ENERGY STAR, because it is built on field data and not on lab tests.
What must an ENERGY STAR smart thermostat save?
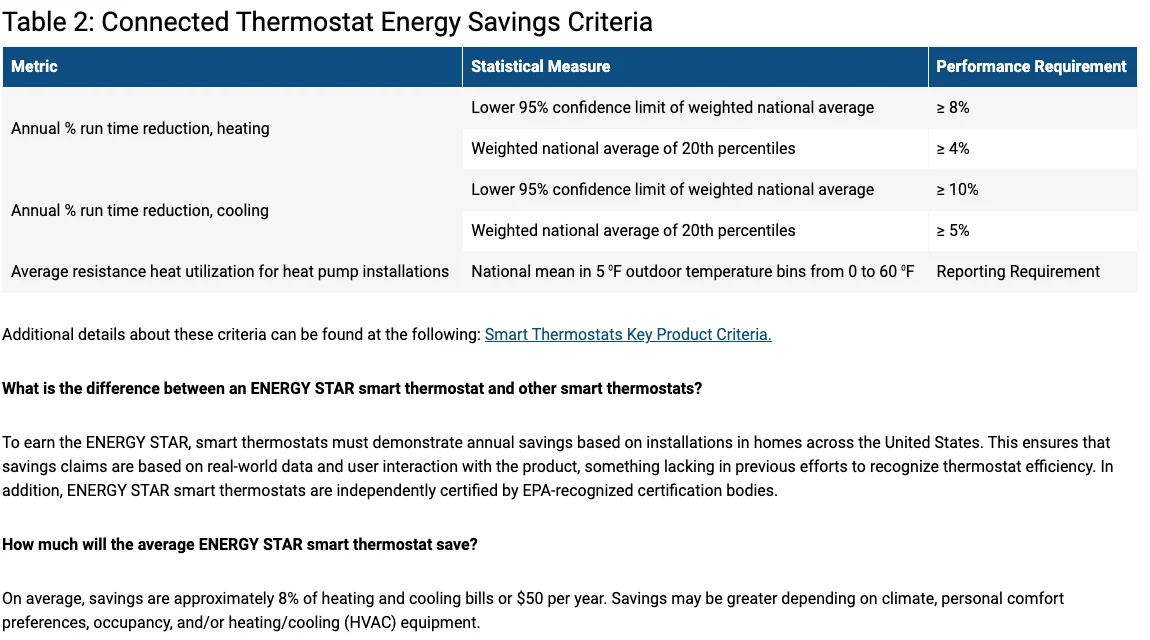
To earn the label, the lower 95% confidence limit of the national average run time cut must reach at least 8% for heating and 10% for cooling (ENERGY STAR, Dec 2016).
- The weighted average of the 20th percentiles, which protects the weaker homes, must reach at least 4% for heating and 5% for cooling (ENERGY STAR, Dec 2016).
- EPA says savings average about 8% of heating and cooling bills, or $50 a year, and may be greater with climate, comfort choices, occupancy or equipment (ENERGY STAR, Jun 2017).
- Seven models were certified by June 2017, from makers including Nest, ecobee, EcoFactor, Bryant and Carrier (ENERGY STAR, Jun 2017).
- EPA notes that homes that are always occupied see less savings, and that geofencing is not part of the criteria (ENERGY STAR, Jun 2017).
What do the vendors say they save?
Vendor numbers vary with the method, so read each one with its method attached.
- Researchers at EPA, Berkeley Lab and ICF wrote that thermostat vendors claimed savings of up to 20% while no accepted test existed (Daken, Meier and Frazee, Aug 2016).
- Independent US studies summarized by Google averaged 10% for heating and 13% for cooling (Google Nest, Aug 2024).
- Google’s ENERGY STAR scores for its thermostats averaged 11.4% for heating and 16.0% for cooling in 2023 (Google Nest, Aug 2024).
- ecobee says its North American customers saved up to 26% on heating and cooling costs, in an internal analysis from April 2021 (ecobee, Apr 2021).
- ecobee also states that the method behind that figure has not had independent third-party verification (ecobee, Apr 2021).
- An evaluation of ecobee’s eco+ software put the energy savings per opt-in thermostat at about 6% in summer 2019 (Demand Side Analytics, Nov 2020).
- The same evaluation put the savings at about 5% in summer 2020 (Demand Side Analytics, Nov 2020).
What did the first utility field studies find?
- Across two Indiana utilities, Nest thermostats cut heating gas use by 13.3% and cooling electricity by 14.5% (Cadmus, Aug 2016).
- At NIPSCO, Nest homes cut heating gas by about 13.4%, against 7.8% for homes with a programmable thermostat (Cadmus, Aug 2016).
- At Vectren, the gap was 12.5% for Nest against 5.0% for programmable thermostats (Cadmus, Aug 2016).
- Reported savings across the evaluations NEEP reviewed ranged from 1% to 15% for heating and 1% to 17% for cooling (NEEP for NYSERDA, Oct 2016).
- A UK randomized trial found savings of 6% to 7% of heating system gas use against the common timer, room thermostat and radiator valve set (Behavioural Insights Team, Nov 2017).
- The same trial put the cut at 4.5% to 5% of total household gas use (Behavioural Insights Team, Nov 2017).
Do independent billing studies confirm the savings?
Mostly yes in direction, and often no in size. When evaluators compare bills with a matched group, the effect shrinks, and it varies a lot by home. Treat any single national number as a rough guide.
What did the California regulator find?
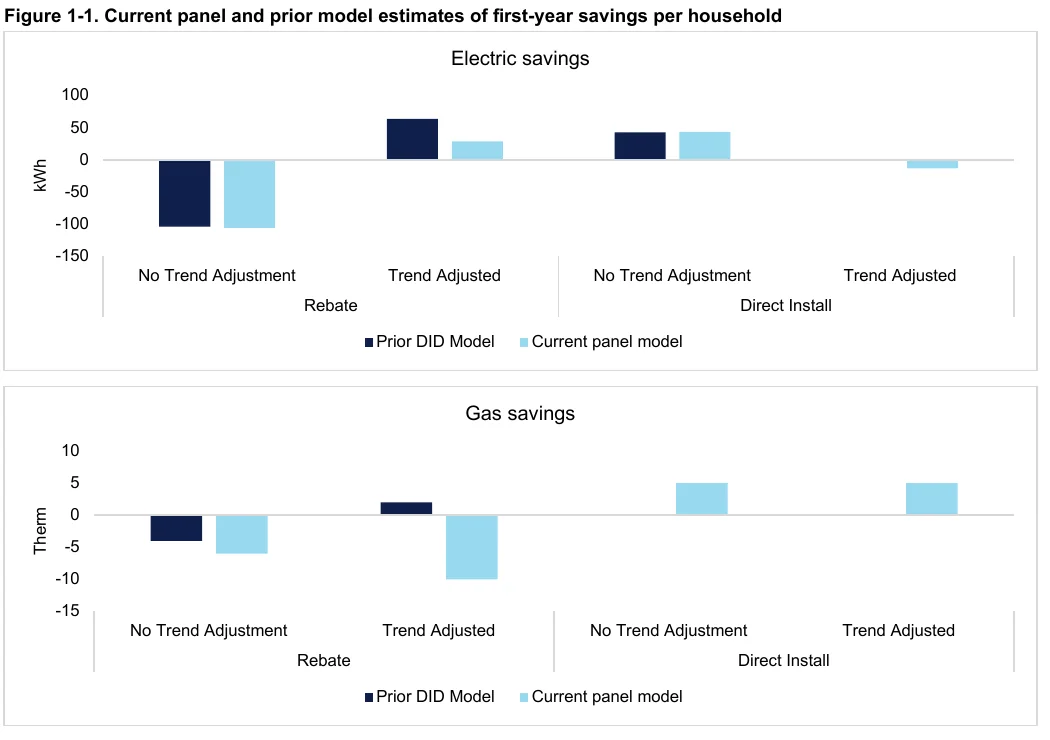
Direct-install channels delivered 50% to 70% of the thermostats in California programs from 2018 through 2021, and the evaluators corrected for the fact that participants and non-participants followed different energy trends (DNV for the CPUC, Mar 2024).
- The trend-adjusted panel model gave rebate customers 29 kWh of first-year electric savings per household and a gas result of minus 10 therms (DNV for the CPUC, Mar 2024).
- Averaged over three years the same model gave 45 kWh and minus 2 therms (DNV for the CPUC, Mar 2024).
- Direct-install homes moved from minus 13 kWh in the first year to 4 kWh over three years, and from 5 to 9 therms (DNV for the CPUC, Mar 2024).
- Rebate customers in the top quarter of energy use saved 151 kWh and 12 therms, against 3 kWh and minus 6 therms for lower-use customers (DNV for the CPUC, Mar 2024).
- One vendor’s device saved 55 kWh per household and another’s saved 17 kWh (DNV for the CPUC, Mar 2024).
- Hard-to-reach and multifamily participants did not achieve electric savings, while single-family and other households did (DNV for the CPUC, Mar 2024).
What did Massachusetts measure?
Massachusetts evaluators estimated gas savings of 2.79 MMBtu per Wi-Fi thermostat (Guidehouse for Massachusetts program administrators, Sep 2021).
- Devices that replaced a manual thermostat saved 4.51 MMBtu, while devices that replaced a programmable one saved 2.44 MMBtu (Guidehouse for Massachusetts program administrators, Sep 2021).
- Programmable thermostats saved 2.07 MMBtu per device, below the 3.50 MMBtu then in the state technical reference manual (Guidehouse for Massachusetts program administrators, Sep 2021).
- Gas customers surveyed said their new thermostat replaced a manual one in 31% of cases, a programmable one in 55% and a Wi-Fi one in 13% (Guidehouse for Massachusetts program administrators, Sep 2021).
- Customers reported 1.55 thermostats on average, so the evaluators divided per-customer savings by that number (Guidehouse for Massachusetts program administrators, Sep 2021).
Why are these studies hard to read?
- Smart thermostats often have small unit savings compared with a whole-home retrofit, which makes them hard to detect in billing or meter data (NREL, Jun 2023).
- One study found 7.8% cooling savings from whole-home consumption, while the ENERGY STAR metric gave 10% to 14% for the same homes (NREL, Jun 2023).
- Another study found very weak or no correlation between the ENERGY STAR metric and savings seen in meter data (NREL, Jun 2023).
- Software updates and changing user habits mean future savings may differ from first-year savings (NREL, Jun 2023).
- Google notes that smart thermostat buyers tend to be younger, wealthier and more tech-oriented, and more likely to buy an electric vehicle or have a baby, which, Google argues, biases rebate studies (Google Nest, Aug 2024).
Does every smart thermostat save?
No. Results depend on the product, the home and the people in it.
- The Oregon pilot randomly assigned qualifying households to one of two models and compared them with about 1,000 customers who were never contacted (Apex Analytics for Energy Trust of Oregon, Mar 2016).
- Homes with the other model, the Honeywell Lyric, used 24 to 29 more therms a year (Apex Analytics for Energy Trust of Oregon, Mar 2016).
- A UK gas trial that reached only a quarter of its planned sample size still detected an effect (UK DESNZ, Jun 2023).
- For households that actually received the product, the UK trial estimated a 14% gas cut, with a margin of 10.9 points (UK DESNZ, Jun 2023).
- A sensitivity run that removed outliers gave 7% (UK DESNZ, Jun 2023).
- The UK trial found no statistically significant change in electricity use (UK DESNZ, Jun 2023).
- 58% of UK trial users said they found it easier to heat their home to a comfortable level (UK DESNZ, Jun 2023).
How much does turning the thermostat back actually save?
The saving from a setback is simple physics, and the rule of thumb is old. The weak link is behavior: most homes do not run any schedule at all.
What does a setback save?
A setback saves a modest and fairly predictable share of the bill, and the rules of thumb are old and still hold.
- A widely used rule of thumb is a saving of about 1% per degree F for an eight-hour adjustment (Peffer et al., Mar 2013).
- Simulations of North American homes show that lowering the setting 2 to 4 degrees C for 8 hours a night saves 5% to 15% a year on the heating bill (Pritoni et al., Jun 2015).
- In theory a programmable thermostat can cut energy use by 5% to 15%, but in practice studies often find little or no saving against manual control (Peffer et al., Mar 2013).
- In a simulation by NREL, Berkeley Lab and EPA, most homes were predicted to save 5% to 8% of runtime from a nighttime setback (NREL, Apr 2023).
How do US households control their heating?
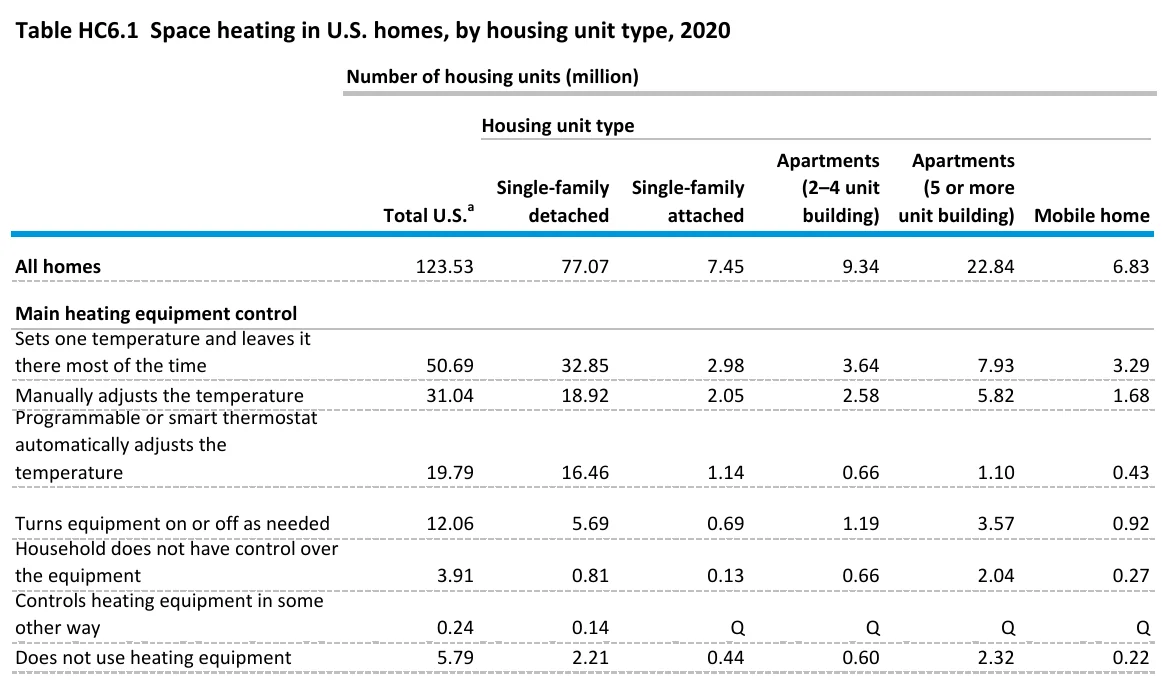
- 50.69 million homes set one temperature and leave it for most of the time (EIA, Mar 2023).
- 31.04 million homes adjust the temperature by hand (EIA, Mar 2023).
- Only 19.79 million homes let a programmable or smart thermostat adjust the temperature automatically (EIA, Mar 2023).
- 12.06 million homes turn the equipment on and off as needed (EIA, Mar 2023).
- For cooling, 45.94 million homes set one temperature and 16.60 million let a programmable or smart thermostat do the adjusting (EIA, Mar 2023).
- The share of non-smart thermostat homes that set one heating temperature and leave it rose from 43.1% in 2015 to 49.7% in 2020 (Google Nest, Aug 2024).
- Over the same years the share where a programmable thermostat adjusts the heat fell from 18.3% to 13.3% (Google Nest, Aug 2024).
How often do people set back, and does it hold?
- In the 2005 heating season, about 60% of US homes with programmable thermostats used them to lower the temperature at night, and only 45% did so during the day (Peffer et al., Jun 2011).
- Among recent HVAC equipment buyers, 56% said they always program their thermostat and 9% said they never do (Peffer et al., Jun 2011).
- Fewer than 50% of households in Oslo set back the temperature at night (Peffer et al., Jun 2011).
- In a dataset of 20,000 smart thermostats, about 12% were consistently overridden (Huchuk et al., Aug 2020).
- The worst group, overridden often and adjusted rarely, was under 5% of devices and performed about 2% worse on heating and 4% worse on cooling than the rest (Huchuk et al., Aug 2020).
Why do programmable thermostats fall short?
They fail on people, not parts. A programmable thermostat that nobody programs saves nothing, and EPA pulled the label for that reason. This gap is the case for thermostats that build the schedule on their own.
Do homes with a programmable thermostat program it?
- Of homes that use central air conditioning and own a programmable thermostat, more than two-thirds control the temperature without programming it (EIA, Jul 2017).
- EPA removed programmable thermostats from the ENERGY STAR program in 2009 over concerns about realized savings (EIA, Jul 2017).
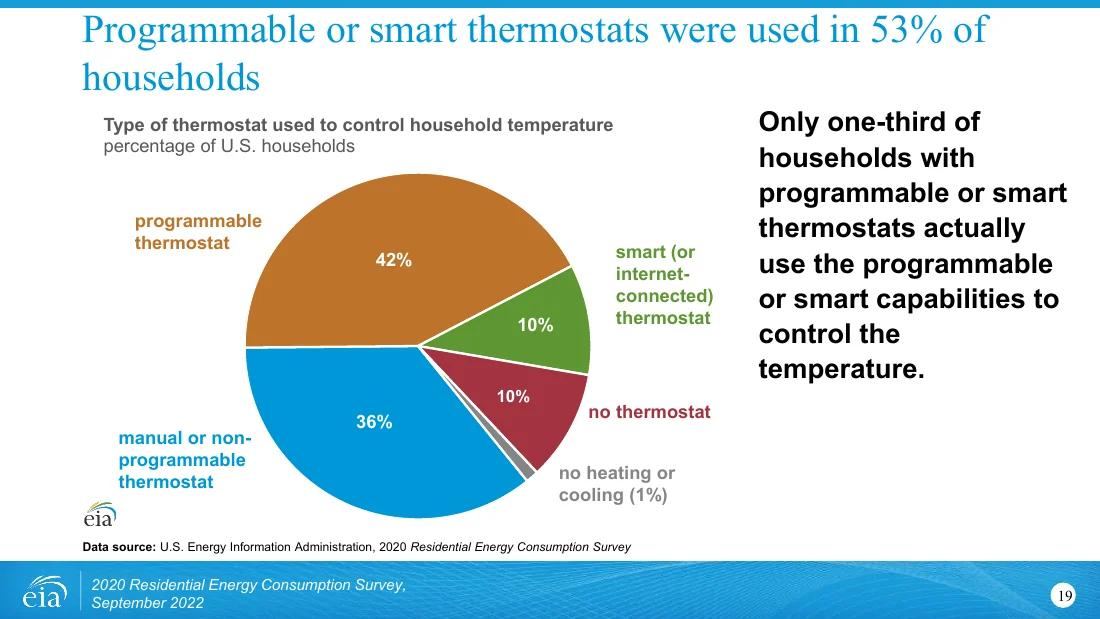
- Across all homes with programmable or smart thermostats, only about one-third use the programmable or smart capabilities (EIA, Sep 2022).
- Only 24% of households with programmable thermostats report running a program (Google Nest, Aug 2024).
- Only 30% of US households owned a programmable thermostat in 2005, although they had been on sale for more than 30 years (Peffer et al., Jun 2011).
What goes wrong in the home?
- 25% of owners said they do not know how to change the program, and 14% did not know where the settings are (Pritoni et al., Jun 2015).
- 33% of the thermostats photographed by respondents were in HOLD (Pritoni et al., Jun 2015).
- 57% of households were occupied nearly all of the time, which limits what any setback can save (Pritoni et al., Jun 2015).
- About 40% of owners said the thermostat was not chosen by a family member, and 70% of users did not know where the manual is (Pritoni et al., Jun 2015).
- 62% believed the thermostat directly controls the temperature of the air leaving the system (Pritoni et al., Jun 2015).
- 39% believed a higher setting heats the house faster (Pritoni et al., Jun 2015).
- 36% believed turning the temperature down when away uses more energy than holding it steady (Pritoni et al., Jun 2015).
Is the interface part of the problem?
- In a lab test of five interfaces, the worst thermostat let only 46% of subjects set it to heat mode (Peffer et al., Mar 2013).
- Reading the next scheduled setting was hardest: the best interface, a web page, reached only 71% completion (Peffer et al., Mar 2013).
- When asked to set the house for an absence of several days, 75% succeeded on the web page and fewer than half did on the button model (Peffer et al., Mar 2013).
How many US homes have a smart thermostat?
About one in ten homes in 2020, and the gap by income, tenure and climate is wide. The 2020 survey is the latest federal count. Owners of newer, larger, wealthier homes lead, so the people who could save the most often have not bought one yet.
What does the federal survey count?
- 52.59 million homes had a programmable thermostat in 2020 (EIA, Mar 2023).
- 44.08 million homes had a non-programmable thermostat (EIA, Mar 2023).
- 12.73 million homes had no thermostat at all (EIA, Mar 2023).
- 10.58 million of the 77.07 million single-family detached homes had a smart thermostat, about 14% by our calculation from the table (EIA, Mar 2023).
- Only 0.94 million of the 22.84 million apartments in buildings with five or more units had one (EIA, Mar 2023).
Who owns one?
- Owners had 11.45 million smart thermostats and renters had 1.33 million (EIA, Mar 2023).
- Homes with income of $150,000 or more had 4.34 million smart thermostats among 16.86 million homes, while homes under $5,000 had 0.14 million among 4.48 million (EIA, Mar 2023).
- Homes built from 2016 to 2020 had 1.02 million smart thermostats among 4.56 million homes, against 1.47 million among the 20.26 million homes built before 1950 (EIA, Mar 2023).
- Very cold and cold climates had 4.13 million among 42.50 million homes, and hot-humid climates had 2.62 million among 22.31 million (EIA, Mar 2023).
How fast is the market growing?
- 37% of smart thermostat owners are Early Majority buyers, up from 26% in 2020 (Parks Associates, Aug 2025).
- Parks Associates forecasts 8.1 million US unit sales and more than $1.1 billion in revenue in 2030 (Parks Associates, Aug 2025).
- 61% of households cite high energy bills as a driver of smart thermostat adoption (Parks Associates, Aug 2025).
- Only 32% of owners view the energy insights in their thermostat (Parks Associates, Aug 2025).
- ENERGY STAR shipments were 4.352 million in 2021, a 60% market share (ENERGY STAR, Dec 2021).
- Roughly 2 million internet-connected thermostats were sold in 2013 and 4 million in 2015 (Daken, Meier and Frazee, Aug 2016).
- NEEP’s baseline for New York smart thermostat penetration in 2016 was 13% to 17%, with the evidence pointing to 14% to 15% (NEEP for NYSERDA, Oct 2016).
Do learning, occupancy and seasonal features add savings?
Some do, a little. The features that change setpoints on the user’s behalf add a few points of savings. The features that only add control add comfort and data.
How much do optimization features add?
- Seasonal Savings averaged 3.3% on cooling and 4.1% on heating across trials from 2017 to 2020 (Google Nest, Aug 2024).
- Those trials covered 1.9 million thermostats in 24 utility territories in 11 states, with a 50% opt-in rate (Google Nest, Aug 2024).
- Participation averaged 45.8% for cooling and 43.0% for heating over the latest two years, so the net gain is smaller than the per-home gain (Google Nest, Aug 2024).
- In the UK, an independent review found Seasonal Savings added 4.5% of heating system gas use among the 85% of eligible users who adopted it (Behavioural Insights Team, Nov 2017).
- In the same review, 49% of UK homes used the common suite of timer, room thermostat and radiator valves (Behavioural Insights Team, Nov 2017).
What do occupancy sensing and optimization controls add?
- In the NREL simulation, occupancy sensing alone was predicted to save 0% to 3% of runtime for most homes (NREL, Apr 2023).
- In a National Grid pilot, homes with HVAC optimization controls saved 16.5% of their cooling load, against 5.1% for Wi-Fi thermostats without them (Cadmus, Aug 2016).
- On heating, the same two groups saved 13.1% and 12.4% of heating gas, a gap too small to matter (Cadmus, Aug 2016).
- As a share of total gas use, the group without controls saved 9.5% and the group with controls saved 9.1% (Cadmus, Aug 2016).
- Of the participants in the heating season, 57% without controls and 65% with controls did not notice a change in comfort (Cadmus, Aug 2016).
- At the end of the UK trial, 26% of users with the product said they change the temperature by how cold or warm it is rather than by schedule (UK DESNZ, Jun 2023).
How much peak demand can smart thermostats cut?
Each thermostat sheds about a kilowatt for a few hours, and a utility can multiply that across enrolled homes. That is the grid case for smart thermostats, and it is separate from the bill case.
How big is one thermostat’s event?
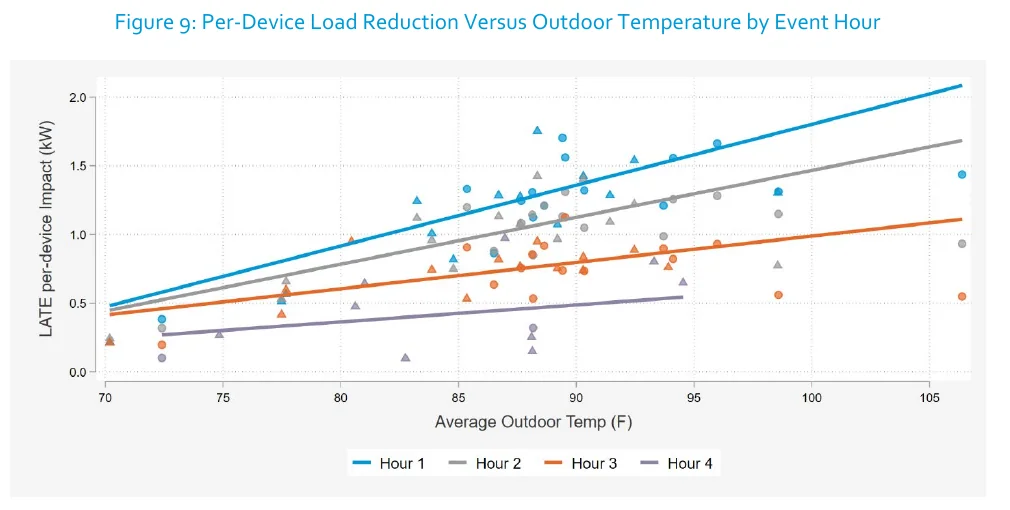
- Average demand response savings were 0.91 kW per opt-in thermostat in summer 2019, across 55 events (Demand Side Analytics, Nov 2020).
- That equals about 25 MW across the study regions if all were dispatched on the same day (Demand Side Analytics, Nov 2020).
- In summer 2020, across 28 events, the regional total scaled to about 29 MW (Demand Side Analytics, Nov 2020).
- In hot-humid regions in 2020, the first event hour cut 1.63 kW, against 0.78 kW in the third hour (Demand Side Analytics, Nov 2020).
- On the example 2019 event day, only about 45% of the test group received the demand response algorithm (Demand Side Analytics, Nov 2020).
- Consumers Energy measured 0.9 kW saved per Nest event in 2020, and five other utilities averaged 1.06 kW between 2020 and 2022 (Google Sustainability, Jan 2024).
How many homes are enrolled?
- More than 110 utilities in the US and Canada offered Nest demand response to over one million actively enrolled customers by the end of 2023 (Google Sustainability, Jan 2024).
- During a 2022 California heat wave, enrolled Nest customers added 75 MW of peak reduction capacity (Google Sustainability, Jan 2024).
- The utility APS managed over 50,000 smart thermostats and was targeting 100,000 (Brattle Group, May 2023).
- In Brattle’s modeled virtual power plant, which includes smart thermostats among other devices, capacity cost roughly 40% of the net cost of a gas peaker and 60% of the net cost of a battery (Brattle Group, May 2023).
- ENERGY STAR smart thermostats must be able to work with utility demand response programs, with no required response (ENERGY STAR, Jun 2017).
Do customers accept the events?
- In a National Grid pilot, the curtailment settings were acceptable to 91% of participants (Cadmus, Aug 2016).
- Between 65% and 80% of participants, depending on the event, did not notice a change in comfort (Cadmus, Aug 2016).
How do smart thermostats work with heat pumps?
Heat pumps are where a careless setback can backfire. A deep overnight drop can trigger electric backup heat in the morning, which costs more than the heat pump would have. Smart thermostats built for heat pumps manage this, but field data is thin.
What do official sources warn about?
- DOE says not to set back a heat pump without a smart or programmable thermostat designed for heat pumps (U.S. DOE, Aug 2022).
- DOE also warns against a manual setback that makes the backup electric-resistance heating come on (U.S. DOE, Aug 2022).
- ENERGY STAR requires makers to report average resistance heat use in 5 degree F outdoor temperature bins from 0 to 60 degrees F, but sets no pass line for it (ENERGY STAR, Dec 2016).
- EPA advises that homes with variable-capacity heat pumps or air conditioners perform best with the manufacturer-recommended thermostat (ENERGY STAR, Jun 2017).
What did metered heat pump homes show?
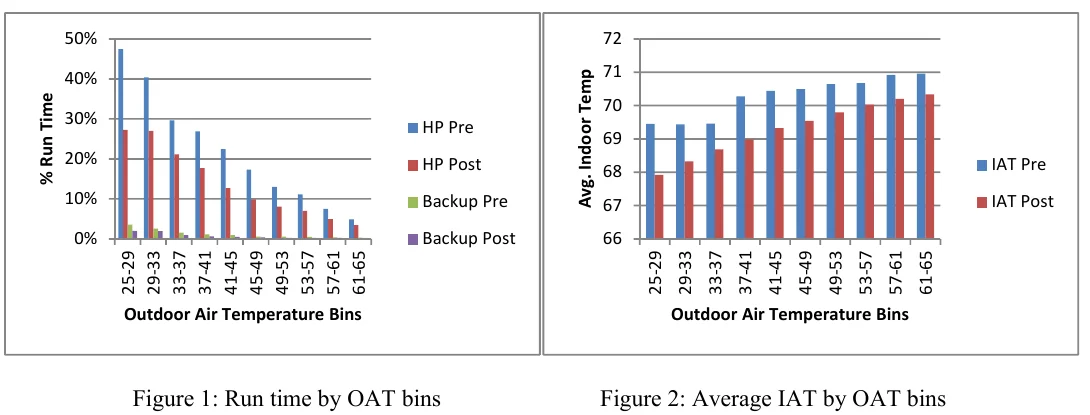
- In eight metered homes, compressor run time fell from 26% to 13% after the install (Bonneville Power Administration, Aug 2016).
- Backup heat run time fell from 1.5% to 0.6% (Bonneville Power Administration, Aug 2016).
- Average indoor temperature fell from 70.52 to 69.66 degrees F, which explains part of the cut (Bonneville Power Administration, Aug 2016).
- Backup heat ran more in the two coldest delta-t bins, which the authors tied to more aggressive nighttime setbacks (Bonneville Power Administration, Aug 2016).
- One home that set back to 64 degrees F at night before the install set back to 60 degrees F after it (Bonneville Power Administration, Aug 2016).
- Billing analysis of the larger sample found average savings of 885 kWh a year, about 4.06% of total household use (Bonneville Power Administration, Aug 2016).
- Energy Trust of Oregon found savings of roughly 12% of heating load in its earlier Nest heat pump control pilot (Apex Analytics for Energy Trust of Oregon, Mar 2016).
Can the ENERGY STAR test measure every system?
- The hybrid run time metric deals poorly with systems where energy use is not roughly proportional to run time (Daken, Meier and Frazee, Aug 2016).
- EPA has no method for thermostats paired with variable-speed HVAC, because its current method assumes a linear link between run time and the indoor to outdoor temperature difference (NREL, Apr 2023).
A thermostat can only manage the capacity it controls. If a heat pump or furnace is the wrong size, no schedule fixes it, so check the load first with the heat pump sizing calculator.
What does a smart thermostat cost, and how fast does it pay back?
Cost is low next to the equipment it controls, and payback depends on how much heating and cooling a home buys. A big bill pays back fast. A small bill does not.
What is the bill at stake?
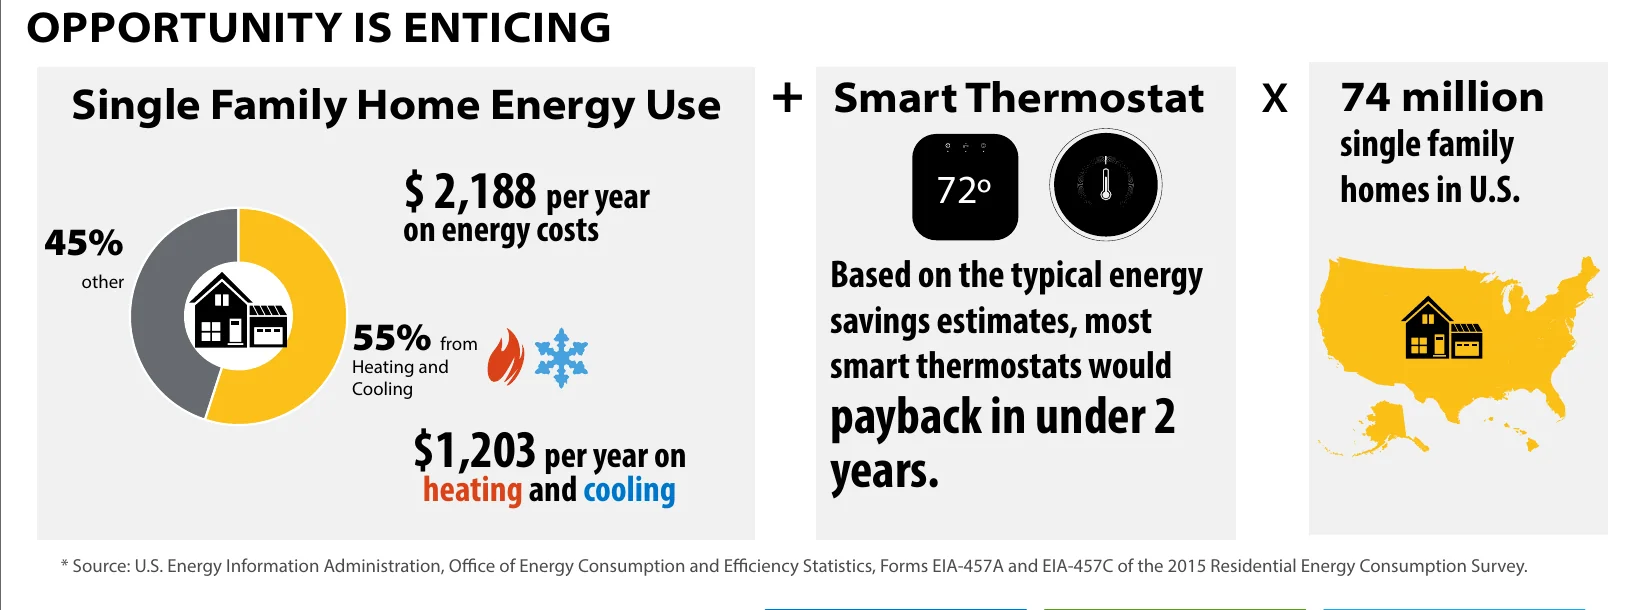
- The average single-family home spent $2,188 a year on energy, of which $1,203 was heating and cooling, using 2015 survey data (NREL, Apr 2023).
- NREL says that based on typical savings estimates, most smart thermostats would pay back in under 2 years (NREL, Apr 2023).
- NREL counts 74 million single-family homes in the US as the market (NREL, Apr 2023).
- ENERGY STAR says almost half of the average household’s annual energy bill, more than $900 a year, goes to heating and cooling (ENERGY STAR, Oct 2026).
What does the thermostat itself cost?
- ENERGY STAR lists smart thermostat prices from $50 to $300, depending on features (ENERGY STAR, Oct 2026).
- In the Oregon pilot, both models retailed for about $250 at launch (Apex Analytics for Energy Trust of Oregon, Mar 2016).
- Energy Trust offered the units at $219 through a bulk purchase and paid a $200 rebate, so participants paid $19 (Apex Analytics for Energy Trust of Oregon, Mar 2016).
- Con Edison’s online marketplace gave a $50 instant discount and moved 4,900 units in 2018, against 2,400 units for its $50 mail-in appliance rebate (Con Edison, Dec 2018).
- Con Edison paid an $85 rebate to customers who joined its bring-your-own-thermostat demand response program (Con Edison, Dec 2018).
- ENERGY STAR reported that the overwhelming majority of rebate programs ask customers to bring their own thermostat, and that programs allowing DIY and professional installs split about 50/50 (ENERGY STAR, Jun 2017).
A thermostat trims the bill of a system that already fits the house. If the bill is large because the system is oversized or the house leaks, size the load first with the BTU calculator. Other upgrades that cut the same bill are covered in home energy efficiency statistics.
Methodology and Sources
Each figure comes from the body that produced it: a federal agency, a national laboratory, a state regulator, a utility evaluator, a peer-reviewed journal, or the company itself when the claim is the company’s own. We opened every link and read the number on the page or in the document. Vendor claims are labeled as vendor claims. Percentages for smart thermostats are not directly comparable across studies, because they use different baselines (constant setpoint, manual thermostat or programmable thermostat), different outcomes (run time, billed energy or whole-home use) and different years. The few shares marked as calculated are our division of two counts in the same EIA table. Dates are the date of the data or document. Undated web pages carry the month we checked them. We refresh the page every month.
This page is an overview of published research. It is not engineering or legal advice, and it is not affiliated with any thermostat maker.
Glossary
- DR: demand response, a utility program that asks homes to use less power at peak times.
- HVAC: heating, ventilation and air conditioning.
- ITT: intention to treat, an analysis of everyone offered a product, whether or not they used it.
- MMBtu: one million British thermal units of energy.
- RECS: the Residential Energy Consumption Survey run by the U.S. Energy Information Administration.
- TRM: technical reference manual, the state document that sets deemed savings for efficiency measures.
- VPP: virtual power plant, many small devices managed together to act like one power plant.
Sources
- Apex Analytics for Energy Trust of Oregon, Smart Thermostat Pilot Evaluation
- Behavioural Insights Team, The Nest Learning Thermostat: Making energy savings easy
- Bonneville Power Administration, Sub-metering Data Analysis and Savings Assessment of the Nest Learning Thermostat (ACEEE Summer Study)
- Brattle Group for Google, Real Reliability: The Value of Virtual Power
- Cadmus, Smart Thermostats and the Triple Bottom Line (ACEEE Summer Study)
- Con Edison and partners, Best Practices for Managing Smart Thermostat Programs (ENERGY STAR partner meeting)
- Daken, Meier and Frazee, Do Connected Thermostats Save Energy? (ACEEE Summer Study)
- Demand Side Analytics for ecobee, Eco+ Thermostat Optimization Pilot
- DNV for the California Public Utilities Commission, Forward-looking Smart Thermostat Study
- ecobee, Savings from your ecobee
- EIA, 2020 RECS Table HC6.1, Space heating in U.S. homes by housing unit type
- EIA, 2020 RECS Table HC6.2, by owner or renter status
- EIA, 2020 RECS Table HC6.3, by year of construction
- EIA, 2020 RECS Table HC6.5, by household income
- EIA, 2020 RECS Table HC6.6, by climate region
- EIA, 2020 RECS Table HC7.1, Air conditioning in U.S. homes
- EIA, 2020 Residential Energy Consumption Survey webinar
- EIA, Today in Energy: One in eight U.S. homes uses a programmed thermostat with a central air conditioning unit
- ENERGY STAR, Smart Thermostats (Home Upgrade)
- ENERGY STAR, Smart Thermostats FAQs for EEPS
- ENERGY STAR, Unit Shipment and Market Penetration Report, Calendar Year 2021
- ENERGY STAR, Unit Shipment and Market Penetration Report, Calendar Year 2022
- Google Nest, Energy Savings from Google Nest Thermostats (white paper)
- Google Sustainability, One click away: your home’s thermostat can save energy and the grid
- Guidehouse for Massachusetts program administrators, Residential Wi-Fi and Programmable Thermostat Impacts (RES 24)
- Huchuk, O’Brien and Sanner, Exploring smart thermostat users’ schedule override behaviors, Science and Technology for the Built Environment
- NEEP and SEE Change Institute for NYSERDA, New York Smart Thermostat Market Characterization
- NREL, Benchmarking Smart Thermostats (DOE BTO Peer Review poster)
- NREL, Smart Thermostat Evaluation Protocol (Uniform Methods Project)
- Parks Associates, Smart Thermostat Market Assessment 2025 press release
- Peffer et al., Facilitating energy savings with programmable thermostats, Ergonomics
- Peffer et al., How people use thermostats in homes: A review, Building and Environment
- Pritoni et al., Energy efficiency and the misuse of programmable thermostats, Energy Research & Social Science
- U.S. DOE, Energy Saver Guide 2022
- UK DESNZ, Smart Thermostat (SEN-ST) Trial Level Evaluation Report