Insulation statistics tell you how much of the heat in a house you can keep. Most homes have some insulation, and fewer have enough. The gap is largest in old homes, rented homes and small buildings, and it is where the cheapest savings sit.
This page follows each number to the agency, lab, regulator or research group that produced it. Every figure carries a date and a link to the source itself. We skip roundups and republished figures. Where two sources measure the same thing differently, we show each under its own name.
The data covers US homes by age, tenure, income and climate, modeled attic and wall coverage, code R-values, savings and costs, incentives and jobs, the market, England, Scotland, the EU, and the health evidence.
Key Takeaways
- About 26.8 million US homes, one in five, were poorly insulated or not insulated at all in 2024 (EIA, Mar 2026).
- Homes built before 1950 were poorly insulated or uninsulated 37% of the time, against 7% for homes built from 2010 to 2019 (EIA, Mar 2026).
- Renters lived in a poorly insulated or uninsulated home 30% of the time, against 16% for owners (EIA, Mar 2026).
- An attic floor insulation upgrade applies to 42.9% of US dwellings in the national model (National Laboratory of the Rockies, Apr 2026).
- Light air sealing, attic insulation and duct upgrades would cut 14% of site energy across the modeled US housing stock, or 461 TWh (National Laboratory of the Rockies, Sep 2026).
- The 2024 IECC cut required attic insulation from R-49 to R-38 in climate zones 2 and 3, and from R-60 to R-49 in zones 4 to 8 (PNNL, Jan 2025).
- In an experimental evaluation of the largest US residential efficiency program, the upfront cost was about twice the energy it saved (NBER, Jul 2015).
- Low-income households weatherized through DOE’s program save on average $372 or more every year (DOE, Oct 2025).
- Insulation workers held 71,900 US jobs in 2025 (BLS, Aug 2026).
- Grand View Research valued the global insulation market at USD 74.0 billion in 2025 (Grand View Research, Jun 2026).
- More than 2.7 million English households lived in homes with under 100 mm of loft insulation in 2024-25 (English Housing Survey, May 2026).
- 67% of Scottish homes with a loft had 200 mm or more of insulation in 2024, up from 27% in 2009 (Scottish Government, Feb 2026).
- Insulating existing New Zealand houses roughly halved the odds that a child took a day off school (adjusted odds ratio 0.49) (BMJ, Feb 2007).
- Only about 1% of EU buildings a year get an energy renovation (European Commission, Sep 2026).
Which US Homes Have the Weakest Insulation?
Most Americans call their home fine. The weak spots are old houses, small buildings, rentals and low incomes.
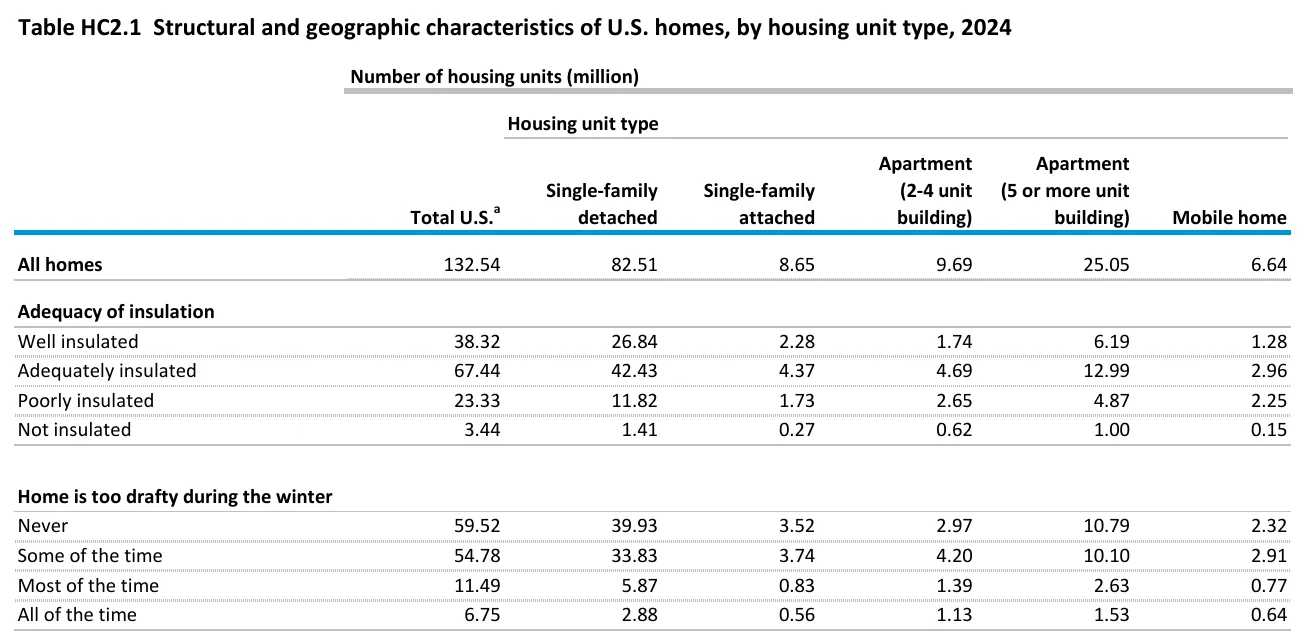
How do occupants rate their insulation?
- Occupants rated 38.32 million of the 132.54 million occupied US homes as well insulated (EIA, Mar 2026).
- Another 67.44 million homes were rated adequately insulated, the largest group (EIA, Mar 2026).
- 11.49 million homes were too drafty most of the winter, and another 6.75 million all of the winter (EIA, Mar 2026).
Do newer homes do better?
- In the 1980s group, 3.18 million of 16.60 million homes, or 19%, were poorly insulated or not insulated (EIA, Mar 2026).
- Of 6.06 million homes built since 2020, 3.40 million, or 56%, were rated well insulated (EIA, Mar 2026).
Does income or building type matter?
- 7.98 million of 25.55 million homes with household income under $30,000 were poorly insulated or not insulated, or 31% (EIA, Mar 2026).
- Among homes with income of $200,000 or more, 11% were in that group (EIA, Mar 2026).
- Mobile homes were the weakest type, with 36% poorly insulated or not insulated (EIA, Mar 2026).
- Apartments in 2 to 4 unit buildings followed at 34% (EIA, Mar 2026).
- Single-family detached homes did best among the main types at 16% (EIA, Mar 2026).
Which climates have the weakest homes?
- In mixed-dry and hot-dry climates, 4.00 million of 16.28 million homes, or 25%, were poorly insulated or not insulated (EIA, Mar 2026).
- Hot-humid climates were lowest among the five regions at 17% (EIA, Mar 2026).
How Much of the US Housing Stock Could Still Take More Insulation?
Surveys tell you what people think. Modeling tells you what is in the attic and the walls, and the answer is that a large part of the stock is still short of today’s guidance. These figures come from national lab models, so treat them as estimates of a typical stock, not counts of homes.
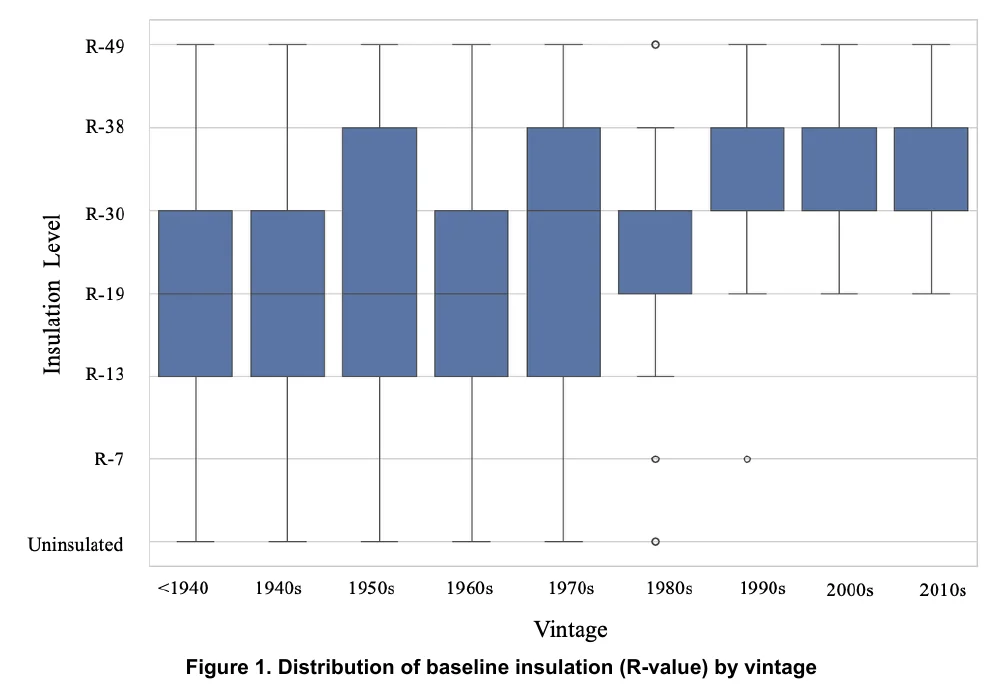
How old is the stock the model describes?
- Homes built before 1992, when the federal residential energy code program began, are about 70% of the US residential stock (PNNL, Mar 2022).
- The attic upgrade applies to 42.3% of homes in climate zones 2 to 8 and 0.6% in zone 1 (National Laboratory of the Rockies, Apr 2026).
What do the walls look like?
- Uninsulated wood-stud walls are 30.5% of the modeled baseline stock (National Laboratory of the Rockies, Mar 2026).
- Wood-stud walls with R-11 insulation are 22.7% of the stock (National Laboratory of the Rockies, Mar 2026).
- Uninsulated three-wythe brick walls are another 9.9% (National Laboratory of the Rockies, Mar 2026).
- 92% of dwellings leak at 6 ACH50 or more, so advanced air sealing applies to almost every home (National Laboratory of the Rockies, Mar 2026).
What would upgrades add up to?
- Attic floor insulation alone would cut total site energy by 2.2%, or 76 TWh a year (National Laboratory of the Rockies, Apr 2026).
- Air sealing plus drill-and-fill wall insulation would cut total site energy by 22% (National Laboratory of the Rockies, Mar 2026).
- That package would cut natural gas heating by 37% (National Laboratory of the Rockies, Mar 2026).
- The light package saves an average 3,570 kWh per upgraded home (National Laboratory of the Rockies, Sep 2026).
- At least one part of the light package fits 92.5% of homes, and only 22.9% need all three parts (National Laboratory of the Rockies, Sep 2026).
- An earlier national study put the cost-effective electricity saving from drill-and-fill wall insulation at 30 TWh a year (NREL, Dec 2017).
- The same study put attic insulation to R-49 or R-60 at 18 TWh a year (NREL, Dec 2017).
What R-Values Do Codes and Guides Ask For?
R-values are not a matter of taste. The model energy code and DOE guidance set them by climate zone, and the numbers are the starting point for any heat loss calculation, so a tech sizing a system should know them cold.
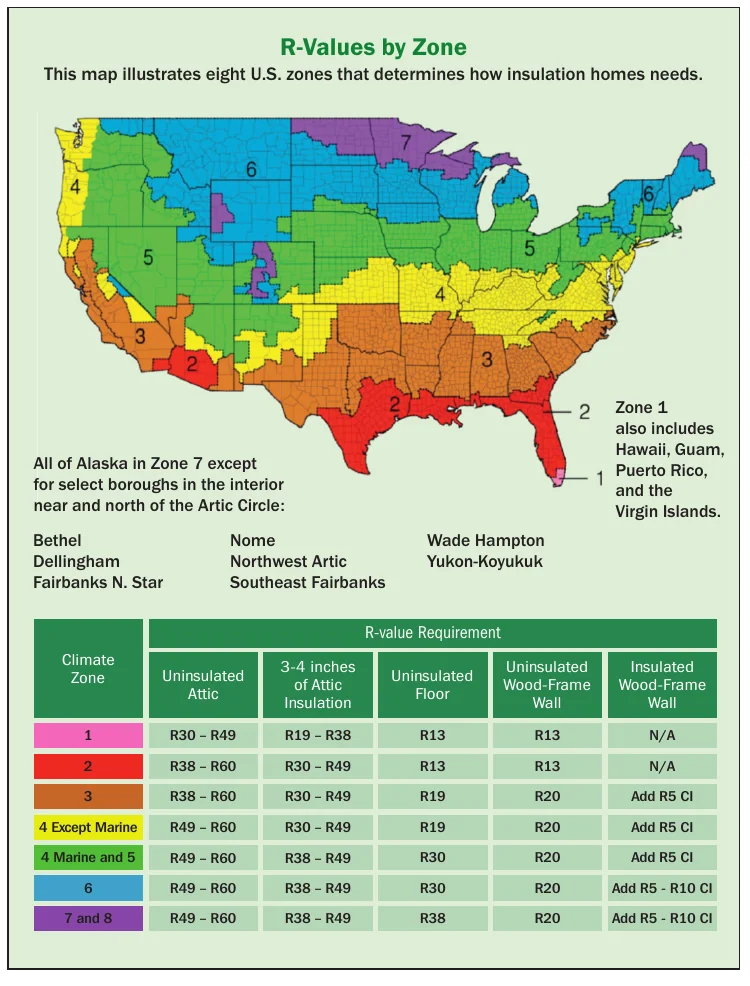
What does the model code ask for in an attic?
- The 2021 IECC asks for R30 in an uninsulated attic in climate zone 1 (DOE, Oct 2024).
- It asks for R49 in zones 2 and 3 (DOE, Oct 2024).
- It asks for R60 in zones 4 to 8 (DOE, Oct 2024).
The 2024 edition lowered these attic values in zones 2 to 8, as the Key Takeaways note.
What about walls and ducts?
- A 2x4 wood-frame wall in zone 3 needs R20, or R13 plus R5 continuous insulation, or R0 plus R15 continuous (DOE, Oct 2024).
- In zones 4 to 8 the same wall needs R20 plus R5 continuous, R13 plus R10, or R0 plus R20 continuous (DOE, Oct 2024).
- Walls and rim joists typically make up more than 40% of the envelope area (DOE, Oct 2024).
- Ducts of 3 inches or more outside conditioned space need R-8, and smaller ducts need R-6 (DOE, Oct 2024).
- Caulking and weatherstripping often pay for themselves in one year or less (DOE, Oct 2024).
What does DOE suggest for existing homes?
- For an uninsulated attic, DOE suggests R30 to R49 in zone 1 and R49 to R60 in zones 7 and 8 (DOE Energy Saver, Aug 2021).
- For an uninsulated floor over an unheated space, it suggests R13 in zones 1 and 2 and R38 in zones 7 and 8 (DOE Energy Saver, Aug 2021).
How do you estimate what is already there?
- For fiberglass batts, multiply the thickness in inches by 3.2 to estimate R-value (DOE and ORNL, Feb 2008).
- For foam board or sprayed foam, multiply the thickness in inches by 5 (DOE and ORNL, Feb 2008).
- Band joists should get R-30 in most of the country and R-19 in zone 1 (DOE and ORNL, Feb 2008).
What does the extra R-value cost?
- Installing R-38 cellulose in a ceiling costs an estimated $1.84 per square foot (PNNL, Jan 2025).
- R-49 costs an estimated $2.32 per square foot (PNNL, Jan 2025).
- R-60 costs an estimated $2.85 per square foot (PNNL, Jan 2025).
- The whole 2024 IECC package, measured against the 2021 code, averages a 2.5 year simple payback (PNNL, Jan 2025).
When insulation changes, the heating and cooling load changes with it. Check the new load with a free BTU calculator before you size equipment.
What Does Adding Insulation Save?
Insulation saves the most where winters are long, and it saves the least where the heat is mild. Real homes also tend to save less than the model on the contractor’s tablet.
How much do upgrades save by climate zone?
- In climate zone 4C, sealing and insulating the cost-effective spots cuts heating and cooling bills by an estimated 20% (ENERGY STAR, Oct 2026).
- In zone 7 the estimate is 19% (ENERGY STAR, Oct 2026).
- In zone 2 it is 9% (ENERGY STAR, Oct 2026).
- In zone 1 it is 7% (ENERGY STAR, Oct 2026).
- ENERGY STAR’s headline claim for sealing and insulating is up to a 10% saving on annual energy bills (ENERGY STAR, Oct 2026).
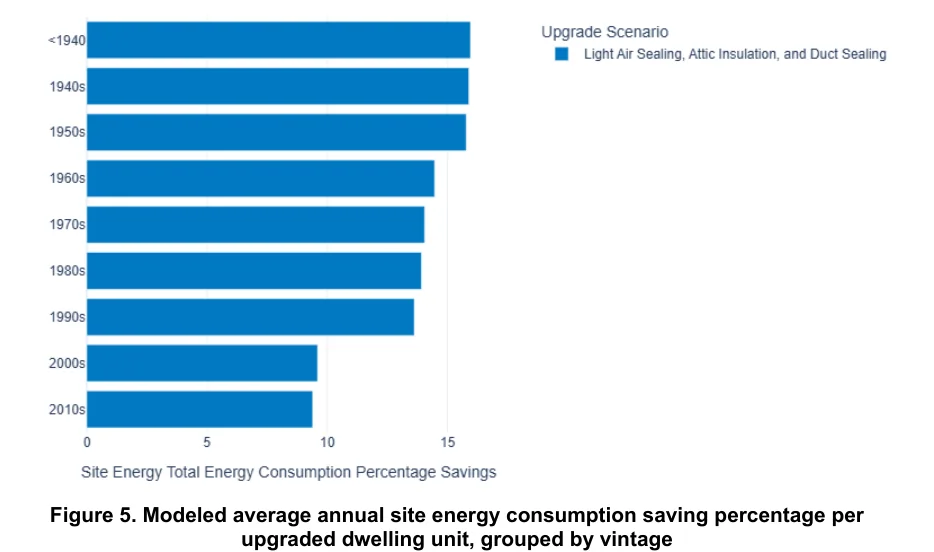
Do older homes save more?
- Homes built before the 1960s reach close to 16% annual energy savings from the light package (National Laboratory of the Rockies, Sep 2026).
- Homes built after the 2000s reach less than 10% (National Laboratory of the Rockies, Sep 2026).
Do real homes save what models promise?
- In a randomized evaluation of the largest US residential efficiency program, model-projected savings were roughly 2.5 times the actual savings (NBER, Jul 2015).
- The authors found an average rate of return of about -9.5% a year, even after counting social benefits (NBER, Jul 2015).
- The experiment covered a sample of more than 30,000 households (NBER, Jul 2015).
Smaller loads can leave an old system oversized. After an envelope upgrade, rerun the numbers with the AC tonnage calculator before a swap.
What Do Incentives and Insulation Jobs Look Like?
The federal credit for this work is over, but its rules still show what counts as good work. The trade behind it is small and steady, and the pay and openings are modest and predictable.
What did the federal credit cover?
- Insulation and air sealing had to meet the IECC edition in effect two years before the year of installation (IRS, Apr 2026).
- Insulation and air sealing were the only qualifying property that did not need a qualified manufacturer ID (IRS, Apr 2026).
- A home energy audit could earn a credit of up to $150 (IRS, Apr 2026).
What do insulation workers earn?
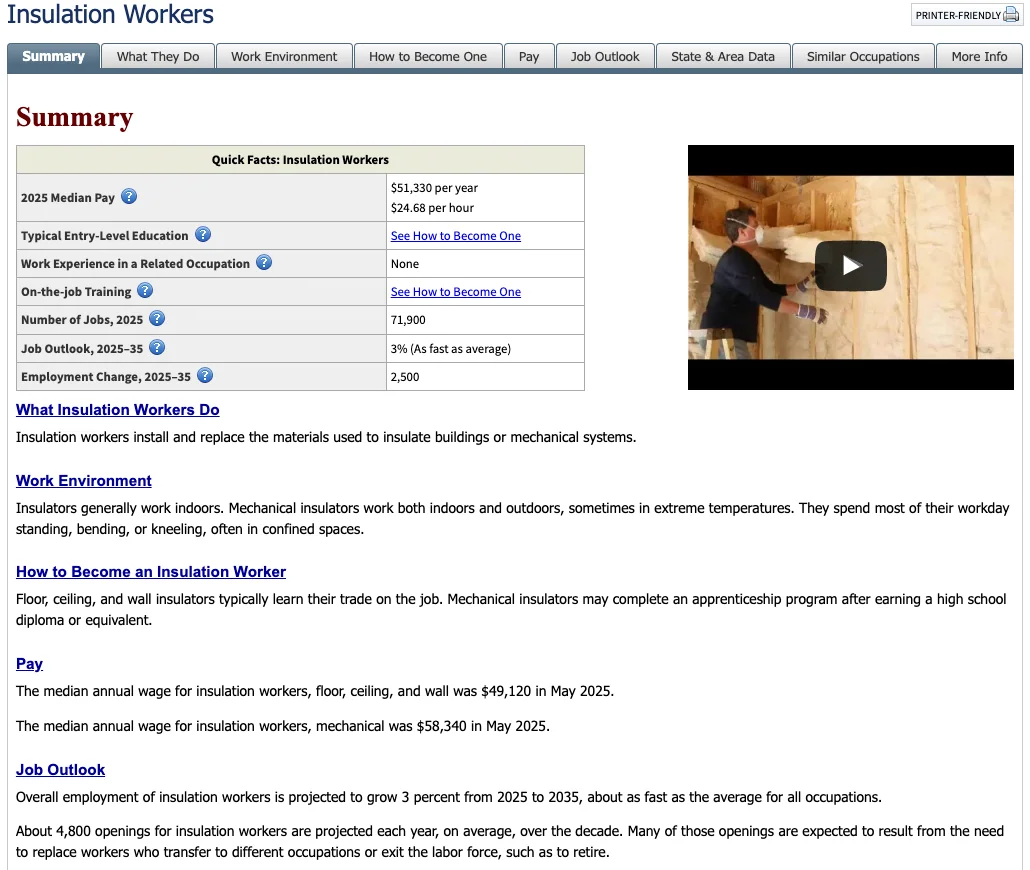
- Insulation workers as a group had a median pay of $51,330 a year in 2025 (BLS, Aug 2026).
- Floor, ceiling and wall insulators had a median wage of $49,120 in May 2025 (BLS, Aug 2026).
- Mechanical insulators had a median wage of $58,340 in May 2025 (BLS, Aug 2026).
Is the trade growing?
- BLS projects 3% employment growth from 2025 to 2035 (BLS, Aug 2026).
- That is a gain of 2,500 jobs over the decade (BLS, Aug 2026).
- About 4,800 openings a year are projected, most of them to replace workers who leave (BLS, Aug 2026).
How Big Is the Insulation Market, and What Is It Made Of?
Nobody agrees on the size of the market, and the firms that sell the reports do not even agree on which region leads. Read each figure under its own name and treat the totals as ranges.
How big is the market?
- Grand View Research projects the global insulation market to reach USD 127.7 billion by 2033, a 7.1% annual rate (Grand View Research, Jun 2026).
- Asia Pacific held 42.9% of that market in 2025 (Grand View Research, Jun 2026).
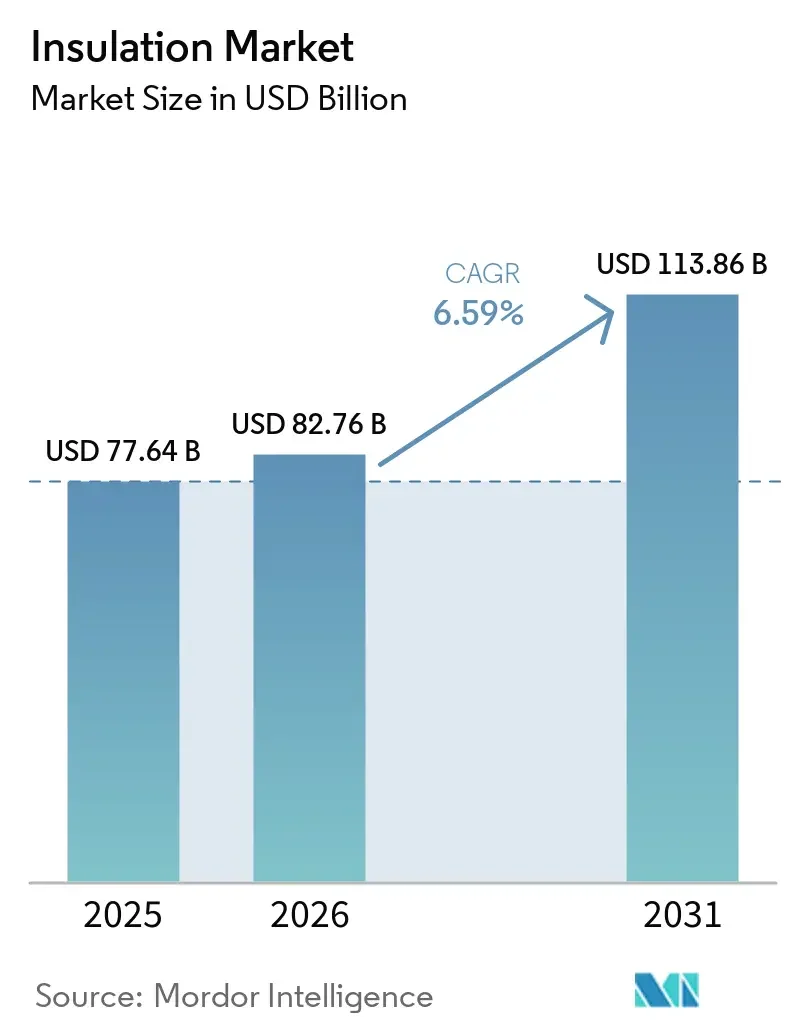
- Mordor Intelligence puts the 2025 market at USD 77.64 billion, and a 36.93% share for Europe (Mordor Intelligence, Sep 2026).
- Mordor projects USD 113.86 billion by 2031 (Mordor Intelligence, Sep 2026).
- Narrowed to building thermal insulation, Grand View Research sized 2025 at USD 28.4 billion (Grand View Research, Jun 2026).
- It projects USD 45.2 billion by 2033 (Grand View Research, Jun 2026).
Where does the demand sit?
- Residential buildings took 56.27% of the 2025 insulation market in Mordor’s count (Mordor Intelligence, Sep 2026).
- In Grand View Research’s building-only count, residential took 53.3% (Grand View Research, Jun 2026).
- Walls were the largest application at 42.3% of building thermal insulation (Grand View Research, Jun 2026).
- Roof insulation held 29.64% of Mordor’s total market (Mordor Intelligence, Sep 2026).
Which materials lead?
- Fiberglass held 36.38% of the 2025 insulation market (Mordor Intelligence, Sep 2026).
- Glass wool held 37.0% of building thermal insulation (Grand View Research, Jun 2026).
- Expanded polystyrene was the largest product in the all-uses market at 28.1% (Grand View Research, Jun 2026).
How much recycled content is in it?
- Fiberglass insulation contains 40% to 60% recycled content, depending on the maker and plant (NAIMA, Oct 2026).
- Slag wool contains 70% to 75% recycled blast furnace slag (NAIMA, Oct 2026).
- Rock wool contains an average of 10% to 15% (NAIMA, Oct 2026).
What about vermiculite?
- 15% of exfoliated vermiculite sold in the US went into insulation (USGS, Jan 2026).
- US producers made about 100,000 tons of vermiculite concentrate (USGS, Jan 2026).
- Global production was an estimated 460,000 tons in 2025 (USGS, Jan 2026).
- A mine near Libby, Montana, supplied more than 70% of US vermiculite sold from 1919 to 1990, and that vermiculite carried asbestos (EPA, Apr 2026).
How Well Insulated Are Homes in England?
England counts its insulation in millimeters and in schemes, and it shows how slowly a stock changes. Wall insulation sits near half of homes, and the old solid-wall houses are the hard part.
Which homes have solid wall insulation?
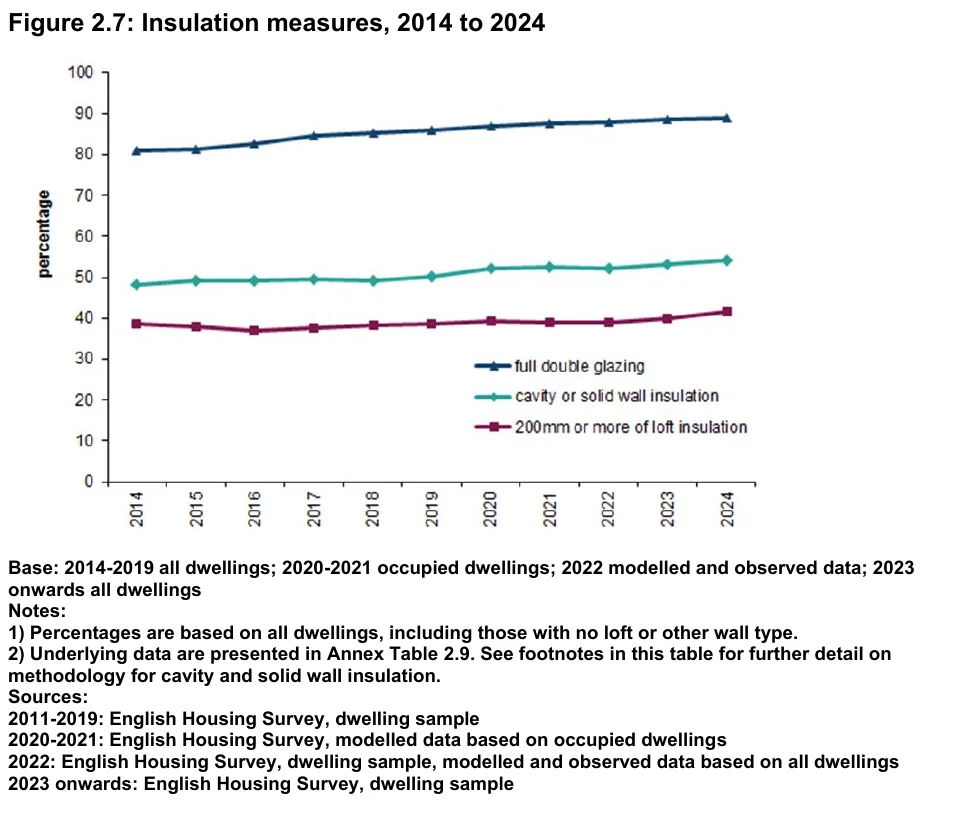
- 37% of housing association homes with solid walls were insulated, against 11% of owner-occupied and 10% of private rented homes (English Housing Survey, Jan 2026).
- Local authority solid-wall homes were at 34% (English Housing Survey, Jan 2026).
- About 642,000 homes had internal wall insulation and 666,000 had external wall insulation (English Housing Survey, May 2026).
- 46% of homes built before 1919 had internal insulation (English Housing Survey, May 2026).
What is in the English loft?
- Mineral wool or fiberglass was the loft material in 94% of insulated lofts, just under 18 million dwellings (English Housing Survey, May 2026).
- Rigid foam board was in about 795,000 dwellings (English Housing Survey, May 2026).
- Spray foam was in 231,000 (English Housing Survey, May 2026).
- Vermiculite beads were still in 88,000 (English Housing Survey, May 2026).
Who lives with too little loft insulation?
The fact sheet counts households whose homes have under 100 mm of loft insulation.
- 1.2 million of those households, or 43%, had uninsulated solid walls (English Housing Survey, May 2026).
- Another 677,000, or 25%, had uninsulated cavity walls (English Housing Survey, May 2026).
- Just over 1 million of them included someone with a long-term illness or disability (English Housing Survey, May 2026).
- 197,000 had serious condensation in one or more rooms (English Housing Survey, May 2026).
- 484,000 said they felt cold in their homes (English Housing Survey, May 2026).
How many measures have the schemes installed?
- The Energy Company Obligation installed 800,667 loft insulation measures in Great Britain from January 2013 to April 2026 (DESNZ, Jun 2026).
- It installed 290,918 solid wall insulation measures (DESNZ, Jun 2026).
- The scheme reached 2,596,044 unique properties (DESNZ, Jun 2026).
- Of 143,305 loft insulation measures under ECO4, 113,693 went into lofts that already held 100 mm or less (DESNZ, Jun 2026).
- The Great British Insulation Scheme had installed 139,136 measures by March 2026 (DESNZ, Jun 2026).
- It upgraded 100,940 households (DESNZ, Jun 2026).
- Cavity wall insulation was the top measure at 51,413 (DESNZ, Jun 2026).
- Loft insulation followed at 39,496 (DESNZ, Jun 2026).
What Do Scotland and the EU Show About Insulation Over Time?
Scotland is the proof that a stock can be moved. It set a rule for social housing, kept measuring, and got most lofts to a high depth. The EU is still at the start of that road.
How deep is Scottish loft insulation?
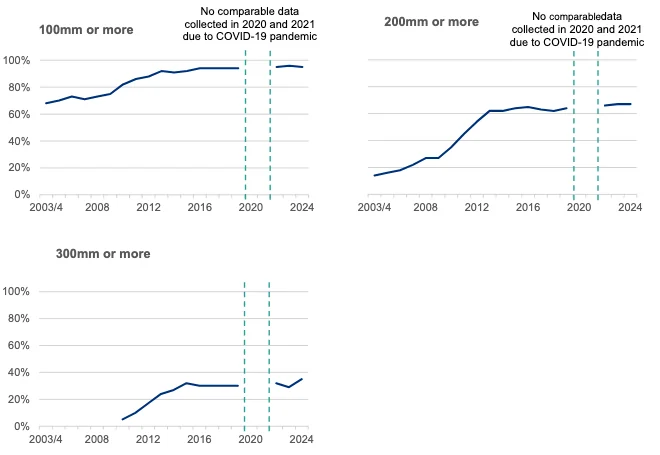
- 95% of Scottish dwellings with a loft had 100 mm or more of insulation in 2024 (Scottish Government, Feb 2026).
- 35% had a high standard of 300 mm or more (Scottish Government, Feb 2026).
- Lofts with no insulation fell from 6% in 2003/4 to about 1% in 2024 (Scottish Government, Feb 2026).
What about Scottish walls?
- 71% of Scottish cavity wall dwellings were insulated in 2024 (Scottish Government, Feb 2026).
- Only 20% of solid wall dwellings were insulated (Scottish Government, Feb 2026).
- 56% of private homes had wall insulation, against 72% of social homes (Scottish Government, Feb 2026).
How is the EU pushing insulation?
- The recast Energy Performance of Buildings Directive entered into force on 28 May 2024, and countries had until 29 May 2026 to write it into national law (European Commission, Sep 2026).
- Around 40% of the energy used in the EU goes to buildings (European Commission, Sep 2026).
- About 80% of the energy used in EU homes goes to heating, cooling and hot water (European Commission, Sep 2026).
- The 2020 Renovation Wave strategy aims to at least double the annual energy renovation rate by 2030 (European Commission, Sep 2026).
Does Better Insulation Make People Healthier?
Warmth is the point of insulation, and the best trials show it moves health measures too, not only bills. The effect is strongest for people who start out cold.
What did the New Zealand trial find?
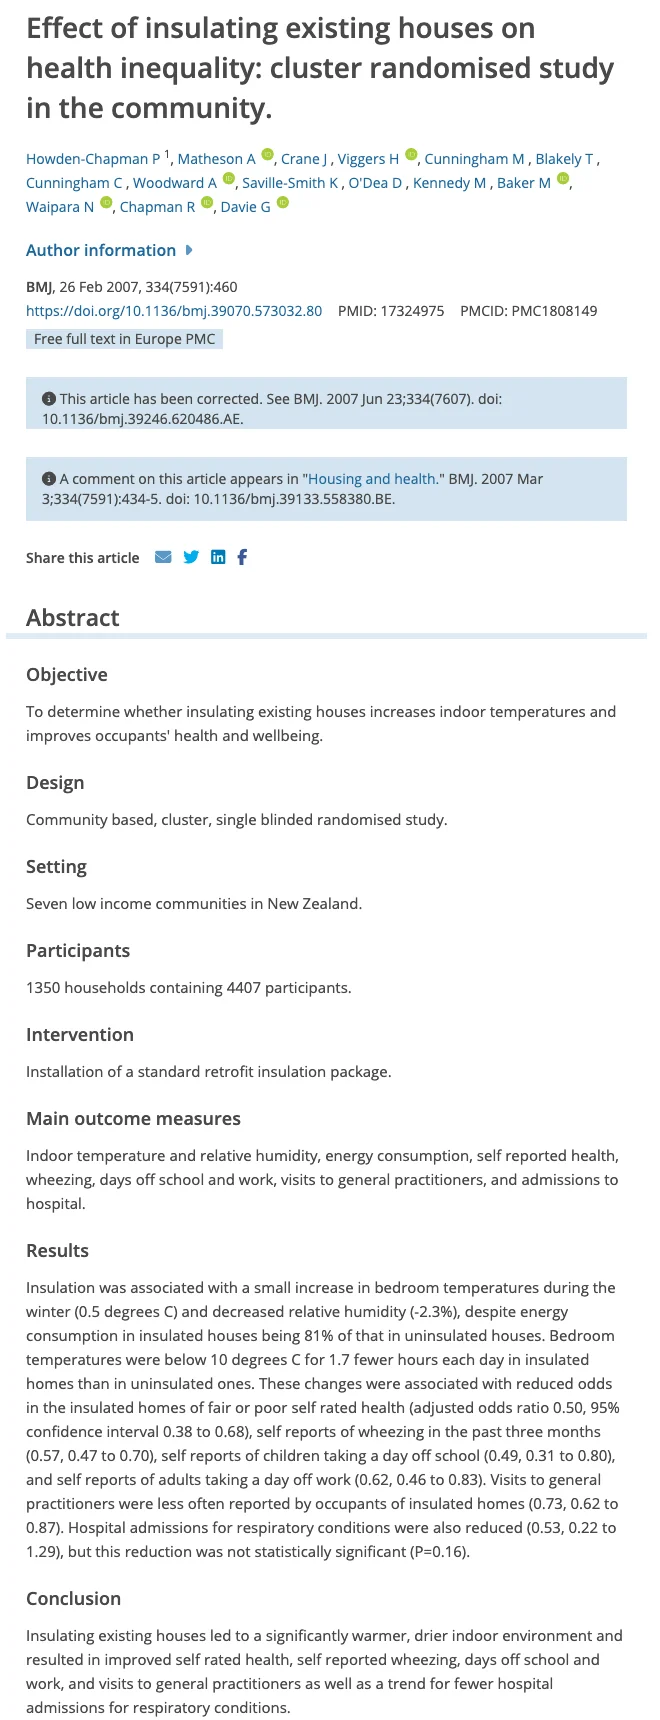
- The trial covered 1,350 households with 4,407 people in seven low income communities (BMJ, Feb 2007).
- Bedrooms in insulated houses were 0.5 degrees C warmer in winter (BMJ, Feb 2007).
- Relative humidity fell by 2.3% (BMJ, Feb 2007).
- Insulated houses used 81% of the energy that uninsulated houses used (BMJ, Feb 2007).
- Bedrooms stayed below 10 degrees C for 1.7 fewer hours each day (BMJ, Feb 2007).
Which health measures improved?
- The odds of fair or poor self-rated health were half as high in insulated homes (adjusted odds ratio 0.50) (BMJ, Feb 2007).
- Reported wheezing in the past three months had an odds ratio of 0.57 (BMJ, Feb 2007).
- Adults taking a day off work had an odds ratio of 0.62 (BMJ, Feb 2007).
- Visits to general practitioners had an odds ratio of 0.73 (BMJ, Feb 2007).
- Respiratory hospital admissions fell too (odds ratio 0.53), but the result was not statistically significant (P=0.16) (BMJ, Feb 2007).
How strong is the wider evidence?
- A Cochrane review of housing improvements found 39 studies with usable data (Cochrane Library, Feb 2013).
- Only five of the quantitative studies were randomised controlled trials (Cochrane Library, Feb 2013).
- Fourteen quantitative studies, or 42.4% of them, were rated poor quality and left out of the synthesis (Cochrane Library, Feb 2013).
Methodology and Sources
We chose each statistic from the body that produced it: government agencies, national laboratories, regulators, the EU, peer-reviewed journals and market research firms that did their own counting. We did not use roundups or republished figures. Each link points to the source document, and we read the figure on that page or in that file before we used it. Percentages for poorly insulated homes are calculated by us from the counts in the EIA tables, and adequacy ratings are what households told the survey, not a measured R-value. National lab figures are modeled estimates of a typical stock. Market sizes come from commercial research firms and differ between them, so each is shown under its own name. Where a source page shows no date, such as ENERGY STAR methodology and the NAIMA FAQ, we used the month we read it, and the DOE and ORNL fact sheet is dated from its file creation. We update the page monthly.
This page is an informational overview. It is not engineering advice, and codes, incentives and prices differ by place.
Related reading: HVAC energy consumption statistics, home energy efficiency statistics and mold statistics.
Glossary
- ACH50: air changes per hour at 50 pascals, a blower door test result for air leakage
- CI: continuous insulation, a layer that runs unbroken across the framing
- DESNZ: UK Department for Energy Security and Net Zero
- ECO: Energy Company Obligation, a UK scheme run through energy suppliers
- EIA: US Energy Information Administration
- EPS: expanded polystyrene
- GBIS: Great British Insulation Scheme
- IECC: International Energy Conservation Code
- MHCLG: UK Ministry of Housing, Communities and Local Government
- NAIMA: North American Insulation Manufacturers Association
- ORNL: Oak Ridge National Laboratory
- PNNL: Pacific Northwest National Laboratory
- R-value: a measure of resistance to heat flow, where a higher number insulates better
- RECS: Residential Energy Consumption Survey
- TWh: terawatt-hour
Sources
- BLS, Aug 2026
- BMJ, Feb 2007
- Cochrane Library, Feb 2013
- DESNZ, Jun 2026
- DESNZ, Jun 2026
- DOE, Oct 2024
- DOE, Oct 2025
- DOE and ORNL, Feb 2008
- DOE Energy Saver, Aug 2021
- EIA, Mar 2026
- EIA, Mar 2026
- EIA, Mar 2026
- EIA, Mar 2026
- EIA, Mar 2026
- ENERGY STAR, Oct 2026
- ENERGY STAR, Oct 2026
- English Housing Survey, Jan 2026
- English Housing Survey, May 2026
- EPA, Apr 2026
- European Commission, Sep 2026
- Grand View Research, Jun 2026
- Grand View Research, Jun 2026
- IRS, Apr 2026
- Mordor Intelligence, Sep 2026
- NAIMA, Oct 2026
- National Laboratory of the Rockies, Mar 2026
- National Laboratory of the Rockies, Apr 2026
- National Laboratory of the Rockies, Sep 2026
- NBER, Jul 2015
- NREL, Dec 2017
- PNNL, Mar 2022
- PNNL, Jan 2025
- Scottish Government, Feb 2026
- USGS, Jan 2026