Home energy efficiency statistics tell two stories at once. Upgrades work, and they pay back, yet most homes still have not had them. This page gathers the numbers from the agencies, labs and regulators that collected them.
Every figure links to its primary source with a date. We follow each number back to the survey, filing, evaluation or program that produced it, and we skip roundups. Where two sources measure the same thing differently, we show each one under its own name.
The data covers insulation, windows and lighting in the US housing stock, measured savings, weatherization, federal tax credits, home energy ratings, building codes, resale value, financing, utility spending, jobs, and progress in Canada, the UK, the EU and worldwide.
Key Takeaways
- About 24.9 million US homes were poorly insulated or not insulated at all in 2020 (EIA, Mar 2023).
- 63% of US households used LED bulbs for all or most of their indoor lighting in 2024 (EIA, Sep 2026).
- Air sealing a home and adding insulation saves 15% of heating and cooling costs on average, or 11% of total energy costs (ENERGY STAR, Oct 2026).
- Weatherized single-family homes saved $283 a year on energy costs, or 12% of their bills, in the 2008 national evaluation (DOE and ORNL, Aug 2015).
- 2,338,430 tax returns claimed the Energy Efficient Home Improvement Credit for 2023, worth $2.06 billion in total (IRS, Aug 2024).
- The average HERS Index score of homes rated in 2025 was 53, which is 47% more efficient than a home built to 2006 practice (RESNET, Aug 2026).
- Model building energy codes are expected to save consumers $182.1 billion on utility bills from 2010 through 2040 (PNNL, Nov 2023).
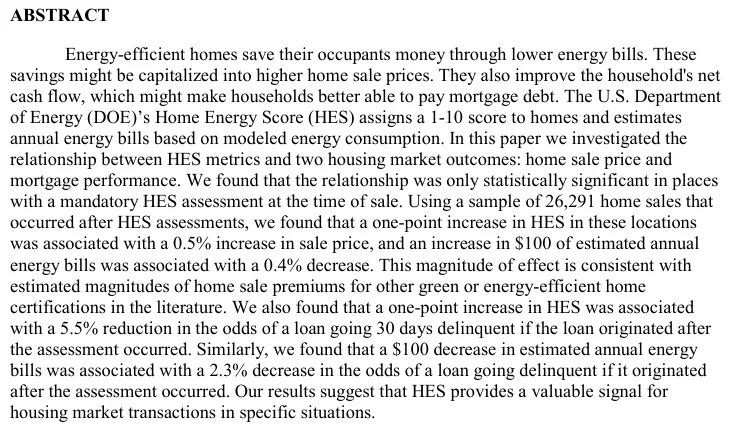
- In places that require a Home Energy Score at sale, one more score point went with a 0.5% higher sale price (Berkeley Lab, Aug 2022).
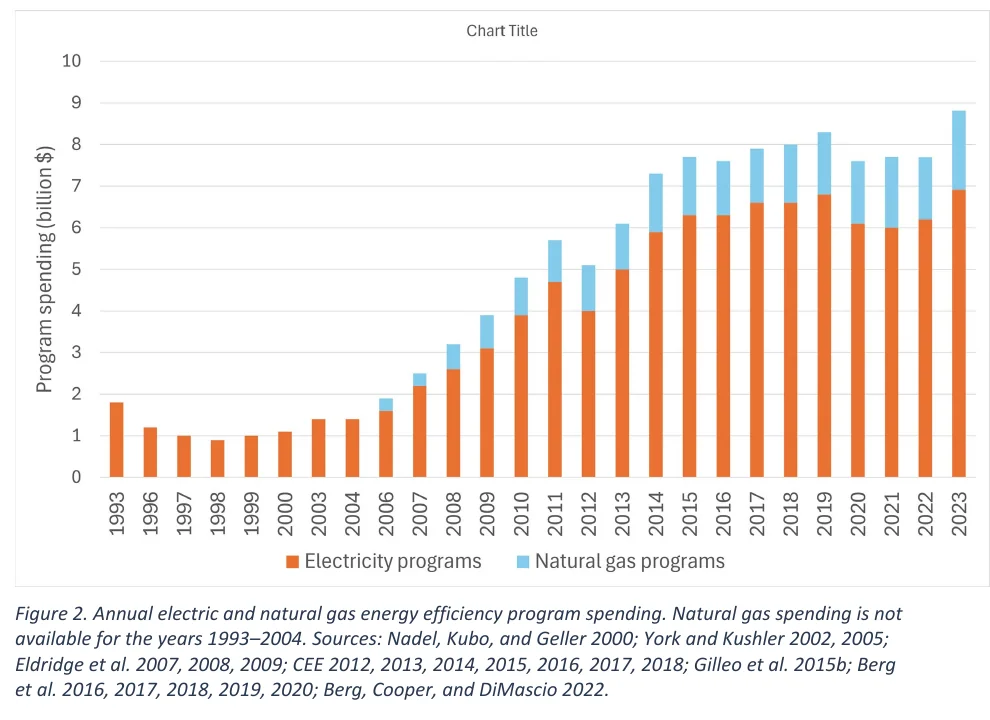
- US utilities spent roughly $8.8 billion on efficiency programs in 2023 (ACEEE, Mar 2025).
- The US energy efficiency sector employed 2.4 million workers in 2025 (DOE USEER, Sep 2026).
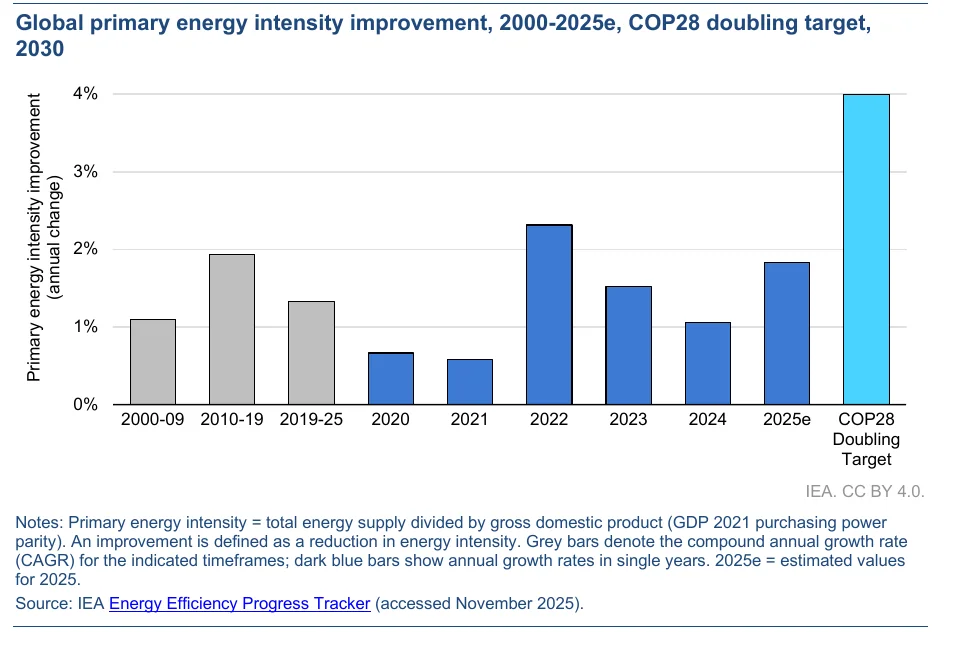
- Global energy efficiency progress is set to reach 1.8% in 2025, up from about 1% in 2024 (IEA, Nov 2025).
- 75% of buildings in the EU have poor energy performance (European Commission, Oct 2026).
- Over 165,000 Canadian households had received a Greener Homes Grant by January 2024, and each is set to save $386 a year on average (Natural Resources Canada, Feb 2024).
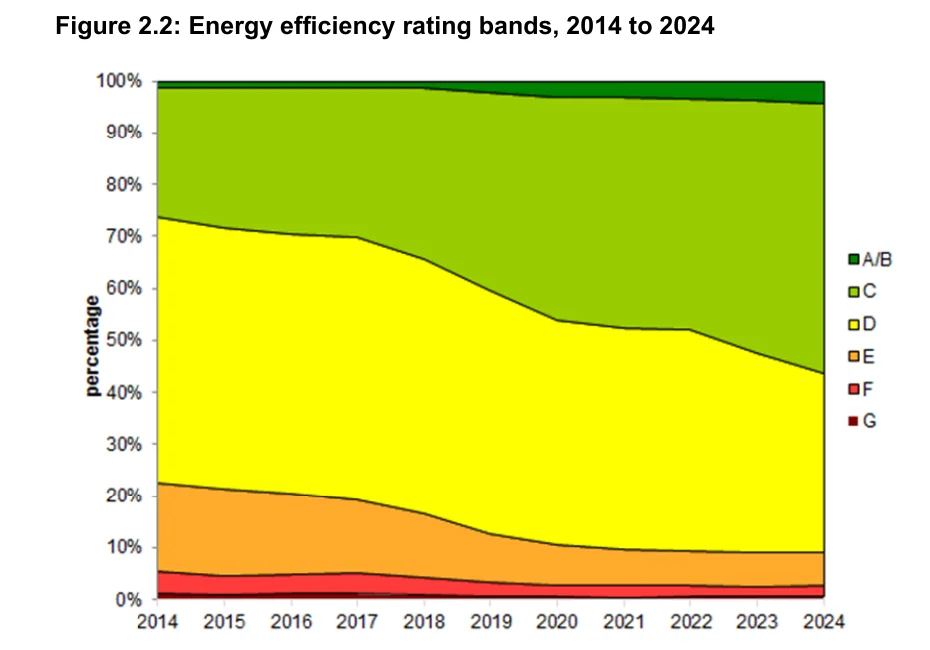
- The share of English homes in the top three efficiency bands (A to C) rose from 26% in 2014 to 56% in 2024 (English Housing Survey, Jan 2026).
How Many Energy Efficient Homes Does the US Have?
Most American homes were built before modern efficiency rules, and the survey data shows it in the walls, the windows and the light bulbs. Newer homes are much better, and the gap between old and new is where the savings sit.
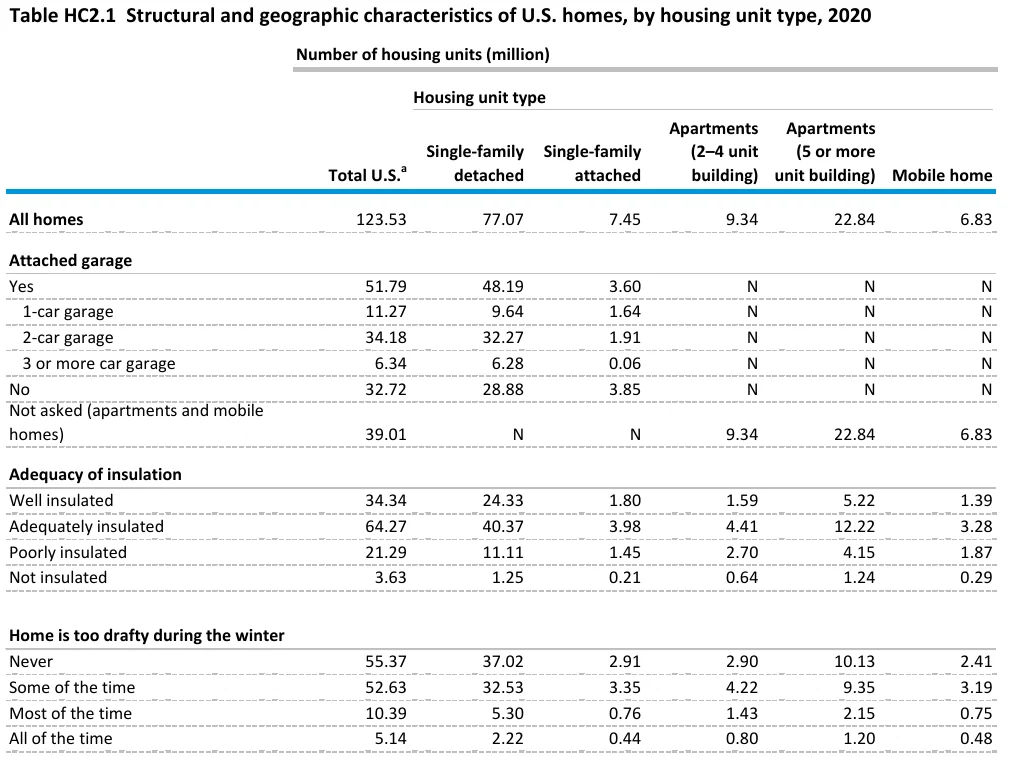
How well insulated are US homes?
- 34.34 million of 123.53 million occupied US homes were well insulated (EIA, Mar 2023).
- Another 64.27 million homes were adequately insulated, which is the largest group by far (EIA, Mar 2023).
- Of 20.26 million homes built before 1950, 7.19 million were poorly insulated or not insulated (EIA, Mar 2023).
- Of 4.56 million homes built from 2016 to 2020, 2.80 million were well insulated, or 61% (EIA, Mar 2023).
How drafty are homes in winter, and what glass do they have?
- 68.16 million homes were too drafty in winter at least some of the time (EIA, Mar 2023).
- 5.14 million homes were drafty all of the time (EIA, Mar 2023).
- 43.51 million homes had single-pane glass in at least some windows (EIA, Mar 2023).
- 77.95 million homes had double-pane glass in at least some windows (EIA, Mar 2023).
- Only 2.07 million homes had any triple-pane glass (EIA, Mar 2023).
How fast did LED lighting spread?
- In 2020, 57.69 million homes used all or mostly LED bulbs indoors, about 47% of all homes (EIA, Mar 2023).
- In 2024, 65% of single-family homes used mostly LED bulbs, against 57% of apartments and 56% of mobile homes (EIA, Sep 2026).
- 10% of households still used mostly incandescent or halogen bulbs, and 7% used mostly CFLs (EIA, Sep 2026).
- 47% of households kept at least one indoor bulb on for eight hours or more (EIA, Sep 2026).
How Much Energy Do Efficiency Upgrades Save?
Savings depend on where you live and what you fix first. Sealing and insulating pays most in cold climates, and the best results come when the envelope and the equipment are upgraded together.
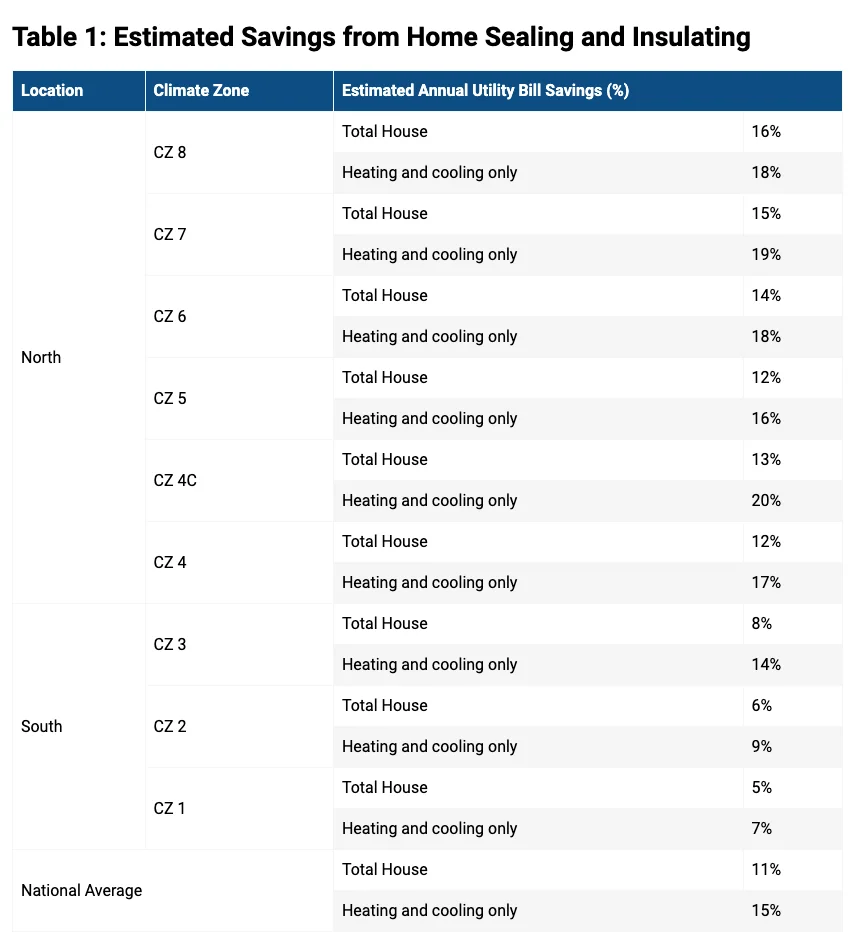
How do savings change with climate?
- In the coldest zone (zone 8), sealing and insulating cuts the total utility bill by 16% (ENERGY STAR, Oct 2026).
- In the warmest zone (zone 1), the same work cuts the total bill by 5% (ENERGY STAR, Oct 2026).
- Sealing uncontrolled air leaks alone can save 10% to 20% on heating and cooling bills (DOE Energy Saver, Aug 2022).
- Low-e storm windows can save 10% to 30% on heating and cooling, depending on the window already installed (DOE Energy Saver, Aug 2022).
- Heat gain and loss through windows account for 25% to 30% of residential heating and cooling energy use (DOE Energy Saver, Oct 2026).
What do new equipment and tighter homes save together?
- New efficient heating or cooling equipment alone can cut energy use by 20% or more (DOE Energy Saver, Aug 2022).
- Pairing new equipment with insulation, air sealing and better thermostat settings cuts heating and cooling bills by about 30% (DOE Energy Saver, Aug 2022).
- Air conditioning and space heating together make up about 32% of a typical home’s energy use (DOE Energy Saver, Aug 2022).
Sealing and insulating shrinks the heating and cooling load. A replacement system sized to the old load can end up too big for the tighter house. Checking the new load first, for example with a free BTU calculator, avoids paying for capacity the home no longer needs.
What do lighting, hot water and efficient new homes save?
- An ENERGY STAR certified LED bulb uses up to 90% less energy than an old incandescent and saves about $55 over its life (DOE Energy Saver, Aug 2022).
- An ENERGY STAR certified heat pump water heater uses 70% less electricity than a standard electric model (DOE Energy Saver, Aug 2022).
- Insulating a warm hot water tank saves 7% to 16% of water heating costs each year (DOE Energy Saver, Aug 2022).
- Water heating makes up about 20% of the average home’s energy use (DOE Energy Saver, Oct 2026).
- ENERGY STAR certified homes are at least 10% more efficient than homes built to code, and 20% better on average (DOE Energy Saver, Aug 2022).
- DOE Zero Energy Ready Homes are 40% to 50% more energy efficient than a typical new home (DOE Energy Saver, Aug 2022).
How much could the whole housing stock save?
- Cost-effective upgrades could save 245 terawatt-hours of electricity a year, or 22% of the electricity used by single-family detached homes in 2012 (NREL, Dec 2017).
- Upgrades that pay back within five years would still deliver 142 terawatt-hours a year (NREL, Dec 2017).
- Most states could cut single-family electricity use by 15% to 30% cost-effectively (NREL, Dec 2017).
What Does the Weatherization Assistance Program Deliver?
Weatherization is the largest government effort to retrofit homes, and it is also the best measured. The program was evaluated on tens of thousands of homes and thousands of utility bills, so its results are the most solid savings data in this field.
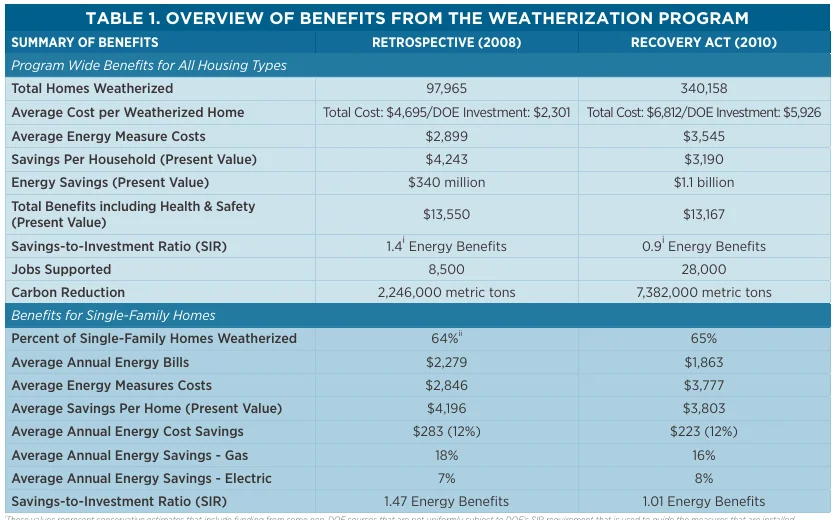
How big is the program?
- The program has helped more than 7.2 million families since 1976 (DOE WAP, Oct 2026).
- DOE funds serve roughly 32,000 homes every year (DOE WAP, Oct 2026).
- The fiscal year 2026 appropriation was $328 million, plus $30 million for the Weatherization Readiness Fund (DOE WAP, Jul 2026).
- Total program allocation for the year was $369 million (DOE WAP, Jul 2026).
What did the 2008 evaluation find?
- 97,965 homes were weatherized in program year 2008 (DOE and ORNL, Aug 2015).
- The average cost per weatherized home was $4,695 (DOE and ORNL, Aug 2015).
- Gas savings averaged 18% and electric savings averaged 7% in single-family homes (DOE and ORNL, Aug 2015).
- Energy savings alone returned $1.40 for every dollar spent (DOE and ORNL, Aug 2015).
- Counting health and safety benefits, the return was $4.10 per dollar (DOE and ORNL, Aug 2015).
- The program supported 8,500 jobs and delivered a carbon reduction of 2,246,000 metric tons (DOE and ORNL, Aug 2015).
- The study drew on 30,000 dwelling units and 8,000 utility bill histories (DOE and ORNL, Aug 2015).
What changed in the Recovery Act year?
- 340,158 homes were weatherized in program year 2010 (DOE and ORNL, Aug 2015).
- The average cost per home rose to $6,812 (DOE and ORNL, Aug 2015).
- The average spending limit per home rose from $2,500 to $6,500 (DOE and ORNL, Aug 2015).
- Eligible households grew from 35 million to 38.6 million (DOE and ORNL, Aug 2015).
- Single-family homes saved $223 a year, again 12% of their bills (DOE and ORNL, Aug 2015).
- Present-value energy savings reached $1.1 billion and the program supported 28,000 jobs (DOE and ORNL, Aug 2015).
How Many Households Claim Federal Energy Tax Credits?
Federal credits reached millions of households in a single tax year, but the claims skew toward middle and higher incomes and toward a few regions. The credit covered installs through 2025, and the 2023 return data is the most complete public count.
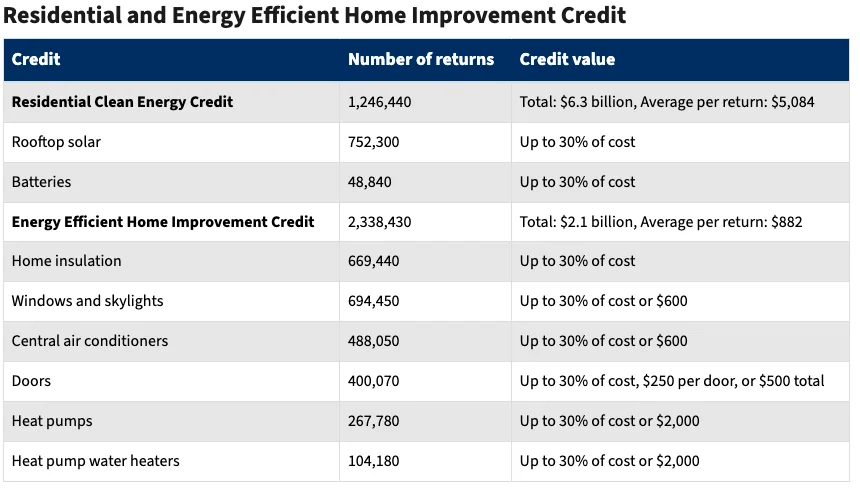
Which upgrades did people claim?
- 3,421,880 returns claimed a clean energy credit, a home improvement credit, or both, out of 137,934,330 returns (IRS, Aug 2024).
- 1,246,440 returns claimed the separate Residential Clean Energy Credit, worth $6.3 billion in total (IRS, Aug 2024).
- 694,450 returns claimed exterior windows and skylights (IRS, Aug 2024).
- 488,050 returns claimed central air conditioners (IRS, Aug 2024).
- 400,070 returns claimed the most expensive exterior door (IRS, Aug 2024).
- 283,390 returns claimed gas, propane or oil furnaces and boilers (IRS, Aug 2024).
- 267,780 returns claimed heat pumps, with an average claimed cost of $11,213 (IRS, Aug 2024).
- 104,180 returns claimed heat pump water heaters (IRS, Aug 2024).
- 93,330 returns claimed panel and circuit upgrades (IRS, Aug 2024).
- Only 36,820 returns claimed a home energy audit (IRS, Aug 2024).
Households that claimed credits for central air conditioners and heat pumps made a sizing choice, and a bad one costs comfort and money for years. A heat pump sizing calculator gives a first load estimate before the quote comes in.
Who claimed the credit, and where?
- Returns with $100,000 to $200,000 of adjusted gross income made 885,000 of the home improvement claims, or 37.8% (IRS, Aug 2024).
- Returns under $25,000 of adjusted gross income made just 40,430 of those claims, or 1.7% (IRS, Aug 2024).
- Maine had the highest claim rate for the home improvement credit at 3.0% of returns (IRS, Aug 2024).
- Hawaii had the lowest claim rate at 0.5% of returns (IRS, Aug 2024).
- The average home improvement credit was $882 per return (IRS, Aug 2024).
What were the rules, and when did they end?
- The credit equalled 30% of qualified costs (IRS, Apr 2026).
- The yearly cap was $1,200 for most improvements and $2,000 for heat pumps, water heaters and biomass stoves (IRS, Apr 2026).
- There was no lifetime dollar limit (IRS, Apr 2026).
- Property had to be placed in service before December 31, 2025 (IRS, Apr 2026).
- The 2025 budget law moved the phaseout of several residential credits forward, which likely reduced participation in rebate programs (DOE USEER, Sep 2026).
What Do Home Energy Ratings and Building Codes Show?
A rating turns efficiency into a number a buyer can compare, and a code sets the floor for every new home. Both are moving the market, slowly in some states and fast in others.
How many homes get a HERS rating?
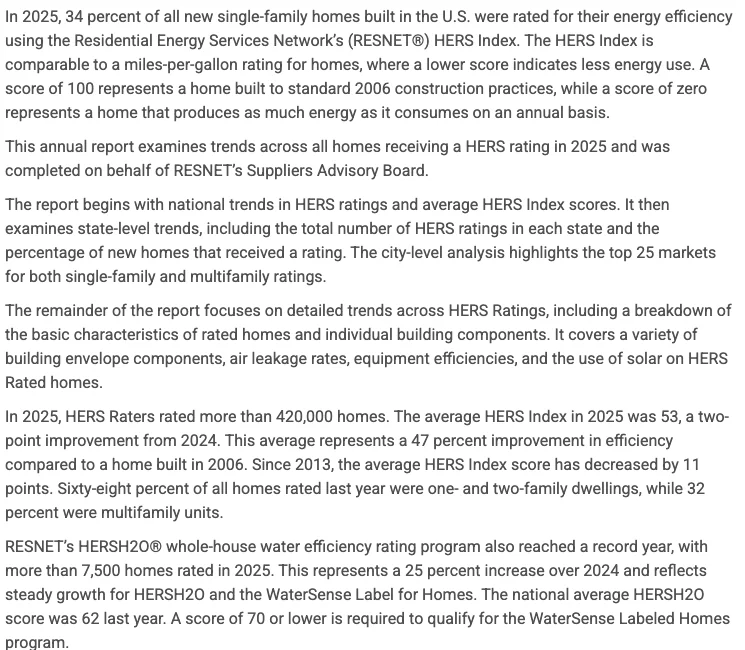
- HERS Raters rated more than 420,000 homes in 2025 (RESNET, Aug 2026).
- 34% of all new single-family homes built in 2025 were rated (RESNET, Aug 2026).
- The 2025 average score was two points better than in 2024 (RESNET, Aug 2026).
- The average score has fallen 11 points since 2013 (RESNET, Aug 2026).
- 68% of rated homes were one- and two-family dwellings, and 32% were multifamily units (RESNET, Aug 2026).
- A score of 100 equals a home built to standard 2006 practice, and a score of zero means the home produces as much energy as it uses (RESNET, Aug 2026).
- More than 7,500 homes received the HERSH2O water rating, up 25% on 2024 (RESNET, Aug 2026).
What do building energy codes save?
- Residential energy codes are expected to save consumers $103.9 billion from 2010 through 2040 (PNNL, Nov 2023).
- Residential code savings in 2030 alone are estimated at $4.82 billion (PNNL, Nov 2023).
- Residential and commercial codes together save 17.00 quads of full-fuel-cycle energy over the same period (PNNL, Nov 2023).
- Those combined savings avoid 840 million metric tons of carbon dioxide (PNNL, Nov 2023).
- PNNL assumes new residential codes deliver 80% of potential savings in the first year, rising to 100% after 10 years (PNNL, Nov 2023).
How strong are state residential codes?
- Only seven states reached an adjusted residential energy use index under 0.7, while 30 states did so for commercial buildings (ACEEE, Mar 2025).
- California, Massachusetts and New York ranked first, second and third in the 2025 state scorecard (ACEEE, Mar 2025).
- Nearly 60% of new buildings worldwide are covered by building energy codes (IEA, Nov 2025).
Do Efficient Homes Sell for More and Carry Less Risk?
Lower bills should show up in prices and in loan payments, but the evidence says only when buyers can see the number. Where a rating is shown at sale, the effects are small and consistent. Where it is not, they vanish.
Does an energy rating change the sale price?
- The study covered 26,291 home sales made after a Home Energy Score assessment (Berkeley Lab, Aug 2022).
- A $100 rise in estimated annual energy bills went with a 0.4% lower sale price (Berkeley Lab, Aug 2022).
Do efficient homes default less often?
- One more score point went with a 5.5% drop in the odds of a loan going 30 days delinquent (Berkeley Lab, Aug 2022).
- A $100 drop in estimated annual energy bills went with a 2.3% drop in those odds (Berkeley Lab, Aug 2022).
How do efficiency loans perform?
- Four large state and utility programs issued 52,511 efficiency-only loans in the study (Berkeley Lab and SEE Action, Mar 2022).
- The average loan was $9,137 over 121 months at a 5.0% rate (Berkeley Lab and SEE Action, Mar 2022).
- The average monthly payment was $93 (Berkeley Lab and SEE Action, Mar 2022).
- The average borrower credit score was 740 (Berkeley Lab and SEE Action, Mar 2022).
- 1.57% of outstanding loan dollars were 30 days delinquent (Berkeley Lab and SEE Action, Mar 2022).
- 0.21% of outstanding loan dollars were 90 days delinquent (Berkeley Lab and SEE Action, Mar 2022).
- Pooled losses were 2.1% of principal by year 2 and 5.1% by year 8 (Berkeley Lab and SEE Action, Mar 2022).
How Much Do Utilities Spend on Efficiency, and How Many Jobs Follow?
Efficiency is a large business. Utilities fund much of the work, contractors do it, and the job count shows how fast policy changes can move the market.
How much do US utilities spend?
- Electric efficiency program spending reached a record $6.9 billion in 2023 (ACEEE, Mar 2025).
- Natural gas efficiency programs added $1.9 billion (ACEEE, Mar 2025).
- Total spending was about 16% above the 2020 low (ACEEE, Mar 2025).
- It was also 6% above the previous high set in 2019 (ACEEE, Mar 2025).
- Electricity efficiency spending grew more than sevenfold from about $900 million in 1998 to $6.6 billion in 2018 (ACEEE, Mar 2025).
What do the programs save?
- Net savings from utility and public benefits electricity programs in 2023 were 0.60% of sales (ACEEE, Mar 2025).
- That equals 23.2 million megawatt-hours (ACEEE, Mar 2025).
How many people work in energy efficiency?
- Efficiency employment fell by about 1%, or 21,400 workers, in 2025 (DOE USEER, Sep 2026).
- It is still up 7%, or 145,000 workers, since 2022 (DOE USEER, Sep 2026).
- Wages in the sector run 18% to 23% above the US average (DOE USEER, Sep 2026).
- USEER notes that ENERGY STAR certified equipment typically saves 10% to 30% more energy than standard models (DOE USEER, Sep 2026).
How Fast Is the World Improving Energy Efficiency?
The world is improving, but not fast enough for its own targets. Governments are writing more policies each year, and money is flowing, yet progress per year is still below the pace set for 2030.
How does the pace compare with the goal?
- Progress has averaged 1.3% a year since 2019, against about 2% a year from 2010 to 2019 (IEA, Nov 2025).
- Governments set a goal of 4% a year by 2030 at COP28 (IEA, Nov 2025).
- Progress in the US and EU is set to fall below 1% in 2025, while China is over 3% and India over 4% (IEA, Nov 2025).
- Governments adopted over 250 new or updated efficiency policies in 2025 (IEA, Nov 2025).
- Around half of countries still have no efficiency standards for new buildings (IEA, Nov 2025).
What do the gains mean in money, jobs and emissions?
- Global efficiency investment is set to reach almost $800 billion in 2025, up 6% on 2024 (IEA, Nov 2025).
- That is more than 70% above 2015 (IEA, Nov 2025).
- Nearly 18 million people worked in energy efficiency worldwide in 2024 (IEA, Nov 2025).
- Without efficiency gains since 2010, greenhouse gas emissions would be 20% higher (IEA, Nov 2025).
- Efficiency actions since 2000 cut household energy bills in advanced economies by up to 20% (IEA, Nov 2025).
- Efficiency accounted for two-thirds of the gas demand savings in European households during the energy crisis (IEA, Nov 2025).
- The efficiency of best-in-class light bulbs doubled in 15 years, while minimum standards rose by only 30% (IEA, Nov 2025).
What is the EU requiring of its homes?
- 85% of EU buildings were built before 2000 (European Commission, Oct 2026).
- The Renovation Wave aims to renovate 35 million buildings by 2030 (European Commission, Oct 2026).
- Each country must cut average residential primary energy use by 16% by 2030 and by 20% to 22% by 2035 (European Commission, Oct 2026).
- At least 55% of that cut must come from renovating the worst-performing buildings (European Commission, Oct 2026).
How Are Canada and the UK Doing on Home Efficiency?
Two countries with cold winters and older homes show what grants and ratings do over time. Canada paid households to upgrade and tracked the result, and England measured its whole housing stock against a single rating scale.
What has the Canada Greener Homes Grant achieved?
- Canada has invested over $15 billion in programs to help people upgrade their homes (Natural Resources Canada, Feb 2024).
- Over half a million households applied for a grant in the first three years (Natural Resources Canada, Feb 2024).
- Ontario had about 227,500 applicants, the most of any province (Natural Resources Canada, Feb 2024).
- Half of the funded households, over 82,000, installed a heat pump (Natural Resources Canada, Feb 2024).
- The average grant payment was over $4,200 (Natural Resources Canada, Feb 2024).
- The program supported over 75,000 jobs (Natural Resources Canada, Feb 2024).
- Each funded home cuts about 1.2 tonnes of pollution a year (Natural Resources Canada, Feb 2024).
How efficient are English and Welsh homes?
- The median EPC score of homes in England was 69, which is band C (ONS, Oct 2025).
- Homes in Wales had a median score of 68, which is band D (ONS, Oct 2025).
- New dwellings in England reached a median score of 84, up from 82 in the five years to March 2013 (ONS, Oct 2025).
- Mid-Suffolk had the highest share of properties listing a heat pump on their EPC at 10.6% (ONS, Oct 2025).
- The share of English homes in the lowest bands (E to G) fell from 23% in 2014 to 9% in 2024 (English Housing Survey, Jan 2026).
- The average SAP rating of English homes was 68 in 2024, up from 45 in 1996 (English Housing Survey, Jan 2026).
What does the English housing stock still lack?
- The average cost to bring a home up to at least band C was £7,480 (English Housing Survey, Jan 2026).
- 54% of homes had cavity or solid wall insulation, up from 48% in 2014 (English Housing Survey, Jan 2026).
- 89% of homes had full double glazing, up from 81% (English Housing Survey, Jan 2026).
- 42% of homes had 200 mm or more of loft insulation, up from 39% in 2022 (English Housing Survey, Jan 2026).
- Private rented homes had the lowest share of cavity wall insulation at 60%, against 73% of owner-occupied homes (English Housing Survey, Jan 2026).
Methodology and Sources
We chose each statistic from the body that produced it: government agencies, national laboratories, regulators, standards bodies and original research groups. We did not use roundups or republished figures. Each link points to the source document or data page, and we confirmed the figure on that page. Some percentages, such as the share of homes poorly insulated or the claim rate by state, are calculated from the counts in the source table and are labelled by the source name. Pages that show no publication date, such as live agency pages, carry the month we checked them. Where sources measure different things, they sit under their own names and are not blended. We refresh the page every month.
This page is an informational overview. It is not engineering advice, and building codes and tax rules differ by place.
Related reading: HVAC energy consumption statistics and building electrification retrofit statistics.
Glossary
- ACEEE: American Council for an Energy-Efficient Economy
- AGI: adjusted gross income
- CFL: compact fluorescent lamp
- COP28: the 2023 UN climate conference
- EIA: US Energy Information Administration
- EPC: Energy Performance Certificate, the UK efficiency rating
- HERS: Home Energy Rating System, a score where 100 is a 2006 standard home
- IEA: International Energy Agency
- LED: light-emitting diode
- ORNL: Oak Ridge National Laboratory
- PNNL: Pacific Northwest National Laboratory
- RECS: Residential Energy Consumption Survey
- SAP: Standard Assessment Procedure, the UK home energy model
- USEER: US Energy and Employment Report
- WAP: Weatherization Assistance Program
Sources
- ACEEE, Mar 2025
- ACEEE, Mar 2025
- Berkeley Lab, Aug 2022
- Berkeley Lab and SEE Action, Mar 2022
- DOE and ORNL, Aug 2015
- DOE Energy Saver, Aug 2022
- DOE Energy Saver, Oct 2026
- DOE USEER, Sep 2026
- DOE WAP, Oct 2026
- DOE WAP, Jul 2026
- EIA, Mar 2023
- EIA, Sep 2026
- EIA, Mar 2023
- EIA, Mar 2023
- ENERGY STAR, Oct 2026
- English Housing Survey, Jan 2026
- European Commission, Oct 2026
- European Commission, Oct 2026
- IEA, Nov 2025
- IEA, Nov 2025
- IEA, Nov 2025
- IRS, Aug 2024
- IRS, Apr 2026
- IRS and Treasury, Inflation Reduction Act clean energy statistics (IR-2024-202), Aug 2024
- Natural Resources Canada, Feb 2024
- NREL, Dec 2017
- ONS, Oct 2025
- PNNL, Nov 2023
- RESNET, Aug 2026