Air conditioning statistics tell two stories at once. In the US almost every home can cool itself, and the questions are about equipment, cost and comfort. In Europe, India and most of the world, ownership is still low and rising fast, and the questions are about power grids and refrigerants.
This page collects dated figures from statistics offices, energy agencies, industry associations and peer-reviewed journals. Every number links to the document that produced it. The data covers ownership by country, units sold, cooling energy, efficiency, refrigerant rules and the people who still have no cooling.
Use it to check a claim before you repeat it, to see how your market compares with others, or to explain a cooling bill to a customer. Each stat appears once, so scan the headings for the question you need. The figures are refreshed every month.
Key Takeaways
- Global electricity demand for space cooling has grown 50% since 2015, to around 2,900 TWh, more than the total electricity demand of the European Union (IEA, Jul 2026).
- Cooling accounts for about 30% of peak electricity demand (IEA, Jul 2026).
- World demand for air conditioners reached 139.8 million units in 2025, up 6% on 2024 (JRAIA, Aug 2026).
- China bought 57.1 million units in 2025, 41% of world demand (JRAIA, Aug 2026).
- More than nine out of ten US households have air conditioning (U.S. Census Bureau, Jun 2026).
- 56.0% of Italian households had a space cooling system in 2024, up from 29.4% in 2013 (ISTAT, Feb 2026).
- 24% of French households had air conditioning in 2025, up from 18% in 2023 (ADEME BatiZoom, Nov 2025).
- Only 4.3% of English homes use air conditioning, about 1.06 million homes (EDRC, Jun 2026).
- 13.3% of Indian households owned an air conditioner in a 2024 survey (CLASP, May 2026).
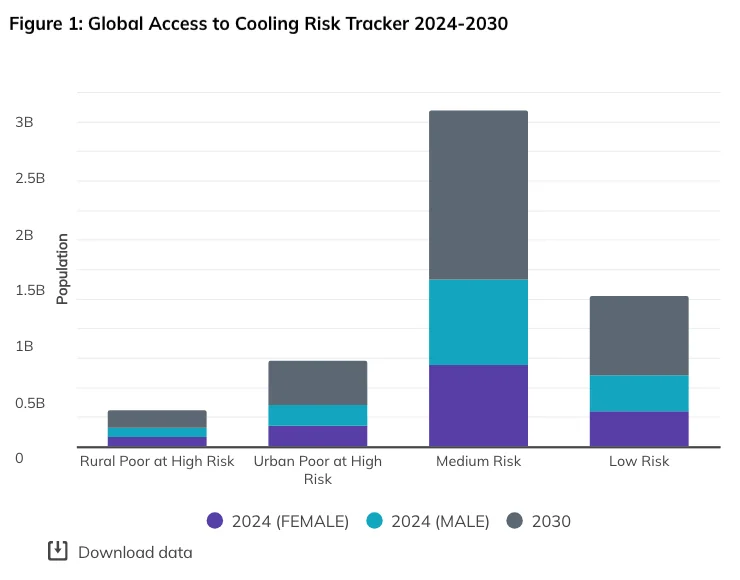
- Just over 1 billion people in 77 countries are at high risk of lacking access to crucial cooling (SEforALL, Jul 2025).
- The average air conditioner sold worldwide in 2024 was around 20% more efficient than the average sold a decade earlier (IEA, Jul 2026).
- 174 of 198 parties to the Montreal Protocol have ratified the Kigali Amendment on refrigerants (Ozone Secretariat, Aug 2026).
- Air conditioning and refrigeration equipment emitted an estimated 4.1 billion tons of CO2e in 2022, about one-third from refrigerant leakage (UNEP, Nov 2025).
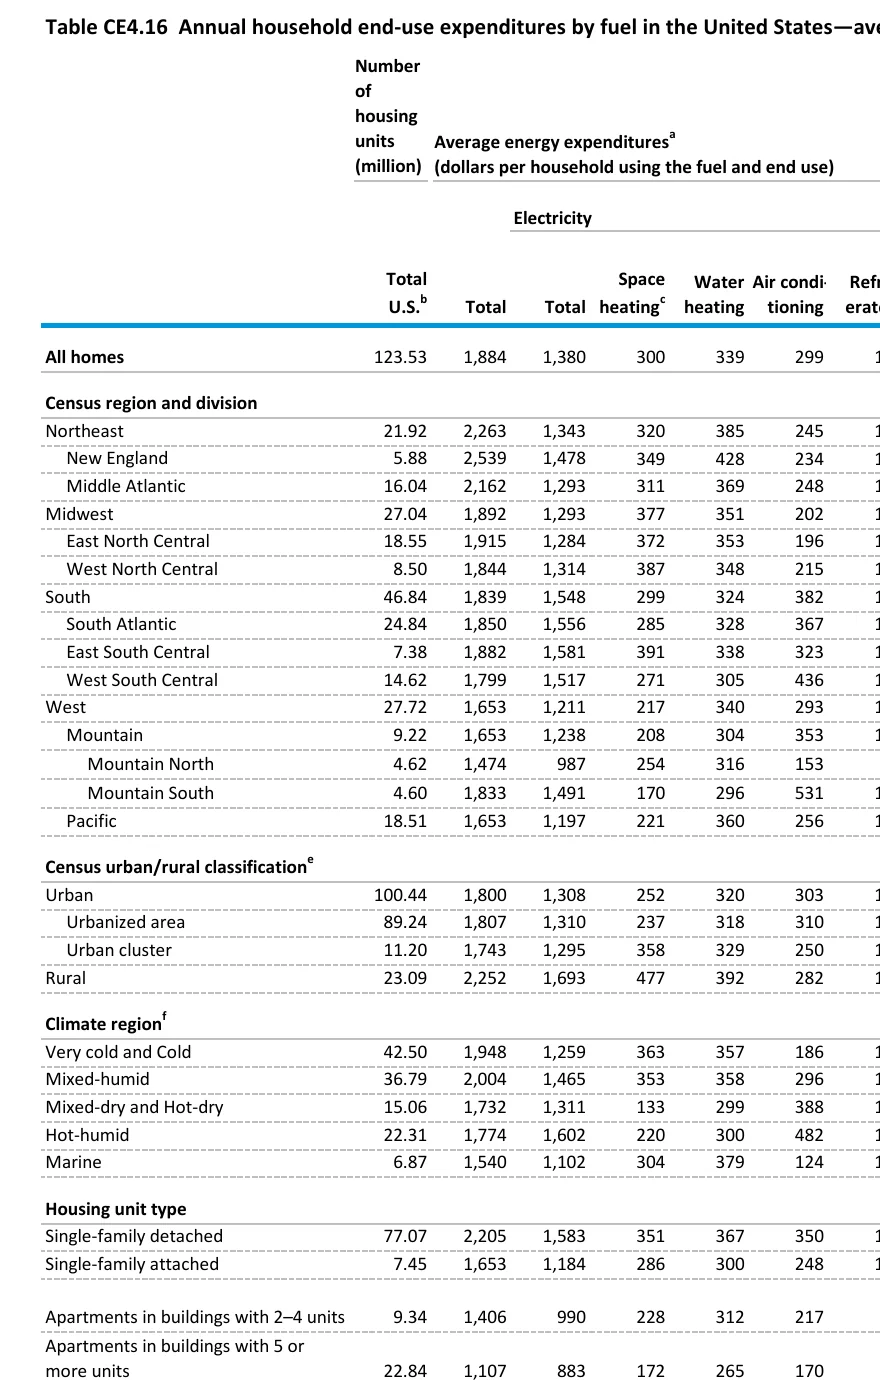
- US households in the West South Central division that use air conditioning spent an average of $436 a year on it in 2020 (EIA, Mar 2024).
How many US homes have air conditioning?
Cooling is close to universal in the US, and the gaps are easy to name. They sit in the cooler states, in apartments and rented homes, and among households with the lowest incomes.
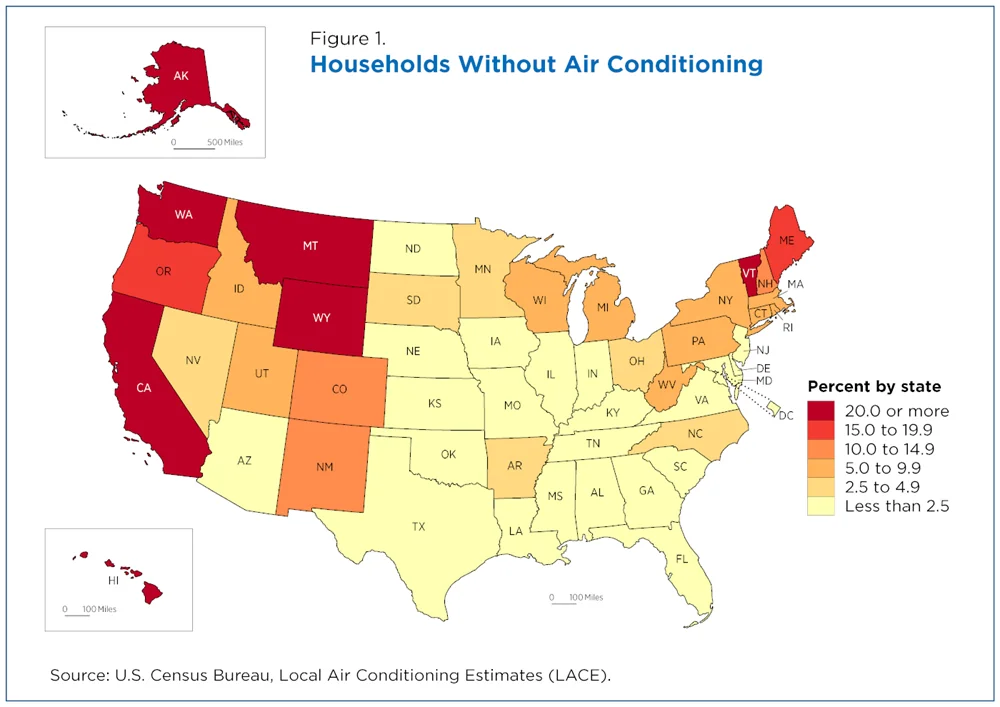
Which states have the fewest air-conditioned homes?
The cool, coastal and island states trail the national picture by a wide margin.
- Alaska had 0.02 million air-conditioned homes out of 0.26 million, 7% of the total (EIA, Mar 2023).
- Hawaii had 0.27 million air-conditioned homes out of 0.47 million, 57%, and only 12% had central air (EIA, Mar 2023).
- California had 9.54 million air-conditioned homes out of 13.18 million, 72% (EIA, Mar 2023).
- In Florida 96% of homes had air conditioning and 90% had central air (EIA, Mar 2023).
- Salt Lake County, Utah, has 6.6% of households without air conditioning, but estimates range from 0.0% to 23.2% between neighborhoods (U.S. Census Bureau, Jun 2026).
- The Census estimates combine the American Housing Survey with the American Community Survey to reach down to the tract level (U.S. Census Bureau, Jun 2026).
What kinds of cooling equipment do homes use?
Central systems lead, but millions of homes cool one room at a time.
- 32.42 million homes used individual air-conditioning units, 26% of all homes (EIA, Mar 2023).
- In Connecticut 60% of homes used individual units and in Massachusetts 58% (EIA, Mar 2023).
- 2.68 million homes used a portable air conditioner as their main type (EIA, Mar 2023).
- 0.95 million homes used an evaporative or swamp cooler as their main type, and 0.50 million of them were in the mixed-dry and hot-dry climate region (EIA, Mar 2023).
- 11.90 million homes ran one window or wall unit, 8.24 million ran two, 3.72 million ran three and 2.18 million ran four or more (EIA, Mar 2023).
- Among homes with a ductless heat pump, 1.21 million had one indoor unit, 0.64 million had two and 0.41 million had four or more (EIA, Mar 2023).
Who is least likely to have central air?
Apartments, rented homes and low-income homes lean on window units.
- Of 22.84 million apartments in buildings with five or more units, 19.56 million used air conditioning, 12.11 million had central air and 6.18 million used window or wall units (EIA, Mar 2023).
- Of 77.07 million detached single-family homes, 57.73 million had central air (EIA, Mar 2023).
- Renters used air conditioning in 33.91 million of 40.61 million homes, with central air in 21.05 million and window or wall units in 10.96 million (EIA, Mar 2023).
- In homes earning under $5,000, 3.45 million of 4.48 million used air conditioning and 1.98 million had central air (EIA, Mar 2023).
- In homes earning $150,000 or more, 15.67 million of 16.86 million used air conditioning and 13.28 million had central air (EIA, Mar 2023).
- In the marine climate region only 3.51 million of 6.87 million homes used air conditioning (EIA, Mar 2023).
- The very cold and cold region had 10.37 million homes with window or wall units, against 1.91 million in the hot-humid region (EIA, Mar 2023).
What is air conditioning prevalence in Europe?
Europe is the biggest gap between how hot summers are getting and how few homes can cool. Southern Italy is close to the American picture, while the north and west are still starting out.
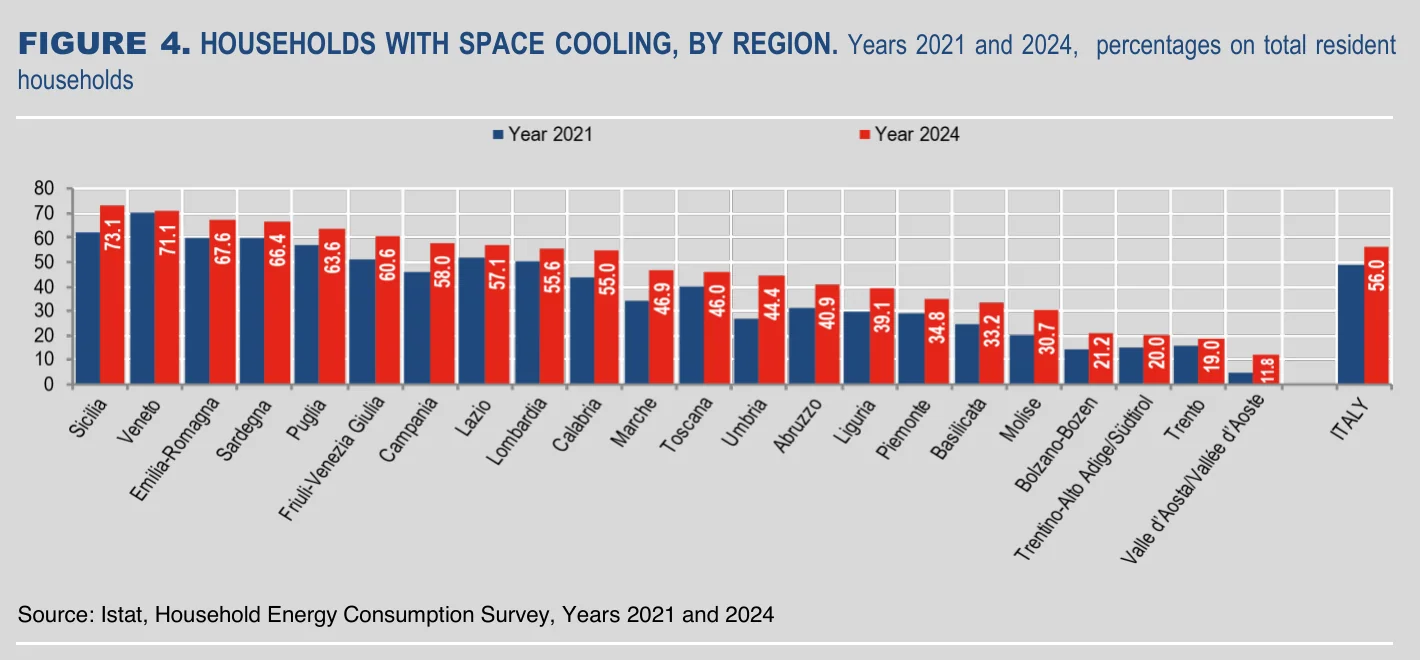
How many Italian homes have cooling?
Italy is the best-measured large market in Europe, and the survey shows a fast climb.
- 48.8% of Italian households had a space cooling system in 2021 (ISTAT, Feb 2026).
- Space cooling was in 71.2% of households on the Islands, 64.1% in the North-east and 48.0% in the North-west (ISTAT, Feb 2026).
- Sicilia had the highest share at 73.1% and Valle d’Aosta the lowest at 11.8% (ISTAT, Feb 2026).
- Capital municipalities reached 63.2%, which ISTAT links to the urban heat island effect (ISTAT, Feb 2026).
- Single air-conditioning units fell from 40.9% of households in 2021 to 35.4% in 2024 (ISTAT, Feb 2026).
- Central or individual multi-room cooling systems were in 24.4% of households, up 12.9 percentage points since 2021 (ISTAT, Feb 2026).
- Combined heating and cooling systems, which are heat pumps, were in 40.4% of households, up from 32.6% (ISTAT, Feb 2026).
How common is cooling in France and Germany?
France is catching up from a low base, and Germany barely builds cooling into new homes.
- Surveys put the share of French households with air conditioning between 18% and 26%, depending on the source (ADEME BatiZoom, Nov 2025).
- Among the equipped French homes in 2025, 13% cooled one room and 11% cooled several (ADEME BatiZoom, Nov 2025).
- Air conditioning is about 1% of final energy use in French homes, because it runs only now and then (ADEME BatiZoom, Nov 2025).
- France’s national low-carbon strategy assumes 80% of homes will have air conditioning in 2050 (ADEME BatiZoom, Nov 2025).
- Only 4.3% of the 58,885 homes finished in Germany in 2025 had a cooling system, more than double the 1.9% of 105,568 in 2015 (Destatis, Jun 2026).
- Offices run far ahead of homes: 37.8% of the 1,350 office buildings finished in Germany in 2025 had cooling (Destatis, Jun 2026).
- Cooling was built into 34.4% of new health buildings and 14.5% of new social care buildings in Germany in 2025 (Destatis, Jun 2026).
How many English homes use air conditioning?
Very few, and the gaps follow income and region.
- London and the East of England led at 6.5% of homes each, while the North East had 1.5% (EDRC, Jun 2026).
- The top fifth of earners used air conditioning in 8.2% of homes, against 2.5% for the bottom fifth (EDRC, Jun 2026).
- 21st-century homes used it in 6.6% of cases and detached homes and bungalows in 6.2% of cases (EDRC, Jun 2026).
- Lone-parent households with children had the lowest use of any household type at 2.9% (EDRC, Jun 2026).
- Homes with someone aged 75 or older used it at 3.0%, against 4.6% where nobody was that old (EDRC, Jun 2026).
How common is air conditioning in the rest of the world?
The global average hides two worlds. A few rich or hot economies are saturated, while India, Southeast Asia and Africa are only beginning.
Which countries have the most cooling?
Two economies are near saturation, and one is catching up quickly.
- Around 40% of the world’s people have access to air conditioning, while more than 80% need cooling for at least part of the year (IEA, Jul 2026).
- Nearly 90% of households in Japan and the United States have an air conditioner (IEA, Jul 2026).
- Ownership in China rose by 50% over the past decade (IEA, Jul 2026).
How many households in India and Australia have it?
India shows how low ownership can be where heat is high. Australia shows what mature ownership looks like.
- Indian ownership was 10% in 2022, and 99% of surveyed households owned a fan (CLASP, May 2026).
- 55% of the air conditioners in the surveyed Indian homes were bought in the last five years (CLASP, May 2026).
- India’s room air conditioner market registered with the Bureau of Energy Efficiency was 11.47 million units in 2023-24 (CLASP, May 2026).
- Nearly half of Australian households (49%) used reverse-cycle air conditioning as their main cooling, 13% used evaporative coolers and 10% used cooling-only systems (ABS, Mar 2014).
- 26% of Australian households used no air conditioning, from 48% in Tasmania to 4% in the Northern Territory (ABS, Mar 2014).
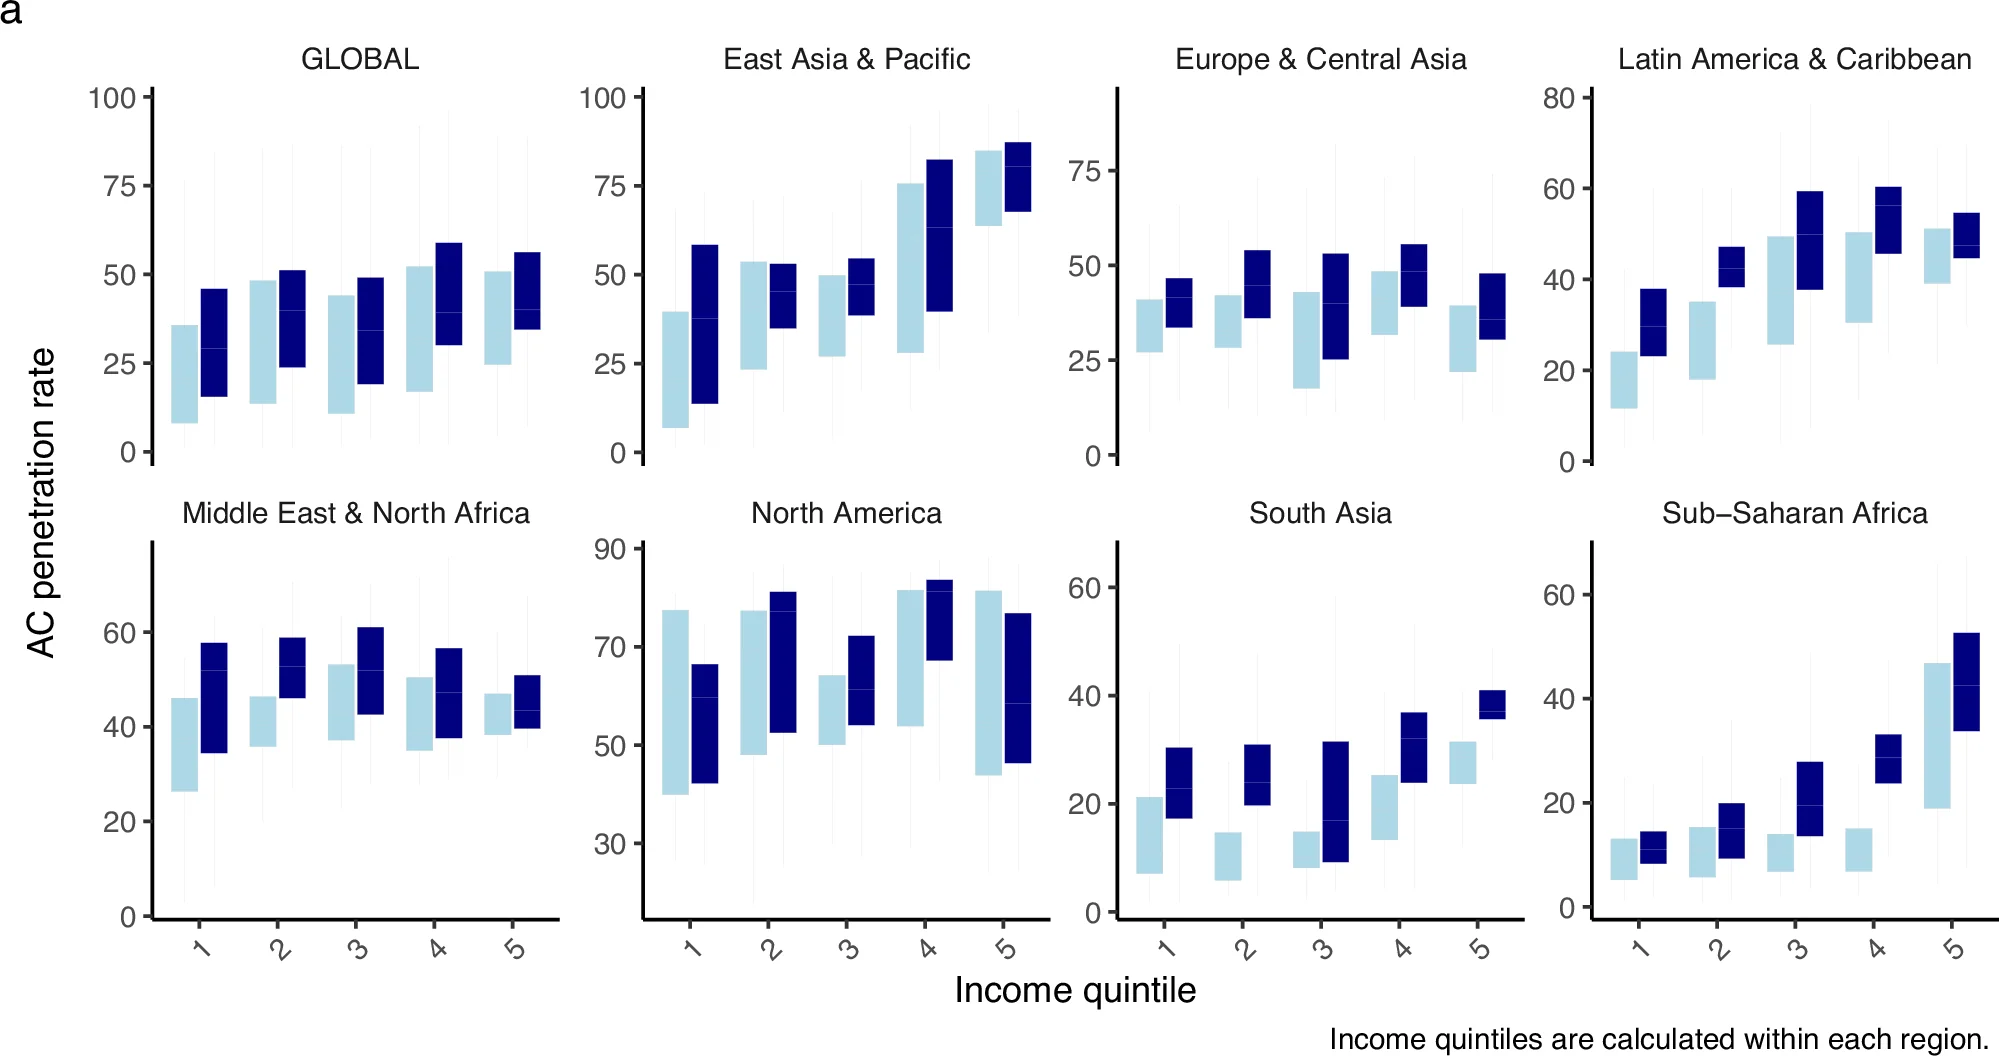
How much does income decide who owns one?
A lot, and the gap between rich and poor households is set to widen in two regions.
- Globally, ownership in the lowest income fifth is projected to grow from about 17% to between 21% and 39% by 2050 (Nature Communications, Sep 2024).
- In the highest income fifth, ownership is projected to grow from about 52% to between 56% and 60% (Nature Communications, Sep 2024).
- The gap between the top and bottom fifths is projected to widen in sub-Saharan Africa and South Asia (Nature Communications, Sep 2024).
How many air conditioners are sold each year?
Sales have grown every year since 2021, and most of the growth is in Asia. The US and Europe are a small part of the global market.
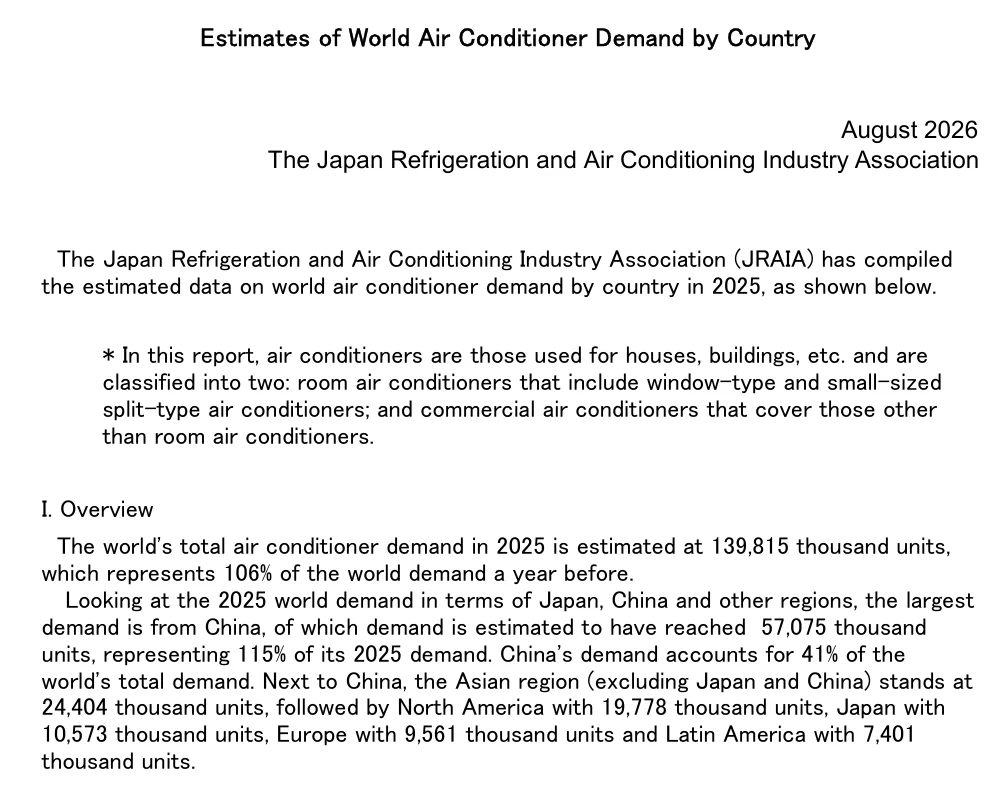
How big is world demand?
Two trackers measure it with different scopes, so they should not be added together.
- World demand was 110.0 million units in 2021 and 131.6 million in 2024 (JRAIA, Aug 2026).
- In 2025, 121.6 million of the units were residential and 18.2 million were commercial (JRAIA, Aug 2026).
- JRAIA excludes portable units and chiller-heater systems from its count (JRAIA, Aug 2026).
- The IEA counts shipments, which are units delivered by a producer, and puts 2024 global shipments at 200 million units (IEA, Jul 2026).
- Annual shipments are 25% higher than five years ago (IEA, Jul 2026).
- In 2024 shipments grew about 10% in India, the Middle East, the United States and Europe, and by 40% or more in Latin America and Africa (IEA, Jul 2026).
Which regions buy the most?
China is the market, and the rest of Asia is next.
- China’s demand grew 15% in 2025 (JRAIA, Aug 2026).
- Asia excluding Japan and China bought 24.4 million units, down from 25.2 million in 2024 (JRAIA, Aug 2026).
- North America bought 19.8 million units, Japan 10.6 million and Europe 9.6 million (JRAIA, Aug 2026).
- Latin America bought 7.4 million units, the Middle East 5.6 million, Africa 4.0 million and Oceania 1.45 million (JRAIA, Aug 2026).
- China produces around 170 million units a year, exports around 60 million and has capacity for around 300 million (IEA, Jul 2026).
Which countries lead?
A few countries dominate, and the big European markets are small.
- India bought 11.6 million units in 2025, down from 11.9 million in 2024 (JRAIA, Aug 2026).
- The United States bought 11.1 million units (JRAIA, Aug 2026).
- Indonesia bought 2.8 million units and Saudi Arabia 2.1 million (JRAIA, Aug 2026).
- Italy bought 2.0 million units and Spain 1.1 million (JRAIA, Aug 2026).
- Germany bought 0.21 million units and the United Kingdom 0.22 million (JRAIA, Aug 2026).
- Outside Japan, window-type units were 11.3 million of residential sales in 2025 (JRAIA, Aug 2026).
How much energy does cooling use?
Cooling is a small share of yearly energy and a very large share of the busiest hours. That is why grids and installers worry about it more than annual totals suggest. For home totals by end use, see the HVAC energy consumption statistics page.
How big is cooling on the world’s grids?
Large enough to shape new power capacity.
- Cooling has accounted for 14% of global electricity demand growth since 2015, and as much as 25% in the Middle East and North Africa (IEA, Jul 2026).
- In 2025 cooling contributed 1,400 gigawatts of peak demand, equal to the total installed power capacity of the United States (IEA, Jul 2026).
- Cooling degree days were 25% higher in 2024 than in 2020 in China and Europe, and almost 50% higher in Japan and Korea (IEA, Jul 2026).
- Cooling in data centers is estimated at 80 TWh for 2025 and is not counted in the building figure (IEA, Jul 2026).
What does cooling cost a US household?
The answer depends on climate and home type more than anything else. A load calculation is how a contractor turns that into equipment size, and the BTU calculator shows the idea in a few steps.
- In the Mountain South division, households using air conditioning spent $531 a year, against $153 in Mountain North (EIA, Mar 2024).
- The hot-humid region averaged $482 and the marine region $124 (EIA, Mar 2024).
- Detached homes averaged $350, and apartments in buildings of five or more units averaged $170 (EIA, Mar 2024).
- Air conditioning used 14.6 million Btu of electricity per household in Mountain South and 4.8 in Mountain North (EIA, Mar 2024).
- It used 14.2 million Btu in the hot-humid region against 3.1 in the marine region (EIA, Mar 2024).
- It used 9.5 million Btu in detached homes against 4.0 in apartments in large buildings (EIA, Mar 2024).
What do China and India show about cooling load?
Both countries show the load before the equipment catches up.
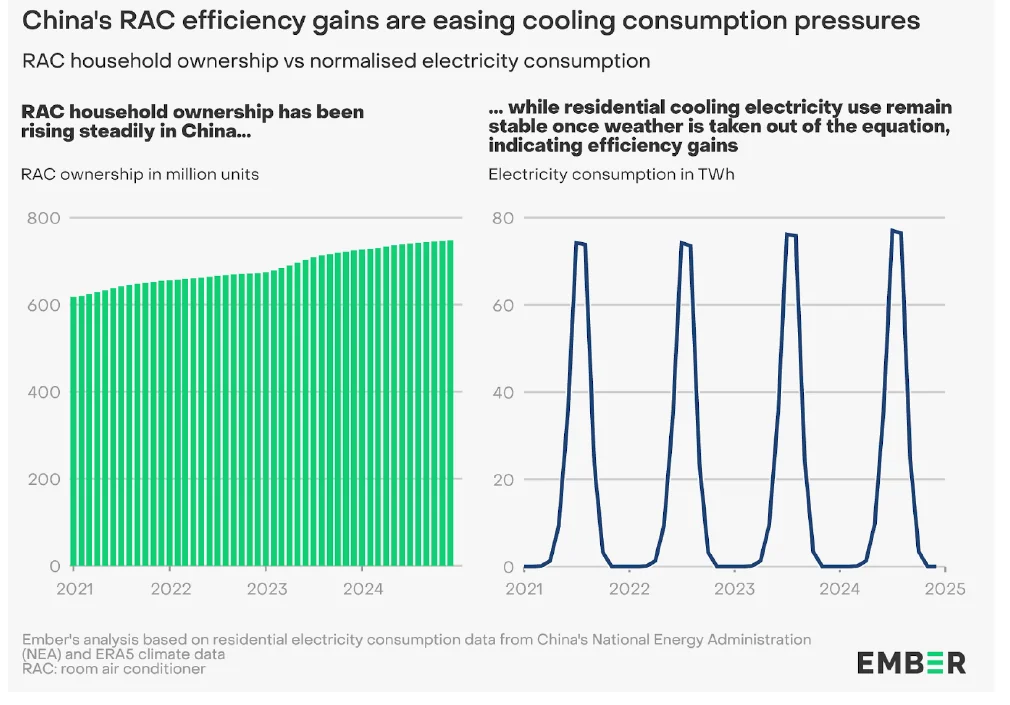
- Ember estimates space cooling accounted for 70% of the rise in Chinese residential electricity use from July to September 2024 (Ember, Jul 2025).
- In rural Indian homes thermal comfort appliances use 63% of electricity, and fans alone use 48% (CLASP, May 2026).
- In urban Indian homes fans use 16% and air conditioners 12% (CLASP, May 2026).
- India’s fans use 5.6 times as much energy as its room air conditioners (UNEP, Nov 2025).
How efficient are the air conditioners people buy?
Efficiency is where policy has worked best. The spread between the best and the worst units on sale is still wide, and rules differ from country to country.
How much better are the best units?
Much better than the average, and the average is improving.
- The most efficient models are up to four times as efficient as the least efficient and more than twice as efficient as the average unit sold (IEA, Jul 2026).
- Efficiency rules for air conditioners are in place in over 100 countries (IEA, Jul 2026).
- Some countries only require units to be one-quarter as efficient as the standards in Japan and Singapore (IEA, Jul 2026).
- The most stringent national standard for room air conditioners is around 65% above the least stringent (UNEP, Nov 2025).
- Inverter-based systems use over 30% less energy than conventional models (UNEP, Nov 2025).
- ENERGY STAR certified room air conditioners use 20% less energy than standard models and cost less than $70 a year to run on average (ENERGY STAR, Mar 2025).
Which markets sell inverter units?
Rich markets are all inverter. Hot, price-sensitive markets are not.
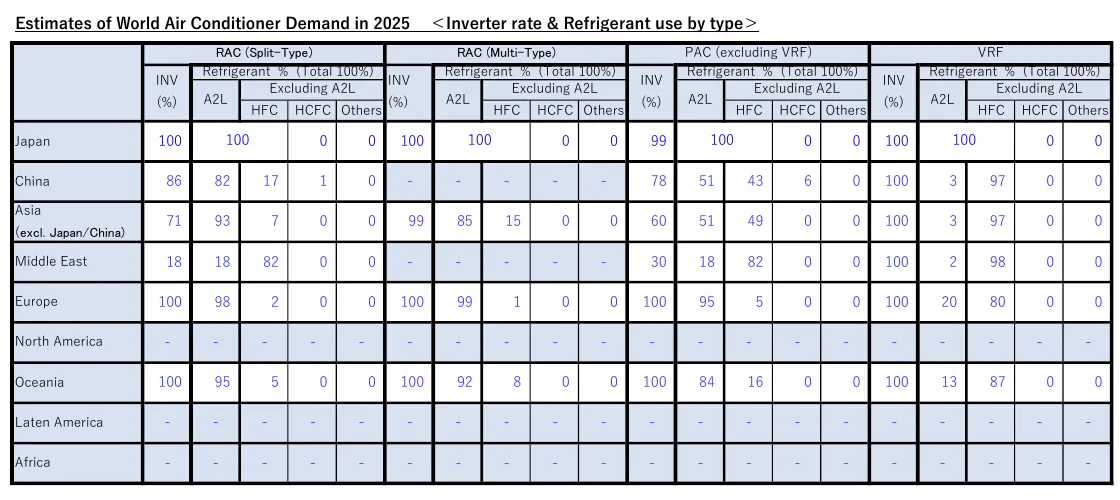
- Inverter units were 100% of split room air conditioner sales in Japan, Europe and Oceania in 2025 (JRAIA, Aug 2026).
- China was at 86% in 2025, against 88% in 2024 (JRAIA, Aug 2026).
- Asia excluding Japan and China was at 71%, up from 65% (JRAIA, Aug 2026).
- The Middle East was at 18% (JRAIA, Aug 2026).
- North America was at 93% in 2024, the latest year JRAIA reports for the region (JRAIA, Aug 2026).
What did China and India change?
Both used standards and star labels to move the market.
- Average efficiency of new room air conditioners in China improved 31% in 2022 compared with 2019 (Ember, Jul 2025).
- Variable-speed units were 61% of the Chinese market in 2020 and reached 95% in 2021, after a new standard took effect in July 2020 (Ember, Jul 2025).
- China’s trade-in subsidy covers 20% of the retail price for the top efficiency grade and 15% for the second grade (Ember, Jul 2025).
- Ember estimates the trade-in program could speed up efficiency gains in China’s stock by up to 70% and cut summer cooling electricity by up to 4.1% in 2025 (Ember, Jul 2025).
- Of the air conditioners in surveyed Indian homes, 33% were 5-star, 18% were 4-star and 40% were 3-star, and only 0.2% had no star rating (CLASP, May 2026).
Which refrigerants do air conditioners use?
The refrigerant inside the unit matters as much as the electricity it uses. Most of the world is mid-switch, and the regions are not moving at the same speed.
Which refrigerants do new units use?
It depends on where they are sold.
- A2L refrigerants were 100% of Japan’s split room air conditioner sales and 98% of Europe’s in 2025 (JRAIA, Aug 2026).
- China was at 82%, up from 76% in 2024, with 17% on other HFCs and 1% on HCFCs (JRAIA, Aug 2026).
- Asia excluding Japan and China was at 93%, up from 83% (JRAIA, Aug 2026).
- The Middle East was at 18%, with 82% on other HFCs (JRAIA, Aug 2026).
- North America was at 4% A2L and 96% other HFCs in 2024 (JRAIA, Aug 2026).
- Commercial packaged units in China were still 43% other HFCs and 6% HCFCs in 2025 (JRAIA, Aug 2026).
What do the global rules require?
The Kigali Amendment sets the floor, and some regions go further.
- The Kigali Amendment could avoid up to 1 degree C of warming by the end of the century if universally ratified and fully implemented (Ozone Secretariat, Nov 2024).
- The Montreal Protocol itself has 198 parties (Ozone Secretariat, Aug 2026).
- 62 countries follow a refrigerant phase-down stricter than the Kigali schedule, 50 follow Kigali, 43 are still drafting plans and 38 have not begun (UNEP, Nov 2025).
- Only 56 countries have mandatory refrigerant and servicing requirements (UNEP, Nov 2025).
What does the EU ban, and when?
The EU regulation sets dates for ending fluorinated gases in air conditioners.
- Portable plug-in room air conditioners with a GWP of 150 or more have been banned since 1 January 2020 (EUR-Lex, Feb 2024).
- Single split systems with under 3 kg of gas and a GWP of 750 or more were banned from 1 January 2025 (EUR-Lex, Feb 2024).
- Split air-to-air systems up to 12 kW with a GWP of 150 or more are banned from 1 January 2029 (EUR-Lex, Feb 2024).
- All fluorinated gases in split systems up to 12 kW are banned from 1 January 2035, unless safety requires them (EUR-Lex, Feb 2024).
How much does the refrigerant weigh on the climate?
A lot, and the bank of gas in service is growing.
- The global bank of refrigerants held 24 gigatons of CO2e in 2024 and is projected to reach 61 gigatons by 2050 (UNEP, Nov 2025).
- 54 countries have rules on passive cooling, efficiency and refrigerants, 78 cover two of the three and 40 cover one (UNEP, Nov 2025).
- The Global Cooling Pledge has more than 70 signatories committed to cut cooling emissions 68% by 2050 from 2022 levels (UNEP, Nov 2025).
Who still lacks cooling, and where is demand heading?
Demand will grow in the places that can least afford it. The risk is not only heat. It is a purchase of cheap, inefficient equipment that locks in high bills and emissions.
How many people lack access?
Over a billion, most of them in cities.
- 309 million of the high-risk group are rural poor, and 695 million are urban poor (SEforALL, Jul 2025).
- The high-risk group includes 512 million women and 492 million men (SEforALL, Jul 2025).
- The medium-risk group is the largest at 2.83 billion people (SEforALL, Jul 2025).
- 1.2 billion middle-income people are in the low-risk group, up 16.5% since 2019 (SEforALL, Jul 2025).
- China and India together hold 42% of the urban poor at high risk (SEforALL, Jul 2025).
- India has more than 1 billion people at medium risk by 2030 under business as usual, while China has over 650 million at low risk (SEforALL, Jul 2025).
What happens to demand by 2035?
It keeps growing, and a hot spell can speed it up.
- Under today’s policies, cooling demand grows by 1,600 TWh by 2035, about the electricity demand of Japan and Korea together (IEA, Jul 2026).
- A strong El Nino sensitivity case adds around 700 TWh by 2035, and more than 60% of that comes from new air conditioner adoption (IEA, Jul 2026).
- Eight countries have introduced cooling-related energy measures since March 2026 (IEA, Jul 2026).
- Six of them set minimum office air conditioner temperatures between 24 and 26 degrees C (IEA, Jul 2026).
How well does air conditioning cope with heat inside US homes?
Having a unit is not the same as staying comfortable. The American Housing Survey shows where homes with cooling still run hot, and equipment that is too small or broken is a large part of the reason. For how old that equipment is, see the residential HVAC replacement statistics page.
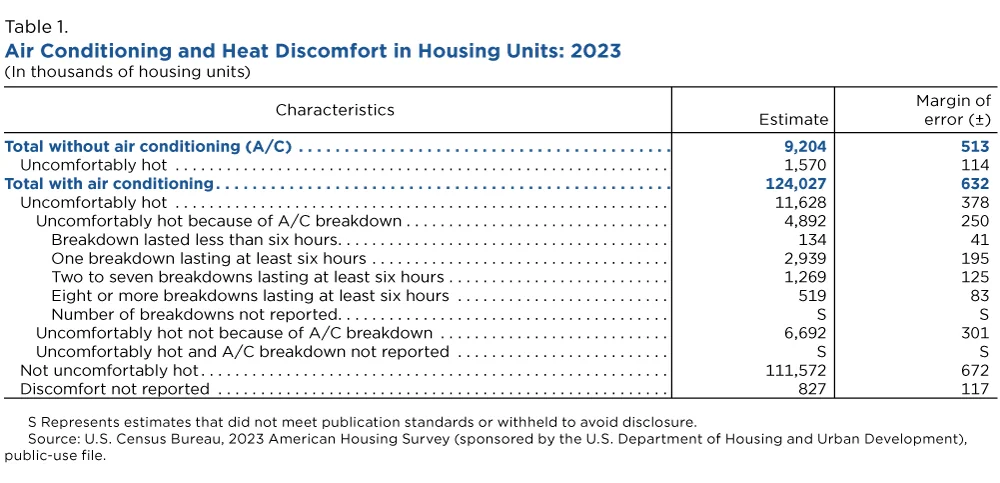
How many homes with air conditioning were still too hot?
Millions, even with a unit running.
- 111.6 million homes with air conditioning were not uncomfortably hot in the year before the survey (U.S. Census Bureau, Sep 2025).
- 1.57 million homes without air conditioning were uncomfortably hot (U.S. Census Bureau, Sep 2025).
- 6.69 million of the uncomfortable homes with air conditioning had no breakdown to blame (U.S. Census Bureau, Sep 2025).
What caused the problem?
Capacity and failures lead the list. The AC tonnage calculator is one way to check whether a unit matches the room it serves.
- Inadequate cooling capacity was the most reported cause after breakdowns, ahead of utility interruptions or power outages at 1.3 million households (U.S. Census Bureau, Sep 2025).
- The cost of cooling and inadequate insulation were each reported by 0.7 million households, and leaky windows, doors and walls by 0.4 million (U.S. Census Bureau, Sep 2025).
How long do breakdowns last?
Often more than six hours.
- 2.94 million homes had one breakdown that lasted at least six hours (U.S. Census Bureau, Sep 2025).
- 1.27 million had two to seven such breakdowns (U.S. Census Bureau, Sep 2025).
- 0.52 million had eight or more (U.S. Census Bureau, Sep 2025).
Can a home stay cool without it?
Often not, and shade is rare.
- 32.7% of households said their home did not stay cool very well or not well at all without a cooling device (U.S. Census Bureau, Sep 2025).
- 40.5% of households, about 54 million, said the outside of their home was not shaded by trees or other buildings (U.S. Census Bureau, Sep 2025).
- 33.0% of households, about 44 million, described the shade within a half block as minimal or none (U.S. Census Bureau, Sep 2025).
Methodology and Sources
Every figure comes from the agency, statistics office, industry association or journal that produced it, and each link points to the report, table or release itself. Roundups and trade blogs were not used. Ownership shares, sales counts and refrigerant shares are measured by different bodies with different definitions, so figures from different sources are not added together. JRAIA counts room and commercial units but excludes portable units, while the IEA counts shipments. Italian, German and French sources were read in their original language or an official English version. The page is refreshed every month.
Glossary
- A2L: a class of refrigerants with low toxicity and low flammability, including R-32 and R-454B.
- CDD: cooling degree days, a measure of how far outdoor temperature sits above a base value.
- GWP: global warming potential, how much a gas warms the climate compared with carbon dioxide.
- HCFC: hydrochlorofluorocarbon, an older refrigerant family being phased out.
- HFC: hydrofluorocarbon, a refrigerant family with a high GWP.
- Inverter: a variable-speed compressor that adjusts output instead of switching on and off.
- RAC: room air conditioner.
- RECS: the Residential Energy Consumption Survey, run by the EIA.
- TWh: terawatt-hour, one billion kilowatt-hours.
Sources
- Census Bureau, Heat Risks and Cooling Problems in America’s Households
- Census Bureau, Local Air Conditioning Estimates
- EIA, Highlights for air conditioning in U.S. homes by state, 2020
- EIA, Table HC7.1 by housing unit type
- EIA, Table HC7.2 by owner or renter status
- EIA, Table HC7.5 by household income
- EIA, Table HC7.6 by climate region
- EIA, Table HC7.9 by home size
- EIA, Table CE4.6 end-use consumption, averages
- EIA, Table CE4.16 end-use expenditures, averages
- ISTAT, Household energy equipment, Year 2024
- Destatis, Zahl der Woche Nr. 27, 2026
- ADEME BatiZoom, Part des logements climatises
- EDRC, Socio-technical drivers of air conditioning adoption and use in UK homes
- IEA, Cooling a hotter world: El Nino meets strong growth in global electricity demand
- JRAIA, Estimates of World Air Conditioner Demand by Country
- JRAIA, Inverter rate and refrigerant use by type
- CLASP, Residential Energy Consumption Patterns and Appliance Ownership in India
- ABS, Environmental Issues: Energy Use and Conservation
- Nature Communications, Inequalities in global residential cooling energy use to 2050
- Ember, China’s consumer goods trade-in
- UNEP, Global Cooling Watch 2025
- Ozone Secretariat, All ratifications
- Ozone Secretariat, Kigali Amendment ratifications update
- EUR-Lex, Regulation (EU) 2024/573
- ENERGY STAR, Certified Room Air Conditioners 2025 Key Messaging
- SEforALL, Chilling Prospects 2025, Access to Cooling Risk