Heating statistics tell one plain story: most homes in cold places still burn something to stay warm, and the mix of fuels is moving slowly toward electricity. This page collects the numbers that matter to techs, homeowners and energy readers, from the agencies that produced them.
Every figure links to its primary source with a date. We use government surveys, national statistics offices, fire safety research and the International Energy Agency. We do not use roundups. The page is refreshed monthly, so the winter cost outlook and price data stay current.
The data points one way and then another. Gas still leads, but electric homes are close behind. Oil is fading, yet it is the fuel with the sharpest price jump this winter. Weather decides how much heat a house needs, so the page also covers degree days, fires and how Europe, Britain and Canada heat their homes.
Key Takeaways
- Utility gas was the main heating fuel in 61,887,114 of 132,737,146 occupied U.S. homes in 2024 (U.S. Census Bureau, Sep 2025).
- Electricity was the main heating fuel in 55,481,476 U.S. homes in 2024 (U.S. Census Bureau, Sep 2025).
- U.S. households that heat mainly with oil fell from 5,049 thousand in 2021 to 4,134 thousand in 2026 (EIA, Oct 2026).
- 3.20 million rented U.S. homes did not use any heating equipment in 2020, against 2.59 million owned homes (EIA, Mar 2023).
- Homes that heat with oil face the biggest jump this winter, with average spending forecast at $2,115 for the season, up 21% (EIA, Oct 2026).
- A Midwest winter brings 4,802 heating degree days against 2,021 in the South for November to March (EIA, Oct 2026).
- Heating equipment started an estimated 37,365 U.S. home fires a year from 2020 to 2024 and caused 417 civilian deaths a year (NFPA, Dec 2025).
- Nearly half of heating equipment fires, 46%, happen from December through February (NFPA, Dec 2025).
- Natural gas supplied 70.3% of space heating energy in Dutch homes in 2024 (Eurostat, Jun 2026).
- 86% of English households use a gas fired main heating system (UK Government, English Housing Survey, May 2025).
- Oil central heating is still the main heating method for 61% of Northern Ireland households (NISRA, Nov 2025).
- Space heating used 814.8 petajoules of the 1,372.4 petajoules Canadian homes used in 2023 (Natural Resources Canada, Mar 2026).
- Heat made up almost half of global final energy consumption and 37% of energy-related CO2 emissions in 2024 (IEA, Oct 2025).
What fuel do most U.S. homes use for home heating?
Gas is still the biggest fuel, but electricity is closing the gap and oil is the one that keeps shrinking.
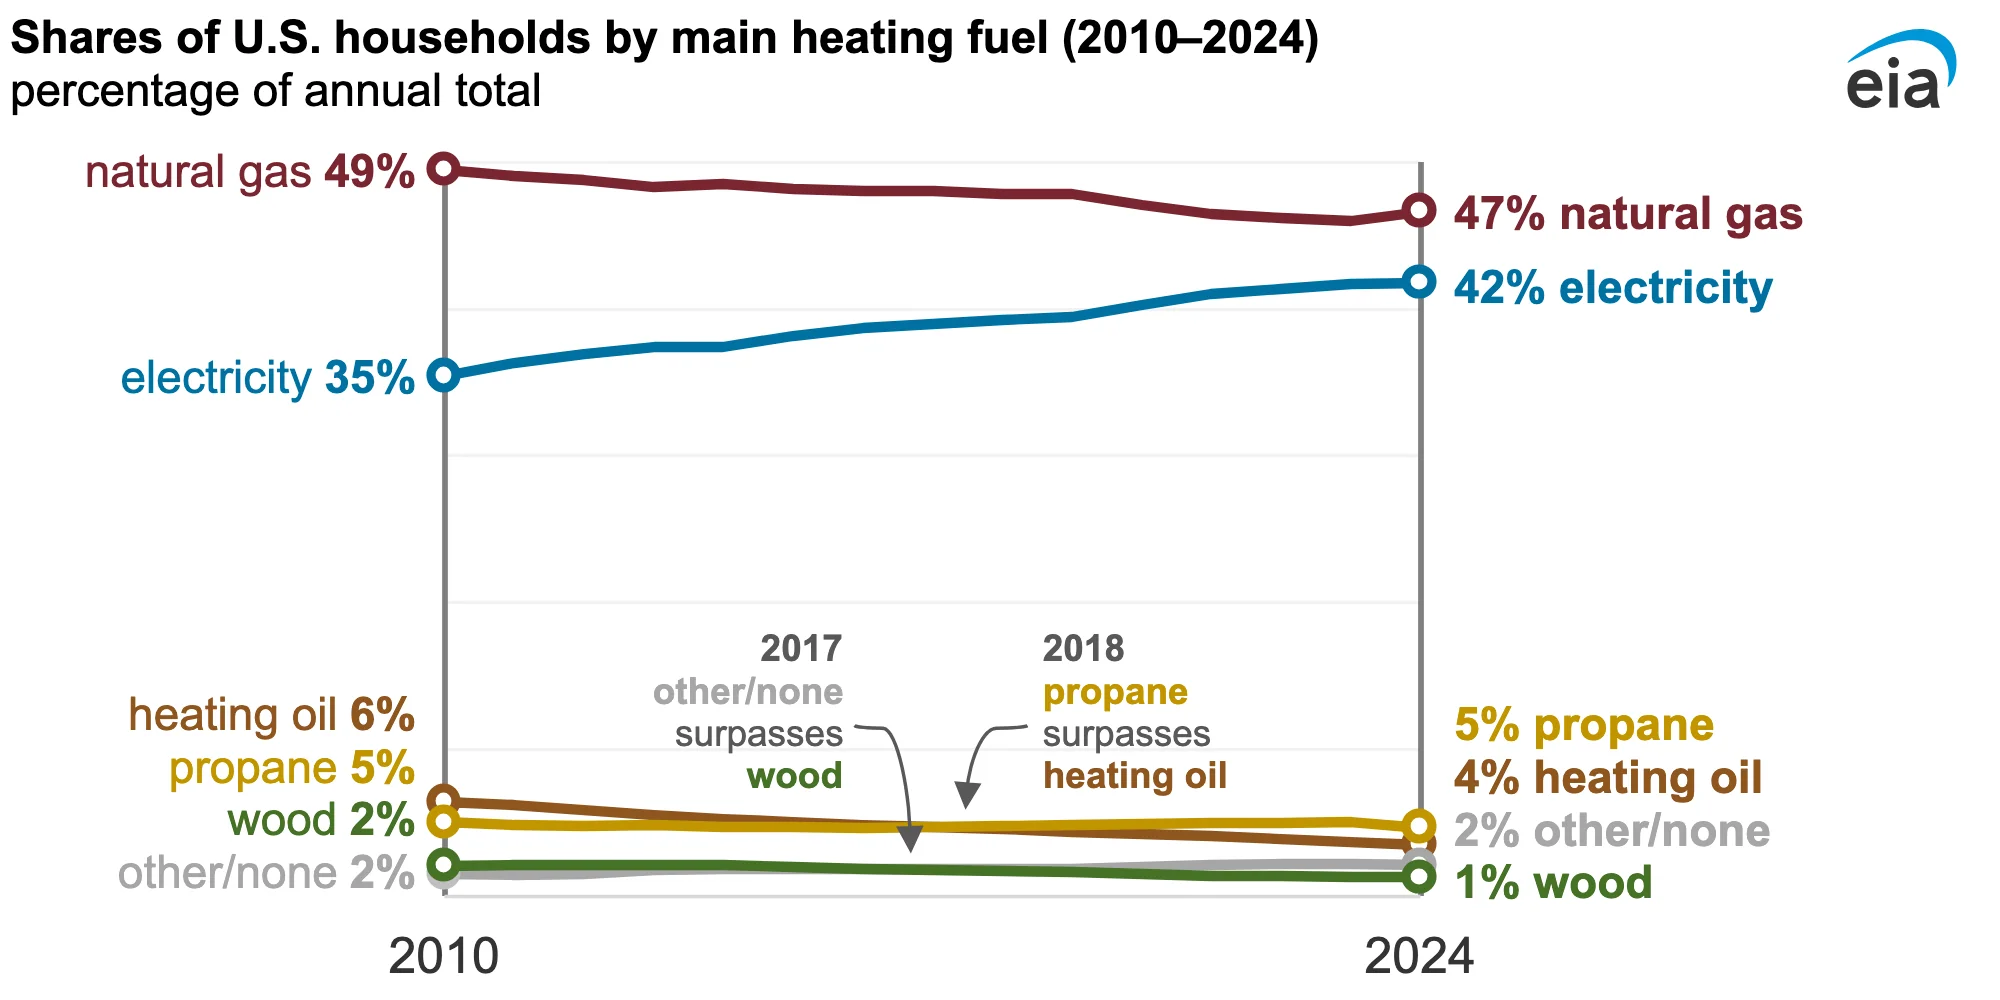
How many homes use each of the other fuels?
Bottled gas, oil and wood each heat a small slice of homes, and some homes use no fuel at all.
- Bottled or tank gas was the main heating fuel in 6,183,787 homes (U.S. Census Bureau, Sep 2025).
- Fuel oil, kerosene and similar fuels heated 4,654,835 homes (U.S. Census Bureau, Sep 2025).
- Wood heated 1,714,541 homes (U.S. Census Bureau, Sep 2025).
- Solar energy was the main heating source in 535,943 homes (U.S. Census Bureau, Sep 2025).
- Coal or coke was still the main heating fuel in 84,030 homes (U.S. Census Bureau, Sep 2025).
- 1,628,472 homes reported that they used no fuel for heating (U.S. Census Bureau, Sep 2025).
How fast is the fuel mix changing?
Electric and gas homes both grew with the housing stock, while oil lost ground.
- Households with electricity as the main heating fuel grew from 53,325 thousand in 2021 to 57,880 thousand in 2026 (EIA, Oct 2026).
- Households with natural gas as the main fuel grew from 59,114 thousand in 2021 to 60,962 thousand in 2026 (EIA, Oct 2026).
How much of the housing stock do the main fuels cover?
Four fuels cover nearly every home, and a small group has no heat equipment in use.
- Natural gas, electricity, propane and heating oil cover about 96% of the U.S. housing population (EIA, Oct 2025).
- 5.79 million U.S. homes did not use any heating equipment in 2020 (EIA, Mar 2023).
Related reading: natural gas statistics and heat pump statistics.
What kind of equipment heats U.S. homes?
Ducted warm-air systems carry the load in most homes, and many households add a second heat source on top.
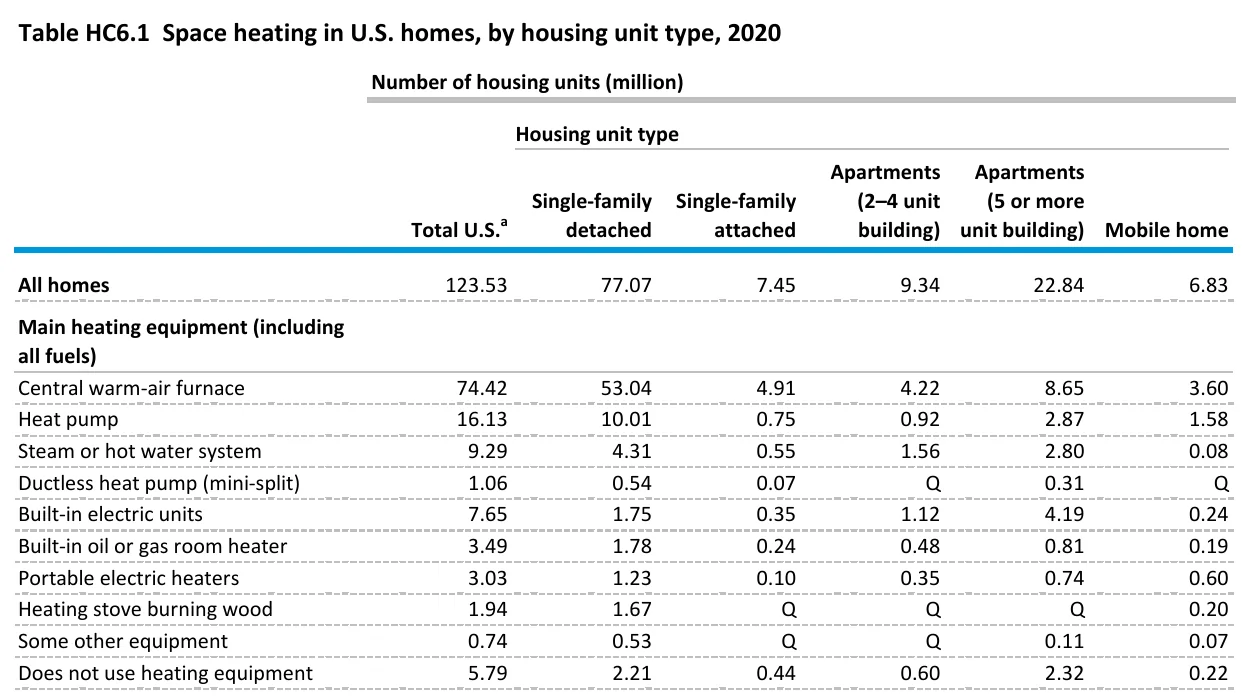
Which main heating equipment follows the furnace?
After the furnace, boiler systems and built-in electric units lead, and a tail of room heaters and stoves fills the rest.
- Steam or hot water systems heated 9.29 million homes (EIA, Mar 2023).
- Built-in electric units heated 7.65 million homes (EIA, Mar 2023).
- Built-in oil or gas room heaters heated 3.49 million homes (EIA, Mar 2023).
- Heating stoves that burn wood were the main equipment in 1.94 million homes (EIA, Mar 2023).
Do renters and owners heat their homes the same way?
Renters lean on electric units far more than owners do.
- 5.55 million rented homes used built-in electric units as main heat, against 2.10 million owned homes (EIA, Mar 2023).
How many homes add a second heat source, and how warm do people keep the house?
Many homes add a second heat source, and winter thermostat settings cluster near 70 degrees.
- 51.80 million homes used secondary heating equipment in winter (EIA, Mar 2023).
- 10.92 million homes used their secondary heat all or almost all of the time (EIA, Mar 2023).
- 26.95 million homes held 70 degrees when someone was home in winter (EIA, Mar 2023).
- 14.85 million homes kept winter nights at 63 degrees or less (EIA, Mar 2023).
Picking a replacement system starts with the real heat loss of the house, not with the size of the old unit. A free heat pump sizing calculator gives a first estimate.
How cold are U.S. winters, and how much heat do homes need?
Heat demand follows the weather, and the weather differs a lot from region to region and from one year to the next.
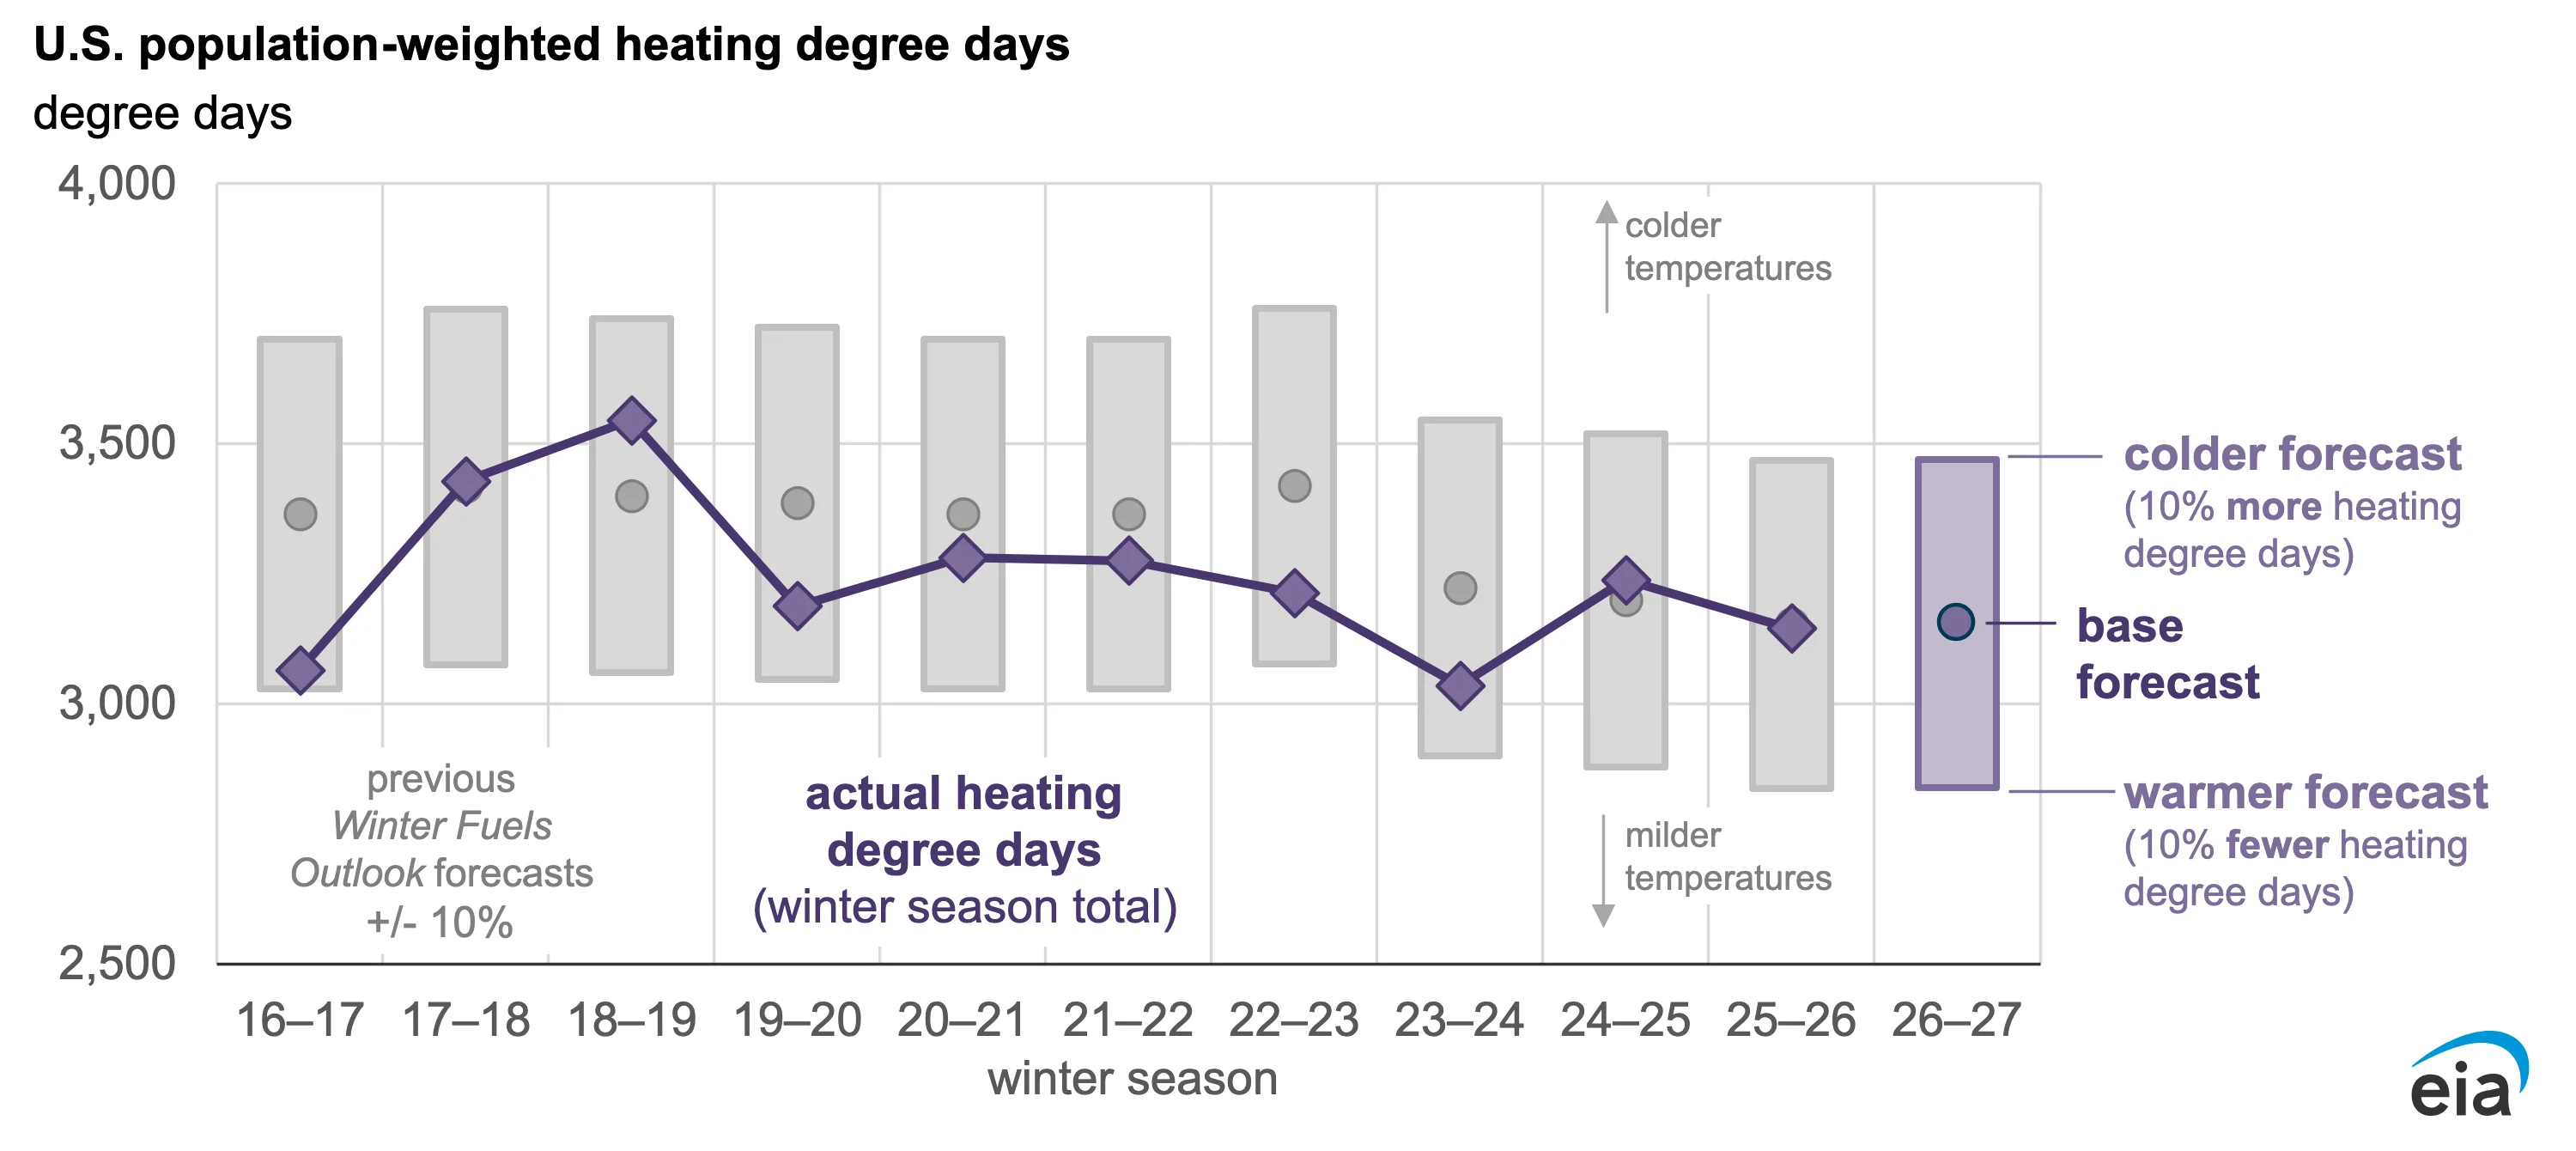
What is a heating degree day?
A heating degree day counts how many degrees a day’s average temperature falls below 65°F.
- A 50°F day adds 15 degree days, so a 30-day month of 50°F days adds 450 (EIA, Oct 2026).
How many degree days does each region get?
The Northeast and Midwest need far more heat than the South, and the West is the swing region this winter.
- The U.S. population-weighted total for November 2026 to March 2027 is forecast at 3,155 degree days (EIA, Oct 2026).
- The Northeast is forecast at 4,331 degree days, 12% fewer than last winter (EIA, Oct 2026).
- The West is forecast at 2,781 degree days, 25% more than last winter (EIA, Oct 2026).
How many degree days does a full year bring?
A calendar year adds up to roughly 4,000 degree days nationally, and cold regions run several times higher than warm ones.
- The U.S. averaged 4,023 heating degree days in 2025 (EIA, Oct 2026).
- EIA forecasts 3,818 degree days for 2026, against a prior 10-year average of 3,994 (EIA, Oct 2026).
- New England logged 6,310 degree days in 2025 (EIA, Oct 2026).
- The West South Central region logged 1,777 degree days in 2025 (EIA, Oct 2026).
How well do winter forecasts hold up?
Winter outlooks are useful but not exact, so the bills they imply carry a margin.
- In 9 of the past 10 winters, the actual national weather fell inside EIA’s colder and warmer forecast cases (EIA, Oct 2025).
Is the climate shifting heat demand, and what is next winter expected to do?
Long-run averages are creeping warmer, and the next winter outlook favors warmth across the north.
- The 1991 to 2020 U.S. normal for the contiguous states is 53.3°F, up from 52.8°F in the 1981 to 2010 normals (NOAA NCEI, May 2021).
- Canada’s heating degree-day index fell from 0.96 in 2000 to 0.82 in 2023 (Natural Resources Canada, Mar 2026).
- NOAA favors warmer-than-average temperatures for December 2026 to February 2027 across northern California, the Pacific Northwest, the Midwest, the Mississippi Valley, much of the East and Alaska (NOAA, Oct 2026).
- NOAA expects near-normal temperatures for parts of the Southeast including Florida, with equal odds of warm, cool or normal in Hawaii and much of the Southwest (NOAA, Oct 2026).
A load estimate for one house starts from its design temperature and its heat loss. A free BTU calculator turns room size and climate into a first heating number.
How much does it cost to heat a home with each fuel?
Fuel choice decides the bill, and this winter the gap between oil households and gas households is wide.
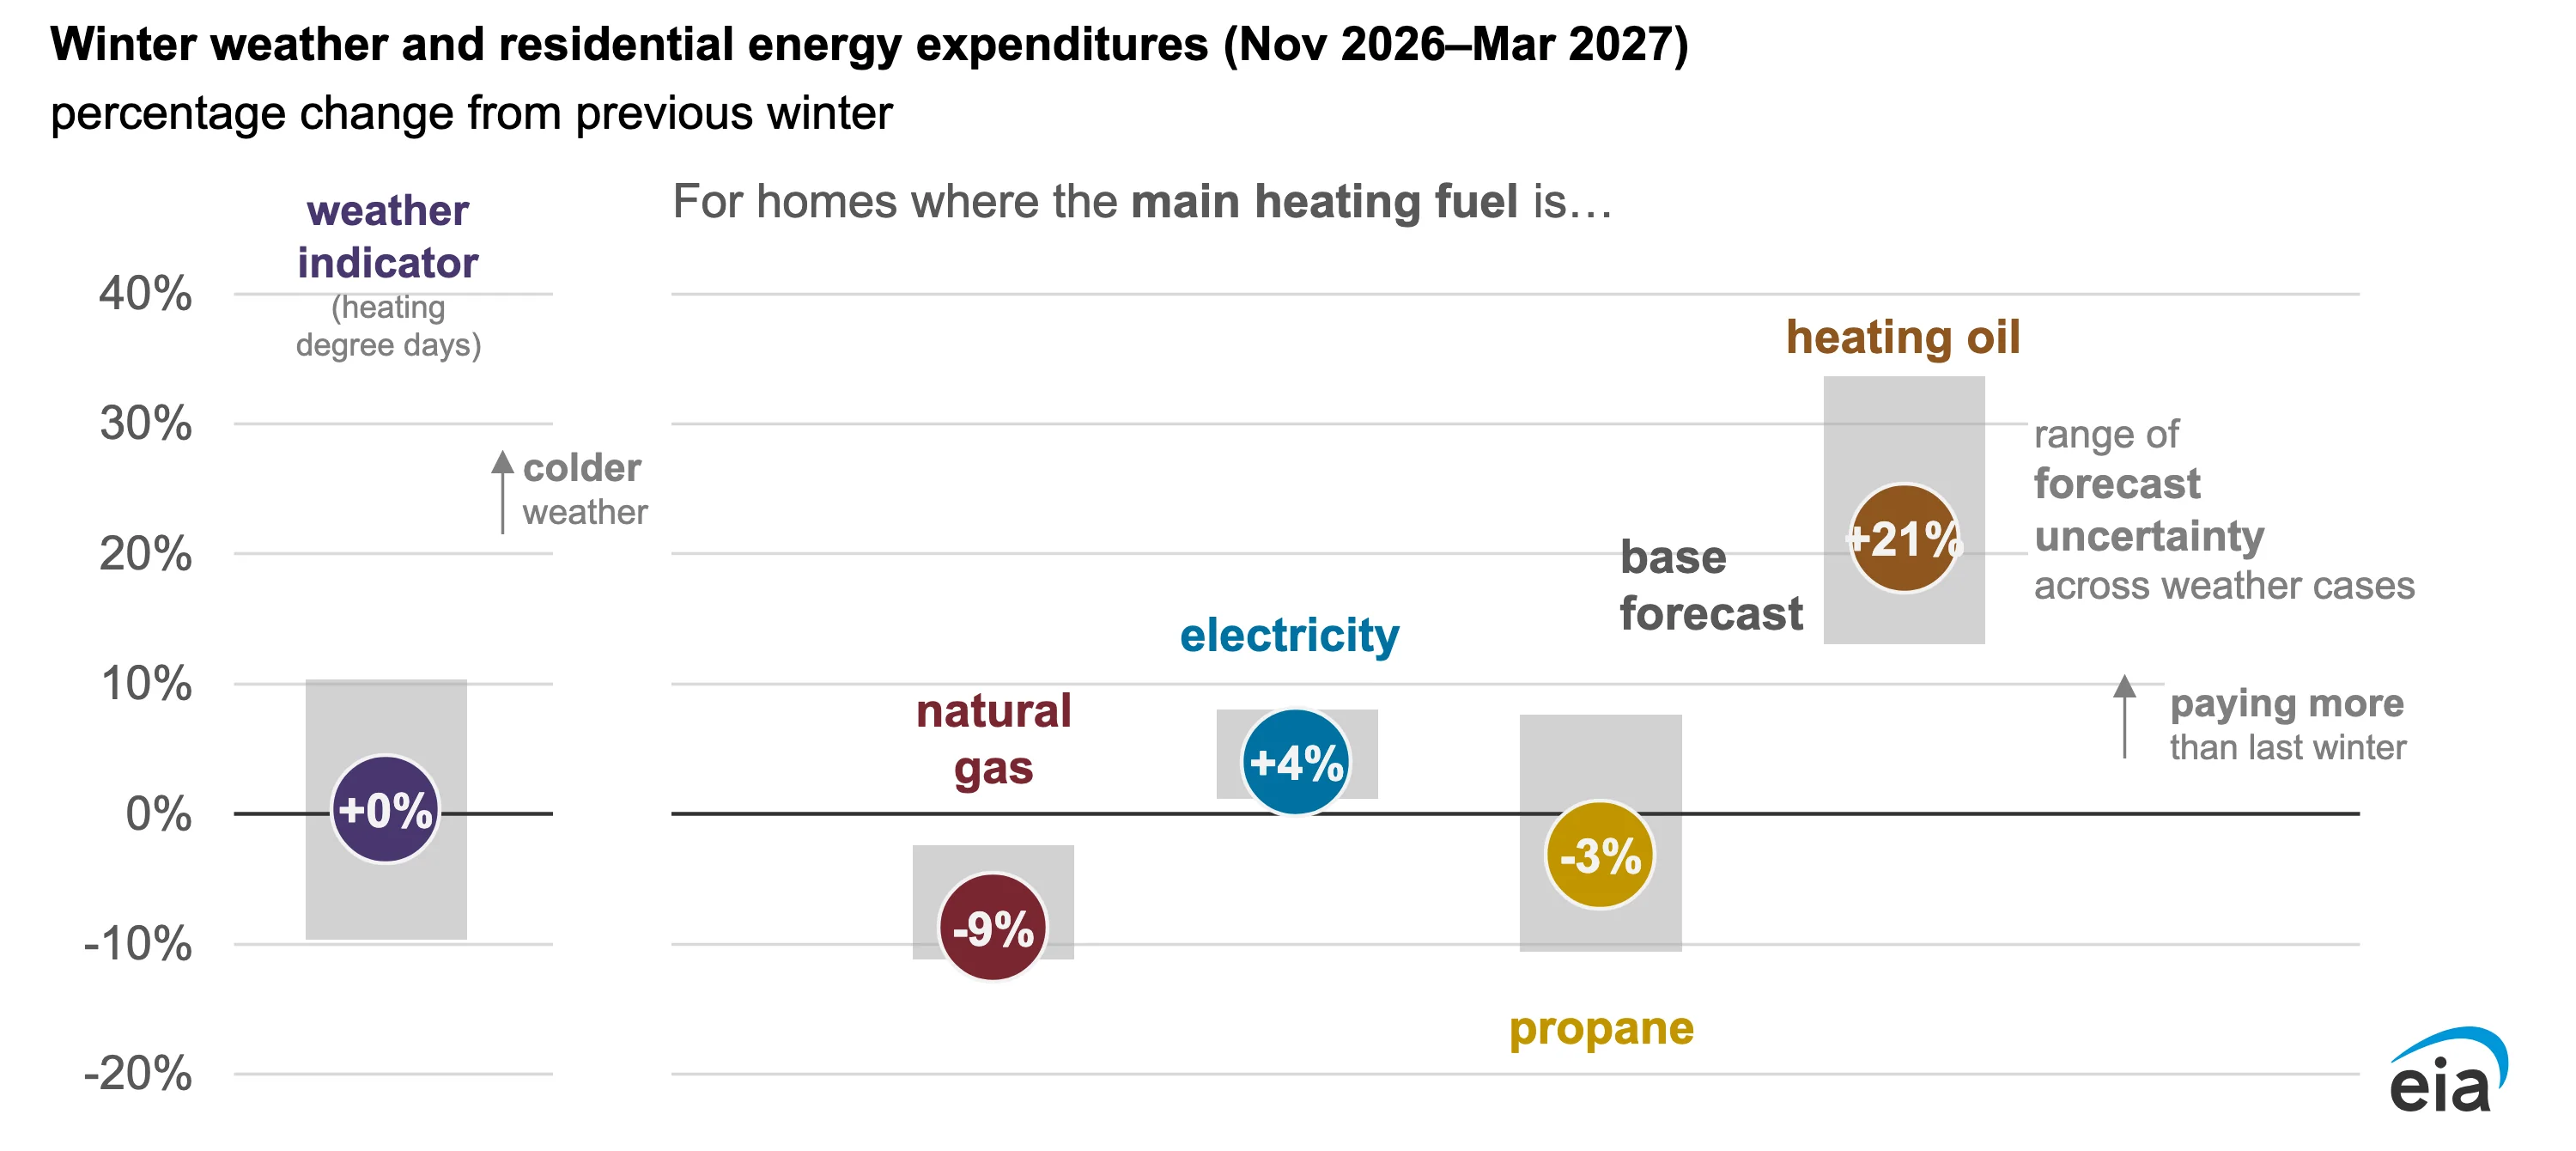
What will households spend this winter?
Spending is for the full November to March season and covers every use of the main heating fuel.
- Natural gas households are forecast to spend $640 on average, 9% less than last winter (EIA, Oct 2026).
- Electric households are forecast to spend $1,196, which is 4% more (EIA, Oct 2026).
- Propane households are forecast to spend $1,246, which is 3% less (EIA, Oct 2026).
What are the prices behind the bills?
Oil is the outlier, with the biggest price jump of the four fuels.
- The U.S. average residential gas price is forecast at $13.44 per thousand cubic feet, 9% lower (EIA, Oct 2026).
- The average electricity price is forecast at 18.23 cents per kilowatthour, 3% higher (EIA, Oct 2026).
- Heating oil is forecast at $5.26 a gallon, up 34% (EIA, Oct 2026).
- Oil households are expected to burn 402 gallons this winter, 9% fewer than last year (EIA, Oct 2026).
What is pushing heating oil prices up?
Tight diesel markets and low East Coast stocks are behind the oil jump, while gas storage gives gas users a cushion.
- East Coast distillate inventories were 32% below their five-year seasonal average in September (EIA, Oct 2026).
- Natural gas inventories are expected to enter the heating season 2% above the previous five-year average (EIA, Oct 2026).
How fast are household energy prices rising in the Northeast?
The Northeast shows the pressure oil and gas users feel, with household fuel prices above last year.
- Energy prices in the Northeast rose 23.1% in the 12 months to September 2026 (BLS, Oct 2026).
- The household energy index rose 13.6% over the same 12 months (BLS, Oct 2026).
- Piped gas service rose 9.6% over the year (BLS, Oct 2026).
- Electricity rose 7.1% over the year (BLS, Oct 2026).
What about Canada?
Canadian price moves in 2025 were mild except for oil and other fuels.
- Canadian prices for fuel oil and other fuels rose 8.0% year over year in September 2025 (Statistics Canada, Oct 2025).
- Canadian electricity prices rose 1.8% over the same year (Statistics Canada, Oct 2025).
For the bigger picture of what heating and cooling use, see HVAC energy consumption statistics.
Which states and regions rely on which heating fuels?
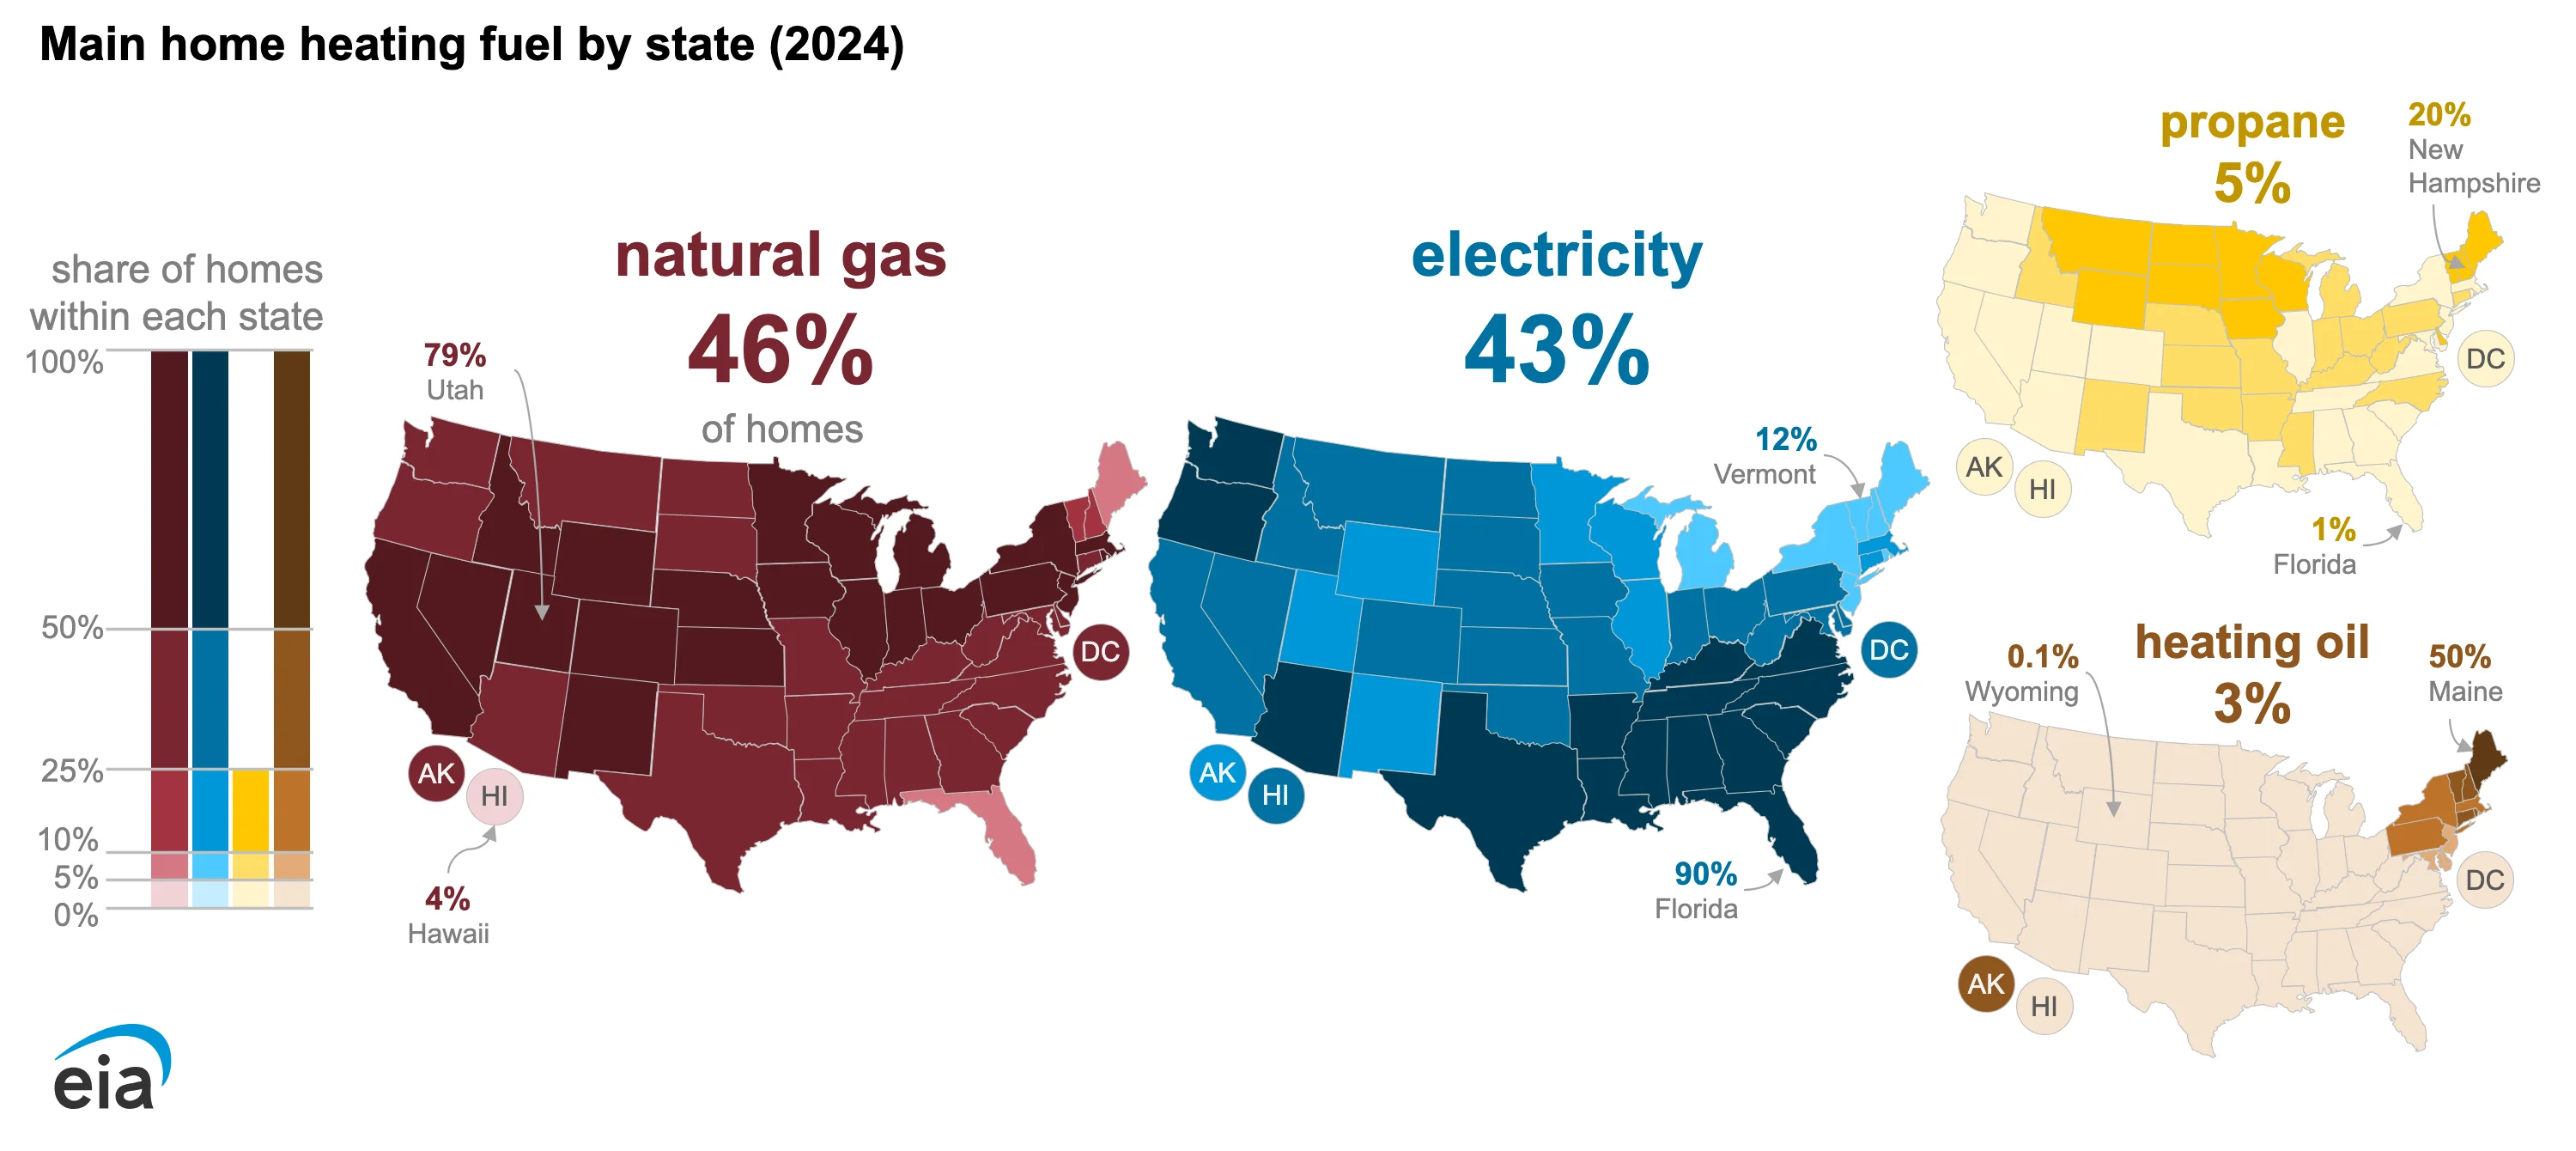
Geography still sorts fuels: gas in the cold interior, electricity in the South, oil and propane where pipelines do not reach.
Where is gas the default, and where is it rare?
Gas ranges from nearly universal to almost absent depending on the state.
- Natural gas was the main heating fuel in 79% of Utah homes in 2024 (EIA, Oct 2026).
- Natural gas heated only 4% of Hawaii homes in 2024 (EIA, Oct 2026).
Where is electric heat the norm?
Warm-winter states choose electricity almost by default.
- Electricity was the main heating fuel in 90% of Florida homes in 2024 (EIA, Oct 2026).
- Electricity heated just 12% of Vermont homes in 2024 (EIA, Oct 2026).
Where do oil and propane still matter?
Oil is a New England fuel, and propane is a fuel of the northern plains and rural homes.
- Heating oil was the main fuel in 50% of Maine homes in 2024 (EIA, Oct 2026).
- Propane was the main fuel in 20% of New Hampshire homes in 2024 (EIA, Oct 2026).
- 3,388 thousand oil-heated households are in the Northeast, more than in the Midwest, South and West combined (EIA, Oct 2026).
How different are regional winter bills?
The same fuel costs very different amounts depending on climate and local prices.
- Natural gas households in the Northeast are forecast to spend $879 this winter, against $511 in the South (EIA, Oct 2026).
How often do home heating systems start fires?
Heating fires are a minority of home fires, yet they cost lives and money every year, and the risk peaks in the coldest weeks.
How much harm do heating fires do each year?
Heating fires are rarer than kitchen fires but they cause real losses.
- Heating equipment fires made up 11% of all reported home fires from 2020 to 2024 (NFPA, Dec 2025).
- They caused an estimated 1,260 civilian injuries a year (NFPA, Dec 2025).
- They caused an estimated $1.2 billion in property damage a year (NFPA, Dec 2025).
- Larger fires involving fireplaces or chimneys were 6% of heating equipment fires but caused 19% of direct property damage (NFPA, Dec 2025).
Which heating equipment is involved?
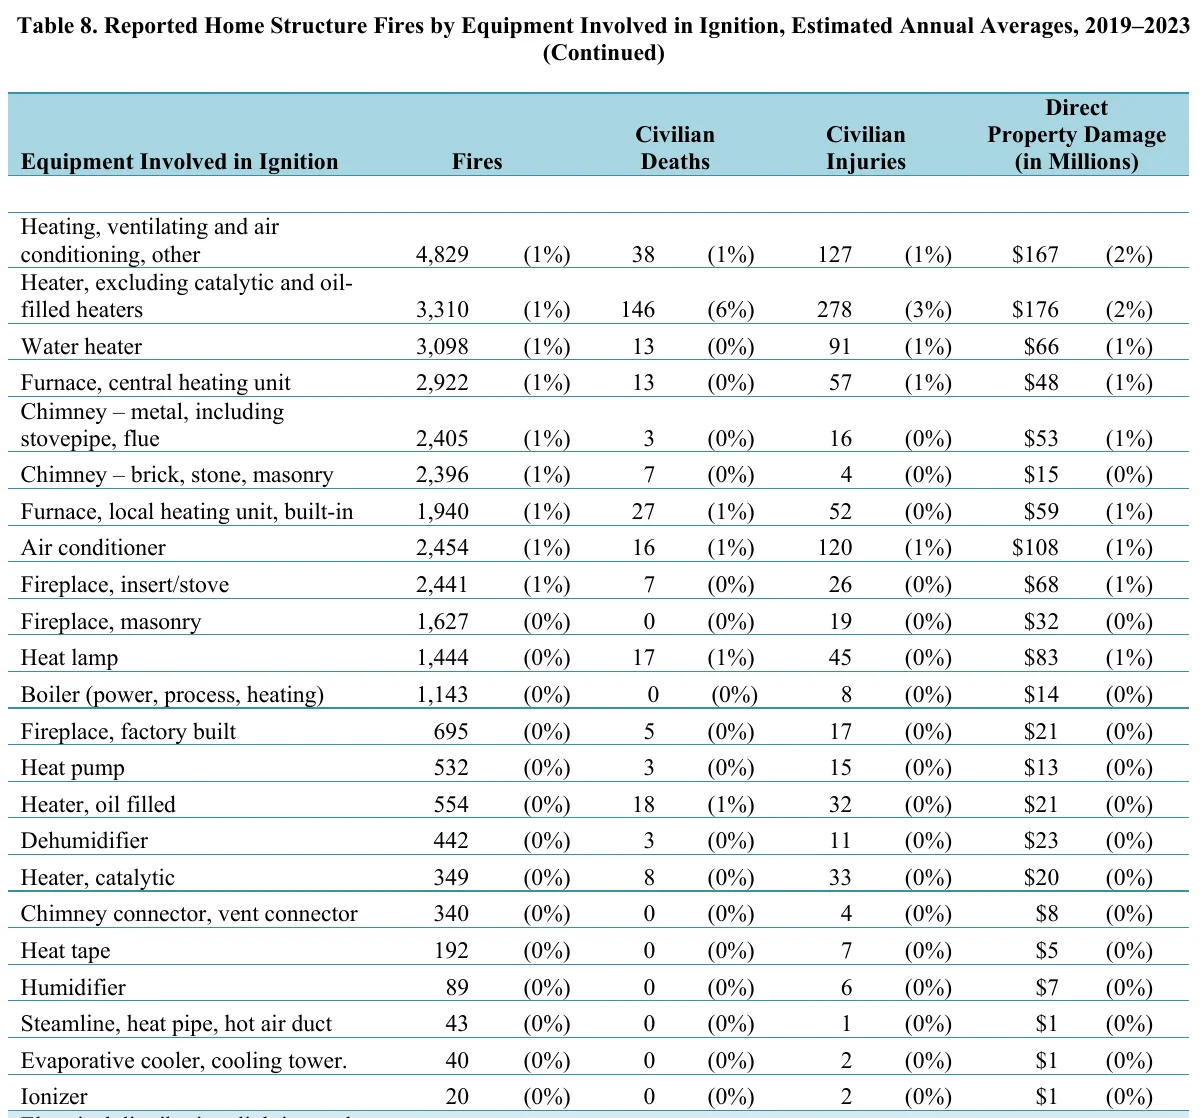
Chimneys, fireplaces and boilers each start thousands of fires a year.
- Heating, ventilating and air conditioning equipment was involved in 73,079 home fires a year from 2019 to 2023, 22% of the total (NFPA, Aug 2025).
- That equipment was tied to 503 civilian deaths a year, 19% of home fire deaths (NFPA, Aug 2025).
- Metal chimneys, stovepipes and flues started 2,405 fires a year (NFPA, Aug 2025).
- Brick, stone and masonry chimneys started 2,396 fires a year (NFPA, Aug 2025).
- Fireplace inserts and stoves started 2,441 fires a year (NFPA, Aug 2025).
- Masonry fireplaces started 1,627 fires a year (NFPA, Aug 2025).
- Factory-built fireplaces started 695 fires a year (NFPA, Aug 2025).
- Boilers started 1,143 fires a year (NFPA, Aug 2025).
- Water heaters started 3,098 fires a year (NFPA, Aug 2025).
- Heat tape started 192 fires a year (NFPA, Aug 2025).
How much of Europe’s and the world’s energy goes to heat?
Heat is the biggest single use of energy in European homes, and it is a huge slice of energy use worldwide.
How is EU household heating energy changing?
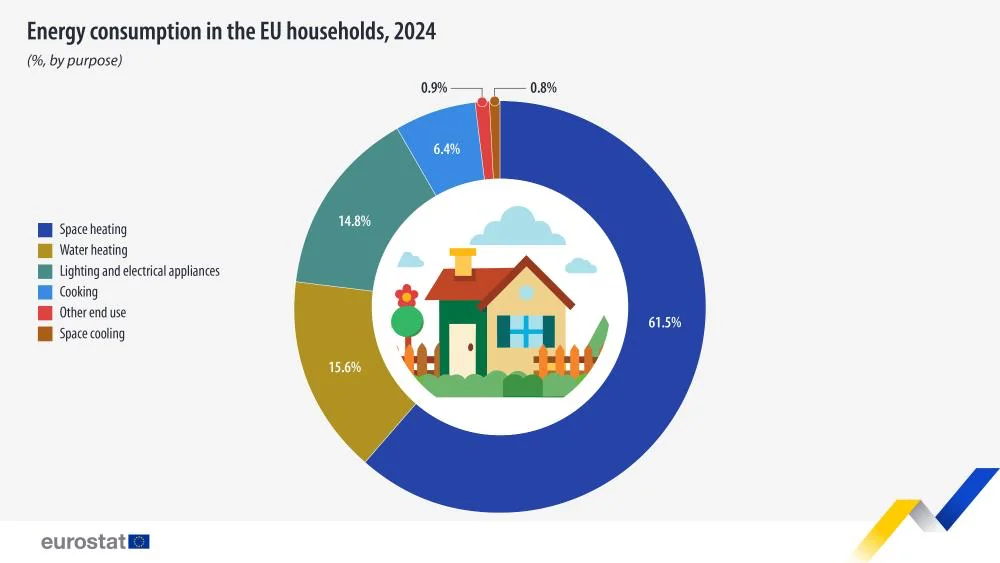
Household energy use in the EU has fallen three years in a row, and space heating is falling with it.
- Energy used for space heating fell 1.2% from 2023 (Eurostat, Jun 2026).
- Heating of space and water together took 77.1% of the energy EU households used in 2024 (Eurostat, Jun 2026).
Which fuels heat EU homes?
Gas and renewables lead the field, and oil and district heat each cover about a tenth.
- Oil products supplied 12.7% of space heating energy (Eurostat, Jun 2026).
- Derived heat from district networks supplied 10.4% (Eurostat, Jun 2026).
Which countries lean on which fuel?
Fuel choice differs sharply from country to country, from gas markets to island oil users and northern district heat.
- Space heating took 73.0% of household energy in Estonia, against 28.8% in Portugal (Eurostat, Jun 2026).
- Renewables supplied 86.6% of space heating energy in Portugal and 61.9% in Croatia (Eurostat, Jun 2026).
- Gas supplied 57.8% in Italy (Eurostat, Jun 2026).
- Petroleum products supplied 62.9% in Cyprus and 56.6% in Ireland (Eurostat, Jun 2026).
- Derived heat supplied 51.0% in Sweden and 42.2% in Denmark (Eurostat, Jun 2026).
- Solid fuels still supplied 26.9% in Poland (Eurostat, Jun 2026).
How big is heat worldwide?
Buildings and heat both sit near the top of the global energy ledger, and renewables are still a small part of heat.
- Buildings account for around 30% of global energy demand (IEA, Nov 2025).
- The residential sector makes up about 70% of building energy demand (IEA, Nov 2025).
- In advanced economies, space and water heating take about 70% of energy used in homes (IEA, Nov 2025).
- Per capita space and water heating energy in emerging and developing economies is less than one-fourth of the advanced economy level (IEA, Nov 2025).
- Renewable energy, excluding traditional biomass, met 14% of global heat consumption in 2024 (IEA, Oct 2025).
- Global heat consumption grew 6% from 2018 to 2024 (IEA, Oct 2025).
- Renewable heat use is expected to rise more than 42% from 2025 to 2030 (IEA, Oct 2025).
- Heat-related CO2 emissions could total 100 Gt from 2025 to 2030, more than one-fifth of the remaining carbon budget for 1.5°C (IEA, Oct 2025).
How do homes in Britain and Canada heat?
Britain is a gas boiler country with a rural oil belt, and Canada runs on gas and electricity with oil almost gone.
How do English homes heat?
Gas is the base, with electric and communal systems far behind and a visible rural split.
- 809,000 English households (3%) were heated by a solid or oil fired system in 2023-24 (UK Government, English Housing Survey, May 2025).
- 2 million households (8%) used an electrical system (UK Government, English Housing Survey, May 2025).
- 608,000 households (2%) were heated by a communal system (UK Government, English Housing Survey, May 2025).
- 32% of rural households used a solid fuel or oil fired system, against 0.7% of urban households (UK Government, English Housing Survey, May 2025).
- 90% of urban households used a gas fired system, against 51% of rural households (UK Government, English Housing Survey, May 2025).
- 6.4 million households (26%) lived with a primary heating system more than 12 years old (UK Government, English Housing Survey, May 2025).
- 31% of private renters had a primary system older than 12 years (UK Government, English Housing Survey, May 2025).
- 73% of new dwellings created in London in the five years to 2024 had community heating as the main fuel type, up from 45% in the five years to 2013 (ONS, Oct 2024).
How do Northern Ireland homes heat?
Oil is still king there, but gas is gaining and many homes keep a fire or stove as a back-up.
- 36% of Northern Ireland households used gas as their primary heating method in 2024/25, up from 32% the year before (NISRA, Nov 2025).
- 80% of households with more than one heating method used an open or closed fire or stove as the second method (NISRA, Nov 2025).
- Of households burning solid fuel as a second method, 45% mainly burned wood logs (NISRA, Nov 2025).
How do Canadian homes heat?
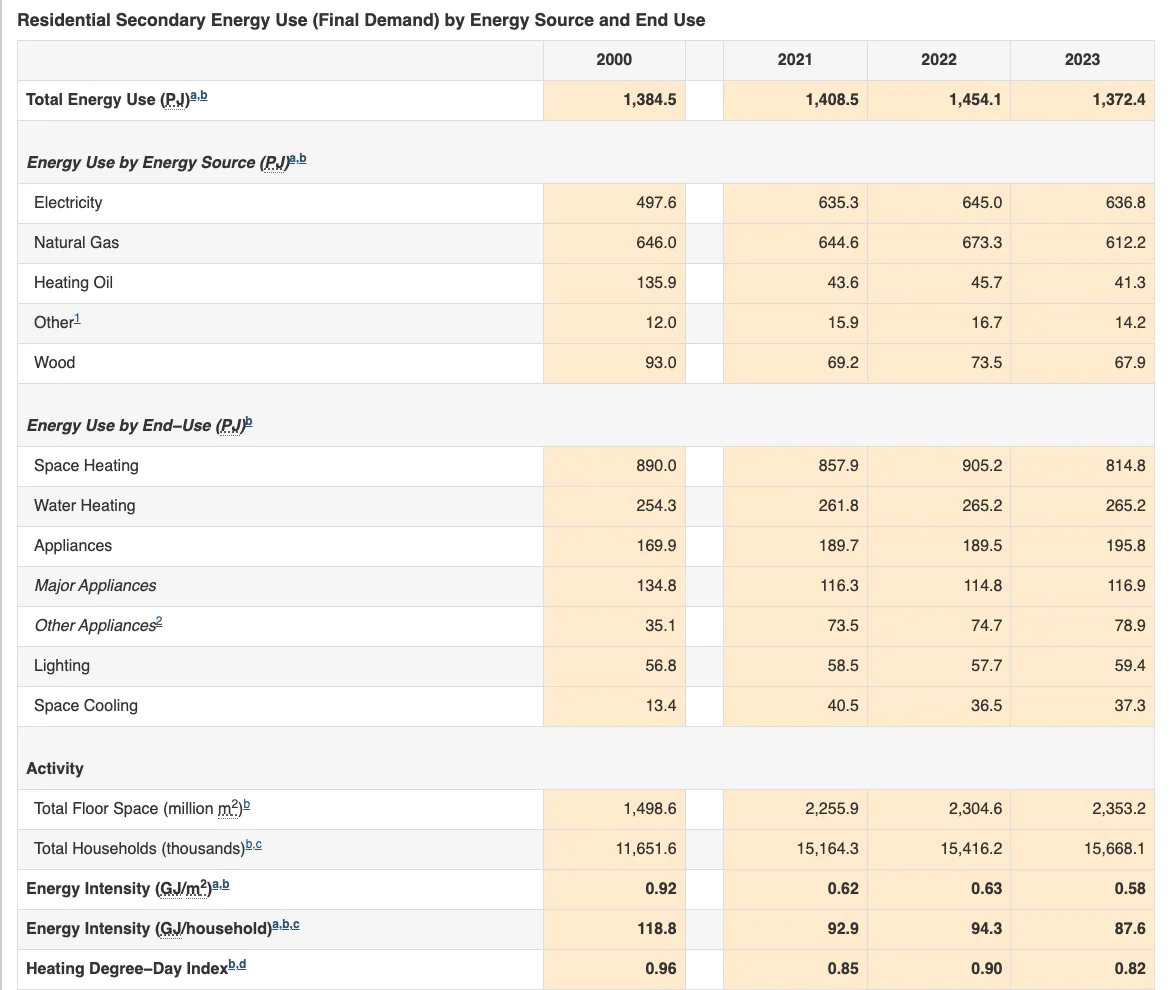
Electricity has passed natural gas in Canadian homes, and heating oil has all but vanished.
- Electricity supplied 636.8 petajoules to Canadian homes in 2023, more than the 612.2 petajoules from natural gas (Natural Resources Canada, Mar 2026).
- Heating oil use fell from 135.9 petajoules in 2000 to 41.3 petajoules in 2023 (Natural Resources Canada, Mar 2026).
- Wood supplied 67.9 petajoules in 2023 (Natural Resources Canada, Mar 2026).
- Energy use per household fell from 118.8 gigajoules in 2000 to 87.6 in 2023 (Natural Resources Canada, Mar 2026).
What does the Canadian household survey add?
The household survey shows the same two-fuel split and a clear regional gap.
- Canadian households used 85.4 gigajoules each in 2021, down from 90.5 in 2019 (Statistics Canada, Mar 2024).
- Natural gas supplied 51.5% of the energy used in Canadian homes in 2021 (Statistics Canada, Mar 2024).
- Electricity supplied 45.8% (Statistics Canada, Mar 2024).
- Heating oil supplied 2.7% (Statistics Canada, Mar 2024).
- Alberta households used 121.8 gigajoules each, well above the national average (Statistics Canada, Mar 2024).
Methodology and Sources
We chose each figure by asking who produced it first and went to that agency, statistics office or research body. We opened every link and took each number from the page or document it cites. We left out roundups, republished lists and any figure we could not trace. Each statistic appears once on this page. Where two sources measure the same thing differently, such as Census Bureau counts and EIA survey counts, we say which source each number comes from and do not mix them. Winter cost figures are EIA forecasts, not actual bills. Some tables are from the 2020 Residential Energy Consumption Survey, the latest with equipment detail. The page is refreshed monthly.
Glossary
- ACS: American Community Survey, the Census Bureau’s yearly household survey.
- CPI: Consumer Price Index, a measure of price change.
- EIA: U.S. Energy Information Administration.
- GJ: gigajoule, a unit of energy.
- HDD: heating degree day, the number of degrees a day’s average temperature is below 65°F.
- NFPA: National Fire Protection Association.
- PJ: petajoule, a unit of energy equal to a million gigajoules.
- RECS: Residential Energy Consumption Survey, run by EIA.
- TJ: terajoule, a unit of energy equal to a thousand gigajoules.
Sources
- EIA press release, EIA expects a mixed picture for winter fuel costs this year
- EIA, 2020 Residential Energy Consumption Survey, Table HC6.1
- EIA, 2020 Residential Energy Consumption Survey, Table HC6.2
- EIA, Short-Term Energy Outlook, October 2026
- EIA, Today in Energy: Winter residential energy expenditures vary by heating fuel
- EIA, Winter Fuels Outlook 2026-27
- Eurostat, Energy consumption in households (Statistics Explained)
- Eurostat, Energy use in EU households drops for 3 years in a row
- IEA, Energy Efficiency 2025, Buildings
- IEA, Renewables 2025, Renewable heat
- NFPA, Home Heating Safety
- NFPA, Home Structure Fires: Supporting Tables, August 2025
- NISRA, Continuous Household Survey Heat and Insulation Results 2024/25
- NOAA NCEI, NOAA Delivers New U.S. Climate Normals
- NOAA, El Nino looms large over U.S. Winter Outlook
- Natural Resources Canada, Residential Secondary Energy Use (Final Demand) by Energy Source and End Use
- Office for National Statistics, Energy efficiency of housing in England and Wales: 2024
- Statistics Canada, Households and the Environment Survey: Energy use, 2021
- Statistics Canada, The price on heat, and how it’s generated
- U.S. Bureau of Labor Statistics, Consumer Price Index, Northeast Region, September 2026
- U.S. Census Bureau, American Community Survey 1-Year 2024, Table B25040 House Heating Fuel
- UK Government, English Housing Survey 2023 to 2024: low carbon technologies in English homes fact sheet