Smart home energy savings statistics show a split that the box does not advertise. The savings that are measured, and large, come from LED bulbs and from meters that show people their own use. The savings that are marketed, such as apps that give advice, are often small or missing.
This page collects dated figures from the U.S. Energy Information Administration, the U.S. Department of Energy and its laboratories, the EPA, the UK government and published research. Every number links to the document that produced it. Thermostats have their own page, so see smart thermostat energy savings for those. This page covers lighting, smart speakers, meters, feedback, always-on loads, demand response and smart irrigation.
Use it to check a claim before you repeat it, or to tell a customer what a connected device has been shown to do. For the energy that heating and cooling use in the first place, read HVAC energy consumption statistics and home energy efficiency statistics. Each stat appears once, and the page is refreshed every month.
Key Takeaways
- Lighting used 244 TWh of electricity in 2020, about 14% of all U.S. electricity use (DOE 2020 Lighting Market Characterization, Apr 2024).
- 90% of U.S. homes used at least one LED bulb in 2024, and 37% used LEDs for all indoor lighting (EIA Today in Energy, Mar 2026).
- Connected lighting controls were on only 0.2% of installed lighting in 2018 (DOE LED Adoption Report, Aug 2020).
- An estimated 47 million U.S. households, or 36%, had at least one smart speaker in 2024 (EIA Today in Energy, Mar 2026).
- U.S. utilities reported 129.8 million residential advanced meters in 2025, 87% of their 149.2 million residential meters (EIA Form EIA-861 meter data, Oct 2026).
- 75% of Great Britain’s homes had a smart electricity meter at the end of June 2026 (DESNZ smart meter statistics, Aug 2026).
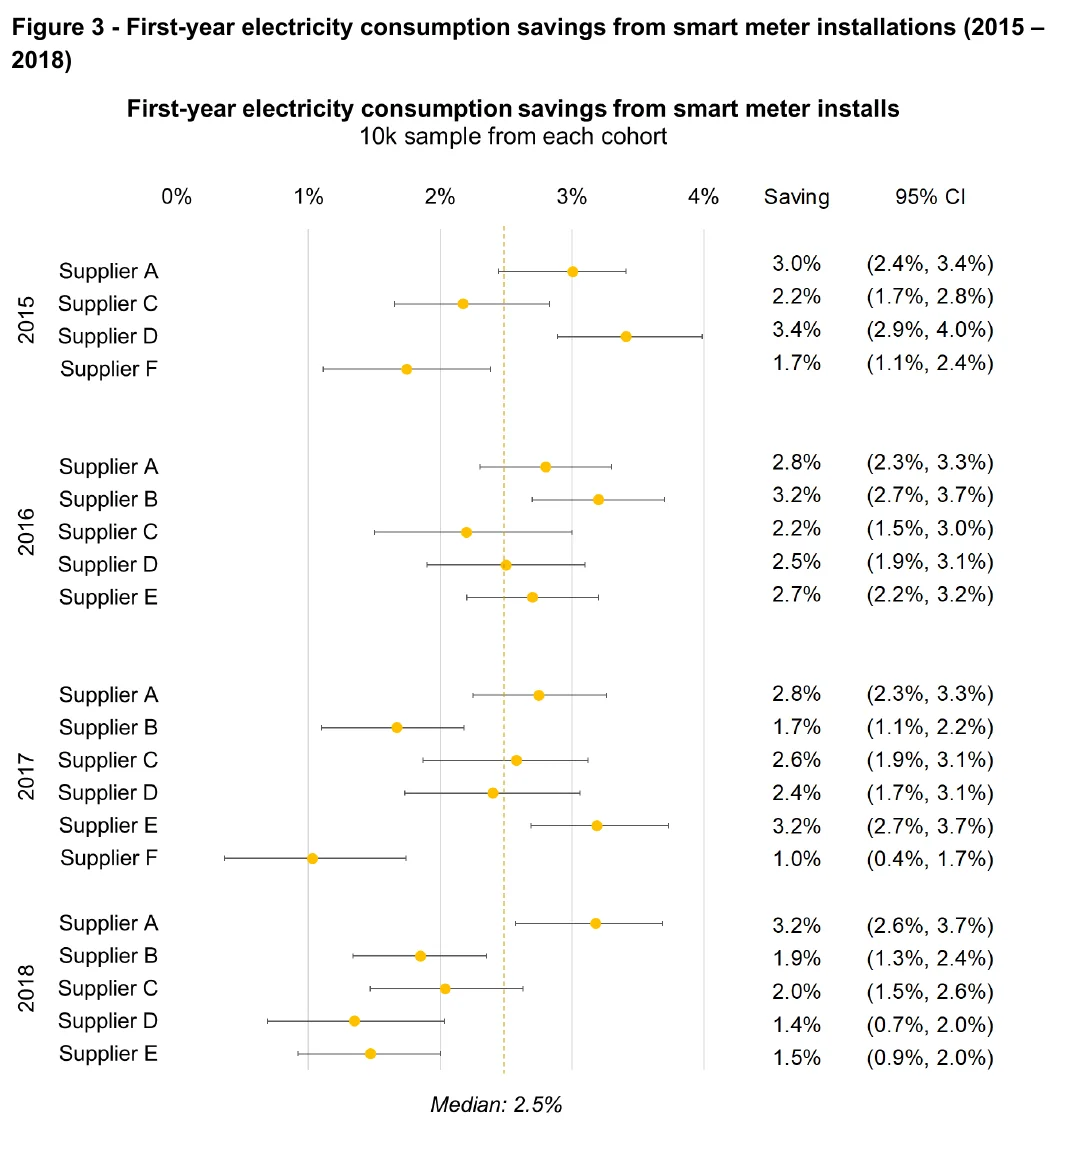
- A smart meter cut household electricity use by a median of 2.5% in the first year, in a UK government study of billing records (DESNZ NEED report, Nov 2024).
- Feedback programs cut household electricity use by 4% to 12% across a multi-continent sample of studies (ACEEE feedback meta-review, Jun 2010).
- A UK trial of an AI energy advice feature found no contribution to energy savings (DESNZ SENS evaluation, Jun 2023).
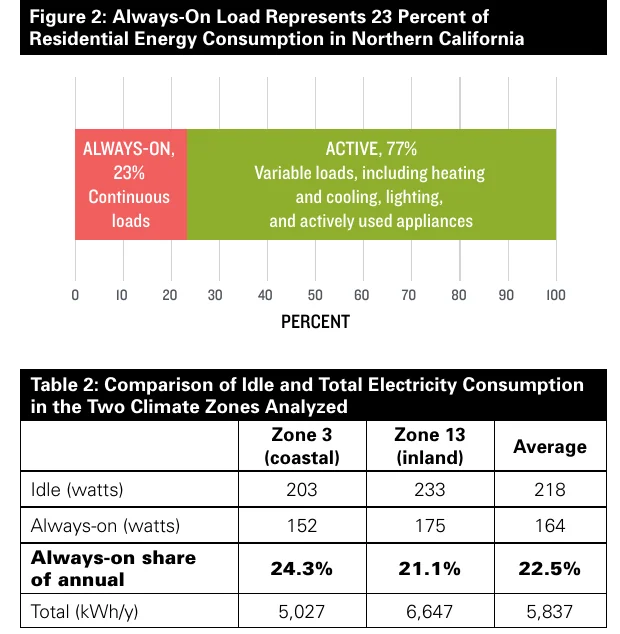
- Always-on devices made up about 23% of household electricity use in a study of 70,000 northern California homes (NRDC Home Idle Load, May 2015).
- Utility demand programs delivered 13,396 MW of actual peak savings in 2025 (EIA Form EIA-861 demand response data, Oct 2026).
- Grid-interactive buildings could be worth $100 billion to $200 billion in U.S. power system savings from 2021 to 2040 (LBNL GEB Roadmap, May 2021).
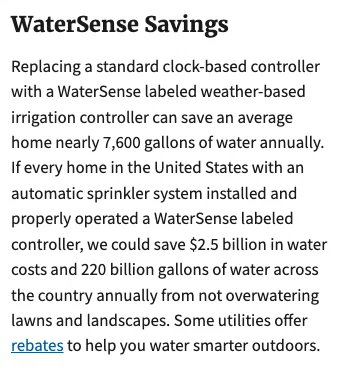
- A WaterSense weather-based irrigation controller saves an average home nearly 7,600 gallons of water a year (EPA WaterSense irrigation controllers, Mar 2026).
Smart home statistics: how many US homes use connected devices?
The federal survey asks about few connected devices, and the one this section follows is the smart speaker. It sits in a large minority of homes, and in many of them it controls nothing. Where it does control something, lighting leads.
What does the federal survey count?
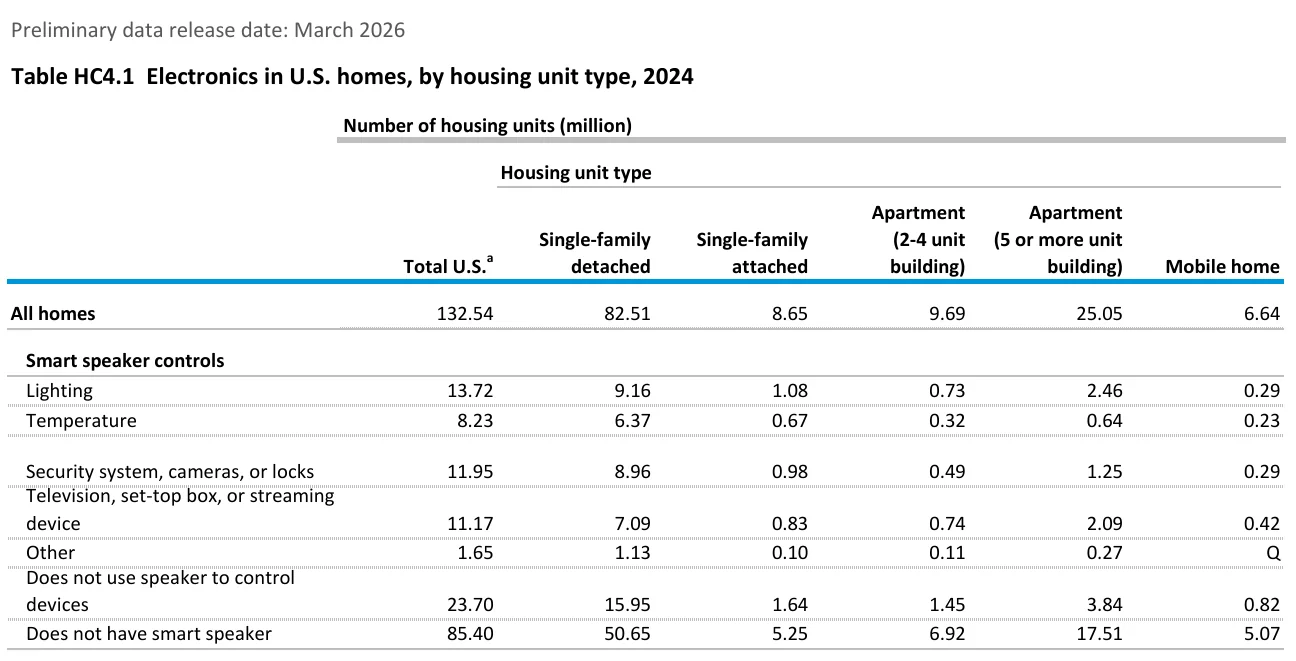
The 2024 Residential Energy Consumption Survey covered 132.54 million occupied U.S. homes and asked how many smart speakers each one has (EIA RECS 2024 Table HC4.1, Mar 2026).
- 22.66 million homes had one smart speaker (EIA RECS 2024 Table HC4.1, Mar 2026).
- 11.17 million homes had two (EIA RECS 2024 Table HC4.1, Mar 2026).
- 13.31 million homes had three or more (EIA RECS 2024 Table HC4.1, Mar 2026).
- 127.33 million homes had internet access, which every connected device needs, and 5.21 million did not (EIA RECS 2024 Table HC4.1, Mar 2026).
- 26.05 million homes used three or more internet streaming devices (EIA RECS 2024 Table HC4.1, Mar 2026).
What do smart speakers control?
13.72 million homes use a smart speaker to control lighting, the one use that touches energy directly (EIA RECS 2024 Table HC4.1, Mar 2026).
- 11.95 million homes use a speaker to control a security system, cameras or locks (EIA RECS 2024 Table HC4.1, Mar 2026).
- 8.23 million homes use one to control temperature (EIA RECS 2024 Table HC4.1, Mar 2026).
- 23.70 million homes with a speaker do not use it to control any device, which is about half of the homes that have one (EIA RECS 2024 Table HC4.1, Mar 2026).
Where do the lighting controllers live?
9.16 million of the homes that use a speaker for lighting are single-family detached houses (EIA RECS 2024 Table HC4.1, Mar 2026).
- 2.46 million are in apartment buildings with five or more units (EIA RECS 2024 Table HC4.1, Mar 2026).
- 0.29 million are mobile homes (EIA RECS 2024 Table HC4.1, Mar 2026).
Do LEDs and smart lighting cut home energy use?
LEDs did the saving. Smart controls on top of them have barely started, and the data say that plainly.
How much electricity does home lighting use?
Homes used 76 TWh of electricity for lighting in 2020, only 31% of the national lighting total, because home lights run so few hours (DOE 2020 Lighting Market Characterization, Apr 2024).
- Commercial buildings used 168 TWh for lighting (DOE 2020 Lighting Market Characterization, Apr 2024).
- Homes held 6.5 billion installed lamps and fixtures, 80% of all installations (DOE 2020 Lighting Market Characterization, Apr 2024).
- The average installed unit in a home drew about 22 W, against 27 W in commercial buildings (DOE 2020 Lighting Market Characterization, Apr 2024).
- Home lights ran 1.6 hours a day on average, against 10.1 hours in commercial buildings (DOE 2020 Lighting Market Characterization, Apr 2024).
- An earlier DOE report put 2018 residential lighting at about 91 TWh, or 10% of residential electricity from major loads, using a different method (DOE GEB Lighting and Electronics report, Dec 2019).
How fast did LED take over?
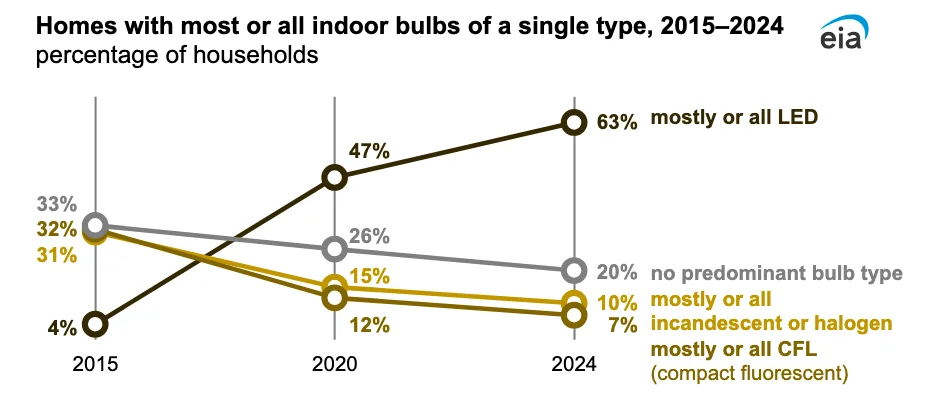
The share of homes using mostly LED bulbs rose from 4% in 2015 to 63% in 2024 (EIA Today in Energy, Mar 2026).
- The share using mostly CFL bulbs fell from 32% to 7% over the same years (EIA Today in Energy, Mar 2026).
- The share using mostly incandescent or halogen bulbs fell from 31% to 10% (EIA Today in Energy, Mar 2026).
- Across homes and commercial buildings, LEDs were 1% of installed units in 2010, 8% in 2015 and about 48% in 2020 (DOE 2020 Lighting Market Characterization, Apr 2024).
- LED products reached 2,325 million installed units, 30.0% of general lighting, in 2018 (DOE LED Adoption Report, Aug 2020).
- LED adoption saved 1.3 quads of energy in 2018, worth $14.7 billion to consumers and about 5% of building electricity use (DOE LED Adoption Report, Aug 2020).
Who is still on old bulbs?
67.80 million homes still used at least one incandescent or halogen bulb indoors in 2024 (EIA RECS 2024 Table HC5.1, Mar 2026).
- 7.03 million homes used only incandescent or halogen bulbs indoors (EIA RECS 2024 Table HC5.1, Mar 2026).
- 59.35 million homes used at least one CFL bulb (EIA RECS 2024 Table HC5.1, Mar 2026).
- 13.65 million homes used no LED bulb indoors (EIA RECS 2024 Table HC5.1, Mar 2026).
- 7.35 million of 43.00 million renter homes had no LED bulb, against 6.29 million of 89.54 million owner-occupied homes (EIA RECS 2024 Table HC5.2, Mar 2026).
- 57% of apartments and 56% of mobile homes used mostly or all LED indoors, against 65% of detached houses and 63% of attached houses (EIA Today in Energy, Mar 2026).
- 71% of homes built from 2020 to 2024 used mostly or all LED, and 51% used all LED (EIA Today in Energy, Mar 2026).
- Of an estimated 58 million homes with outdoor lights left on all night, 77% used at least one LED (EIA Today in Energy, Mar 2026).
- 1.89 million homes left 10 or more outdoor bulbs on all night (EIA RECS 2024 Table HC5.1, Mar 2026).
Does connected lighting add savings?
Only 11% of residential lighting installations had any kind of control in 2020 (DOE 2020 Lighting Market Characterization, Apr 2024).
- 9% of residential installations used a dimmer (DOE 2020 Lighting Market Characterization, Apr 2024).
- Controls saved an estimated 586 GWh a year in homes, against 5,601 GWh in commercial buildings (DOE 2020 Lighting Market Characterization, Apr 2024).
- Fully implemented connected controls could save a further 1.1 quads a year, and the full potential of efficient connected LEDs is over 5 quads, about 20% of 2018 building electricity use (DOE LED Adoption Report, Aug 2020).
- DOE cited a forecast that connected lighting would reach 12% of residential lighting by 2035 (DOE GEB Lighting and Electronics report, Dec 2019).
How many homes have a smart meter?
Most U.S. homes already have one, which makes the meter the largest smart device in any house. The open question is no longer whether the meter is installed but whether anyone looks at the data.
How many U.S. electric meters are advanced meters?
U.S. utilities reported 148.2 million advanced meters (AMI) across all customer types for 2025, summing the state files (EIA Form EIA-861 meter data, Oct 2026).
- 13.9 million residential meters were still older one-way automated meter reading (AMR) meters (EIA Form EIA-861 meter data, Oct 2026).
- 5.5 million residential meters were standard meters with neither AMR nor AMI (EIA Form EIA-861 meter data, Oct 2026).
- 65.1 million residential customers had daily digital access to their usage data (EIA Form EIA-861 meter data, Oct 2026).
- 12.4 million residential meters could connect to a home area network, which lets a display or device read the meter (EIA Form EIA-861 meter data, Oct 2026).
- Advanced meters served 3.11 billion MWh of energy across all customer types in 2025 (EIA Form EIA-861 meter data, Oct 2026).
- Three years earlier, utilities had about 119 million AMI installations, 72% of all electric meters, in 2022 (EIA FAQ on smart meters, Oct 2023).
How far has Great Britain got?
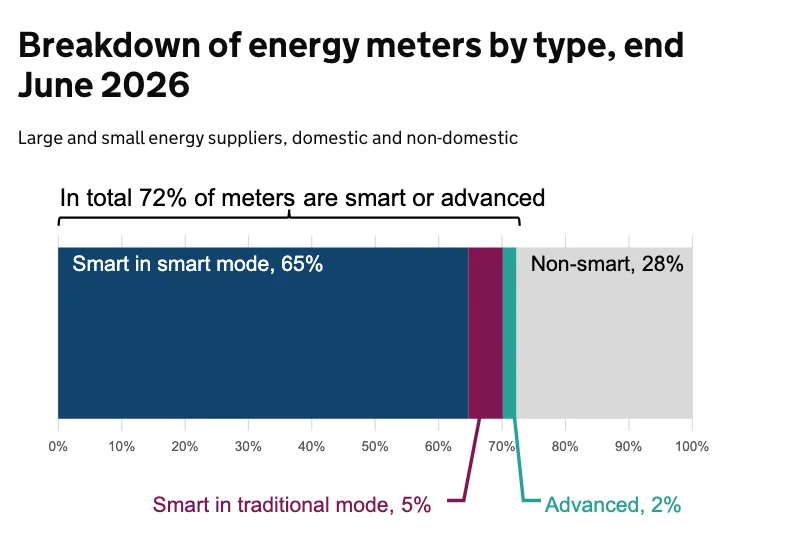
At the end of June 2026 Great Britain had 42 million smart and advanced meters in homes and small businesses (DESNZ smart meter statistics, Aug 2026).
- 92% of the 40 million smart meters were working in smart mode, which means they report to the supplier remotely (DESNZ smart meter statistics, Aug 2026).
- 57% of homes had a smart gas meter, and 18% had no gas meter at all (DESNZ smart meter statistics, Aug 2026).
- Large suppliers installed 1.067 million meters in homes in the second quarter of 2026 (DESNZ smart meter statistics, Aug 2026).
- Replacements made up 53% of those home installs, up from 14% in the first quarter of 2022 (DESNZ smart meter statistics, Aug 2026).
- 3.3% of the 15 million non-smart home meters were swapped for smart ones in the quarter (DESNZ smart meter statistics, Aug 2026).
- 1.5% of the 39 million smart home meters were themselves replaced (DESNZ smart meter statistics, Aug 2026).
Do surveys agree with meter counts?
In England, 60% of households, around 15 million, reported an electricity smart meter in 2024-25, up from 56% the year before (English Housing Survey 2024-25, Jan 2026).
- Owner occupiers (63%) and social renters (58%) were more likely to report one than private renters (50%) (English Housing Survey 2024-25, Jan 2026).
- The government’s own count showed 68% of domestic properties with an electric smart meter at 30 September 2024, and the report puts the gap down to timing and self-reporting (English Housing Survey 2024-25, Jan 2026).
How much do smart meters and energy feedback save?
A smart meter saves a few percent, not a quarter of the bill. The evidence is strong because it comes from millions of homes and from government evaluators, not from vendors.
What do the government’s billing records show?
In government billing records every electricity and gas cohort saved energy in the first year, and gas savings ran from 1.0% to 2.8% with a median of 2.0% (DESNZ NEED report, Nov 2024).
- Savings held up: the lowest third-year electricity saving was 2.4% and the highest was 2.9% (DESNZ NEED report, Nov 2024).
- Gas savings faded for some cohorts, with third-year results of 0.9% to 2.2% (DESNZ NEED report, Nov 2024).
- The study covered 1.7 million electricity and 1.5 million gas installations, about a quarter of all installs in 2015 to 2018, using a sample of 10,000 homes per cohort (DESNZ NEED report, Nov 2024).
- The government had planned for 3.0% electricity savings, 2.2% for gas customers who pay by credit and 0.5% for gas prepay customers (DESNZ NEED report, Nov 2024).
What did earlier studies find?
The early learning project found smart-type meters cut domestic electricity use by 2.3% and gas use by 1.5% on average (DESNZ NEED report, Nov 2024).
- An independent review of supplier studies pooled seven analyses and found a 3.43% cut in electricity use and a 2.97% cut in gas use (Behavioural Insights Team for DESNZ, Jun 2023).
- The three suppliers outside the best performer found electricity cuts of 1.12% to 1.86% (Behavioural Insights Team for DESNZ, Jun 2023).
- The reviewers kept 7 of 14 analyses from 4 of 7 suppliers because the rest did not meet their quality bar (Behavioural Insights Team for DESNZ, Jun 2023).
What does older feedback research say?
A meta-review of feedback studies found the median saving was 14% for real-time plus feedback and 11% for daily or weekly feedback (ACEEE feedback meta-review, Jun 2010).
- Estimated and real-time feedback saved about 7%, and enhanced billing saved 5.5% on average (ACEEE feedback meta-review, Jun 2010).
- Once participation rates are counted, ACEEE put real-time plus programs at about 6% savings, real-time at about 4% and enhanced billing at about 2% (ACEEE feedback meta-review, Jun 2010).
- National savings could run from 0.4% to more than 6% of residential electricity, and a broad program could reach 100 billion kWh a year by 2030 (ACEEE feedback meta-review, Jun 2010).
- U.S. programs in the 1995 to 2010 era averaged 7.4% savings, 3 points below the European average of 10.5% (ACEEE feedback meta-review, Jun 2010).
- Home energy reports mailed to more than six million households kept most of their effect after the mailings stopped, decaying at 10% to 20% a year (Allcott and Rogers, American Economic Review, Oct 2014).
Do apps and advice add more?
A UK trial of a gamified energy app cut daily gas use by 4.6% for the people who used it, with a margin of 2.0 points (DESNZ SENS evaluation, Jun 2023).
- The competition behind it committed up to £6.25 million to trials of products that use smart meter data (DESNZ SENS evaluation, Jun 2023).
- A heating coaching trial could not show whether it saved energy, and a local energy market trial did not show lower electricity use (DESNZ SENS evaluation, Jun 2023).
- In Winter 2025, 43% of UK adults said a smart meter in-home display was how they monitored energy use, ahead of energy bills (33%), a supplier app (22%) and a supplier website (16%) (DESNZ Public Attitudes Tracker, Mar 2026).
- 96% of people said they paid at least some attention to how much heat they used, and 70% of those who paid a lot or a fair amount of attention said the reason was to minimise spending (DESNZ Public Attitudes Tracker, Mar 2026).
How big is the bill that these percentages apply to?
The average U.S. residential customer used 874 kWh a month in 2025 and paid $150.68 a month (EIA Form EIA-861 average bill data, Oct 2026).
- The national average residential price was 17.23 cents per kWh across 144.8 million customers (EIA Form EIA-861 average bill data, Oct 2026).
- Hawaii paid 40.40 cents per kWh, Connecticut 29.31 cents and Idaho 11.83 cents (EIA Form EIA-861 average bill data, Oct 2026).
Can connected homes cut peak demand?
The grid does not care how many kWh a home saves at 3 a.m. It cares about the hour when everyone runs cooling at once, and that is where connected homes can do the most.
Peak load is a sizing problem as much as a controls problem. A home with a right-sized cooling load puts less on the grid on a hot afternoon, and you can estimate that load with the free BTU calculator.
How many homes already take part in demand programs?
11.49 million residential customers were enrolled in utility demand response programs in 2025, summing the state files (EIA Form EIA-861 demand response data, Oct 2026).
- Programs reported potential peak savings of 31,960 MW across all customer types (EIA Form EIA-861 demand response data, Oct 2026).
- Residential programs delivered 4,977 MW of that actual peak saving (EIA Form EIA-861 demand response data, Oct 2026).
- 5.85 million residential customers were on direct load control, where the utility can switch a device (EIA Form EIA-861 meter data, Oct 2026).
- Utilities paid $1.35 billion in customer incentives for these programs (EIA Form EIA-861 demand response data, Oct 2026).
- The programs also saved 462,592 MWh of energy (EIA Form EIA-861 demand response data, Oct 2026).
How many homes face time-based prices?
18.4 million residential customers were enrolled in dynamic pricing programs in 2025 (EIA Form EIA-861 dynamic pricing data, Oct 2026).
- 393 utility entries reported a residential time-of-use program (EIA Form EIA-861 dynamic pricing data, Oct 2026).
- 91% of UK adults had heard of time-of-use tariffs in Winter 2025, and 41% said they knew a lot or a fair amount about them (DESNZ Public Attitudes Tracker, Mar 2026).
- 51% said they were very or fairly likely to switch to one, 18% were very likely, and 11% were already on one (DESNZ Public Attitudes Tracker, Mar 2026).
- 91% were aware of smart charging for electric vehicles (DESNZ Public Attitudes Tracker, Mar 2026).
Why do people refuse time-based prices?
Among the 24% unlikely to switch, 37% did not want to think about when to use electricity (DESNZ Public Attitudes Tracker, Mar 2026).
- 36% said off-peak use would not suit them, a new answer option in Winter 2025 (DESNZ Public Attitudes Tracker, Mar 2026).
- 26% said it would not save enough money, down from 35% a year earlier, and 14% had no smart meter (DESNZ Public Attitudes Tracker, Mar 2026).
How big could grid-interactive homes become?
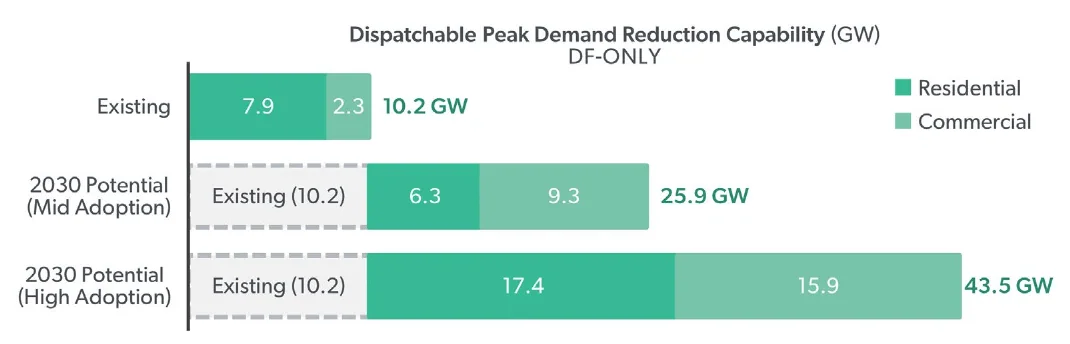
DOE’s national laboratories found that U.S. buildings already hold about 10.2 GW of dispatchable peak reduction, 7.9 GW of it residential (LBNL GEB Roadmap, May 2021).
- A mid adoption case adds 15.6 GW by 2030, 6.3 GW from homes, for a total of 25.9 GW (LBNL GEB Roadmap, May 2021).
- A high adoption case reaches 43.5 GW, 17.4 GW of it residential (LBNL GEB Roadmap, May 2021).
- Power system benefits could reach $8 billion to $18 billion a year by 2030, or 2% to 6% of projected generation and transmission costs (LBNL GEB Roadmap, May 2021).
- Annual carbon dioxide cuts could reach 80 million tons by 2030, about 6% of power sector emissions (LBNL GEB Roadmap, May 2021).
- Buildings use more than 70% of U.S. electricity (LBNL GEB Roadmap, May 2021).
- The mid case would lift total annual energy savings from 221 TWh in 2019 to 505 TWh by 2030 (LBNL GEB Roadmap, May 2021).
How much power do always-on devices waste?
Always-on load is the smart home’s hidden cost. A house full of connected gear draws power all day, and the best measurement we have comes from smart meters.
How much of a home’s electricity never switches off?
The study found 65 plugged-in or connected devices per home on average (NRDC Home Idle Load, May 2015).
- The average home drew 218 W of idle load and 164 W of always-on load (NRDC Home Idle Load, May 2015).
- The always-on share was 24.3% in the coastal zone and 21.1% in the inland zone (NRDC Home Idle Load, May 2015).
- The largest data set held smart meter readings for 70,000 homes (NRDC Home Idle Load, May 2015).
- Earlier estimates had put the always-on share at 10% a decade or more ago and 20% in 2010 (NRDC Home Idle Load, May 2015).
What does it cost?
Always-on loads add about 1,300 kWh a year to a household’s electricity use (NRDC Home Idle Load, May 2015).
- At the average national rate that is $165 a year per household, and as much as $440 at a top utility tier rate (NRDC Home Idle Load, May 2015).
- Across the country NRDC put the cost at $19 billion a year, equal to the output of 50 large power plants (NRDC Home Idle Load, May 2015).
- Each continuous watt cost $1.30 to $2.60 a year on northern California utility rates (NRDC Home Idle Load, May 2015).
- U.S. homes used 1,375 billion kWh in total (NRDC Home Idle Load, May 2015).
How much could be saved?
If every U.S. home cut its idle load by 42% to 80 W per 1,000 square feet, the country would save 64 billion kWh a year (NRDC Home Idle Load, May 2015).
- That would save $8 billion a year in electricity bills (NRDC Home Idle Load, May 2015).
- It would avoid 44 million metric tons of carbon dioxide, 4.6% of U.S. residential sector emissions from electricity generation (NRDC Home Idle Load, May 2015).
- It equals the output of 21 large coal-fired power plants (NRDC Home Idle Load, May 2015).
- Consumer electronics and IT gear used about 88 TWh in homes in 2018, 10% of residential electricity from major loads (DOE GEB Lighting and Electronics report, Dec 2019).
Do smart irrigation controllers save water?
Smart irrigation is the cleanest smart-device case in the federal record, because the savings are counted in gallons and the baseline is a dumb timer.
How many homes could use one?
EPA estimates that more than 28 million U.S. homes have in-ground sprinkler systems that typically run on a clock-based controller (EPA WaterSense irrigation controllers, Mar 2026).
- Outdoor use is more than 30% of household water use on average and can reach 60% in arid regions (EPA WaterSense statistics and facts, Mar 2026).
- As much as 50% of outdoor water is lost to wind, evaporation and runoff from inefficient irrigation (EPA WaterSense statistics and facts, Mar 2026).
- A poorly maintained automatic system can waste up to 25,000 gallons a year (EPA WaterSense statistics and facts, Mar 2026).
What does a weather-based controller save?
A WaterSense controller can save an average home up to 15,000 gallons of water a year (EPA WaterSense statistics and facts, Mar 2026).
- Universal use could save $2.5 billion in water costs and 220 billion gallons nationwide each year (EPA WaterSense irrigation controllers, Mar 2026).
- A WaterSense controller can cut an average home’s irrigation use by up to 30% (EPA WaterSense statistics and facts, Mar 2026).
- A well-managed system can cut a household’s irrigation use by 15% (EPA WaterSense statistics and facts, Mar 2026).
What do leaks add?
The average household’s leaks waste more than 9,300 gallons of water a year (EPA Fix a Leak Week, Mar 2026).
- Nine percent of homes have leaks that waste 50 gallons or more a day (EPA Fix a Leak Week, Mar 2026).
- Household leaks waste nearly 1 trillion gallons nationwide each year (EPA Fix a Leak Week, Mar 2026).
- A sprinkler leak 1/32 of an inch wide can waste about 6,300 gallons a month (EPA Fix a Leak Week, Mar 2026).
Methodology and Sources
Every figure comes from the agency, laboratory, regulator or research body that produced it, and each link points to the report, table or release itself, not to a roundup. We opened every URL and checked the number on the page. Where a source gives only a table, such as the EIA Form EIA-861 detail files, we added up the utility rows ourselves for the national totals marked “summing the state files”, and EIA does not print those totals. The 2024 RECS tables are preliminary. The NRDC idle load study and the ACEEE meta-review are older and are used because no newer measurement of the same thing exists in the public record. The NRDC study covers northern California only. UK figures describe Great Britain or England and are labeled as such. Retail research firms and vendor claims are excluded. The page is refreshed monthly, and the stat inventory file records where each figure came from.
Glossary
- AMI: advanced metering infrastructure, meters that record use at least hourly and report to both the utility and the customer.
- AMR: automated meter reading, an older one-way meter read by a truck or a radio.
- DESNZ: the UK Department for Energy Security and Net Zero.
- DOE: the U.S. Department of Energy.
- EIA: the U.S. Energy Information Administration.
- GEB: grid-interactive efficient building, a building that is efficient and can shift its load for the grid.
- LBNL: Lawrence Berkeley National Laboratory.
- LED, CFL: light-emitting diode and compact fluorescent lamp.
- MW, GW, kWh, MWh, GWh, TWh: units of power and energy, from megawatt to terawatt-hour.
- NEED: the UK National Energy Efficiency Data-Framework, a government billing and property database.
- Quad: one quadrillion British thermal units.
- RECS: the EIA Residential Energy Consumption Survey.
- Time-of-use tariff: a price plan with cheaper off-peak rates and higher peak rates.
Sources
- Allcott and Rogers, The Short-Run and Long-Run Effects of Behavioral Interventions (American Economic Review)
- Behavioural Insights Team for DESNZ, Reviewing energy supplier evidence on impacts of smart metering
- DESNZ, DESNZ Public Attitudes Tracker: Energy bills and tariffs, Winter 2025
- DESNZ, Monitoring smart meter energy savings using NEED
- DESNZ, Smart Energy Savings Competition (SENS) overall impact evaluation
- DESNZ, Smart meters in Great Britain, quarterly update June 2026
- EIA, Form EIA-861 detailed data files, 2025 final data
- EIA, How many smart meters are installed in the United States
- EIA, 2024 RECS Table HC4.1, Electronics in U.S. homes
- EIA, 2024 RECS Table HC5.1, Lighting in U.S. homes, by housing unit type
- EIA, 2024 RECS Table HC5.2, Lighting in U.S. homes, by owner or renter status
- EIA, Today in Energy: More U.S. homes used LEDs over other bulb types for indoor lighting in 2024
- English Housing Survey 2024-25, headline report on housing quality and energy efficiency
- EPA, WaterSense Fix a Leak Week
- EPA, WaterSense Statistics and Facts
- EPA, WaterSense Weather-Based Irrigation Controllers
- Ehrhardt-Martinez, Donnelly and Laitner, Advanced Metering Initiatives and Residential Feedback Programs (ACEEE)
- LBNL for DOE, A National Roadmap for Grid-Interactive Efficient Buildings
- NRDC, Home Idle Load: Devices Wasting Huge Amounts of Electricity When Not in Active Use
- U.S. DOE, Adoption of Light-Emitting Diodes in Common Lighting Applications
- U.S. DOE, Grid-interactive Efficient Buildings Technical Report: Lighting and Electronics
- U.S. DOE, 2020 U.S. Lighting Market Characterization