Geothermal energy statistics tell two different stories. In the power sector, geothermal is a small, steady source that supplies a few countries and a sliver of the rest. In buildings, ground-source heat pumps and district heating networks carry most of the world’s geothermal heat, and that market is growing on a different set of rules.
This page collects the primary figures behind both stories: government agencies, national laboratories, regulators, trade bodies and the companies that build the plants. Every number is dated and linked to the document that published it. Where two sources disagree, both are shown with their dates. Updated October 2026.
If you size heating and cooling systems for a living, the sections on installed cost, efficiency and sizing matter most. If you follow energy policy, start with capacity, country shares and the next-generation projects.
Key Takeaways
- Indonesia now leads the world in geothermal power capacity at 2,744 MW, just ahead of the United States at 2,725 MW (IRENA, Mar 2026).
- World geothermal power capacity reached 15,674 MW in 2025, up from 12,169 MW in 2016 (IRENA, Mar 2026).
- Geothermal plants generated 97.7 TWh of electricity in 2024 (IRENA, Jul 2026).
- The world’s geothermal fleet ran above a 75% utilisation rate in 2023, against under 30% for wind and under 15% for solar PV (IEA, Dec 2024).
- Geothermal supplied 39.51% of Kenya’s electricity in the year to June 2025 (Kenya EPRA, Jun 2025).
- U.S. geothermal plants made 16 billion kWh in 2025, about 0.4% of utility-scale generation, and California supplied 68.6% of it (EIA, Feb 2026).
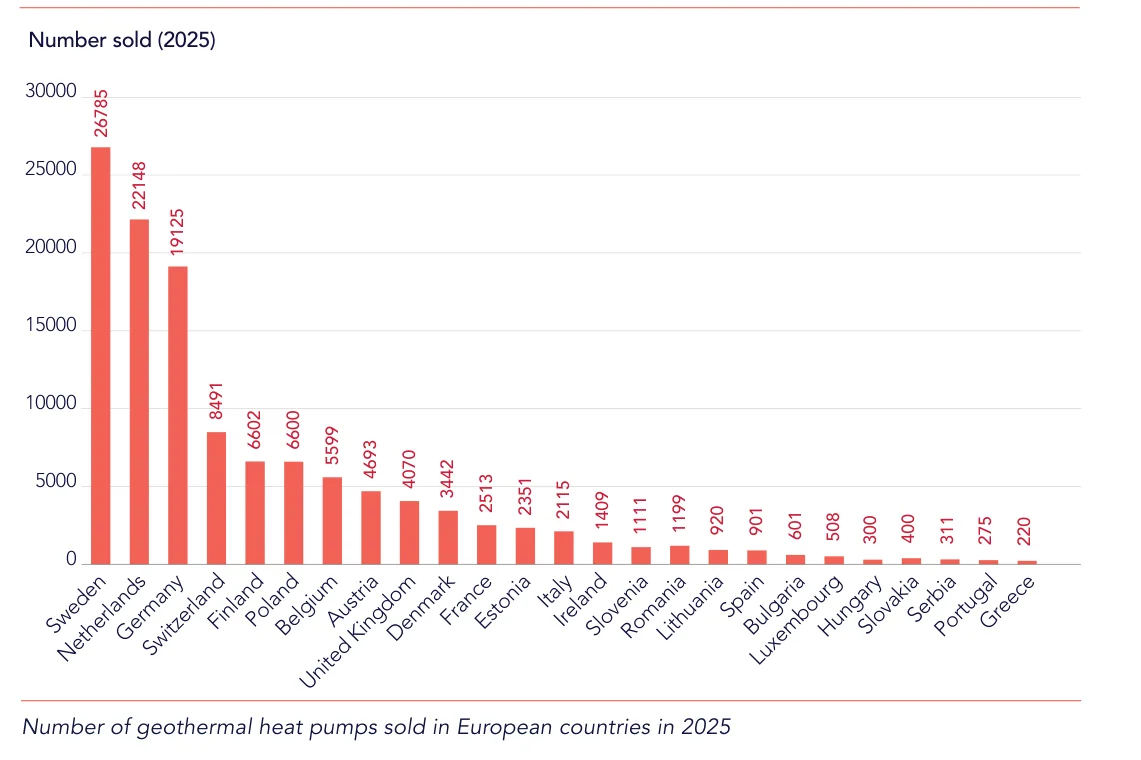
- About 123,000 ground-source heat pumps were sold in the EU in 2025, up 10% on 2024 (EGEC, Jul 2026).
- An estimated 6.46 million ground-source heat pump units were installed worldwide at the end of 2019 (Lund and Toth, Apr 2021).
- Only 1% of U.S. homes heat with a ground-source heat pump, against 13% with an air-source heat pump (DOE Liftoff Heating and Cooling, Jan 2025).
- The median U.S. residential ground-source system cost $11,100 per ton before the tax credit and $7,800 after it (DOE Liftoff Heating and Cooling, Jan 2025).
- The 25D residential clean energy credit is not allowed for expenditures made after December 31, 2025 (IRS, Aug 2025).
- Fervo Energy reported First Power at Cape Station in Utah on September 24, 2026, which it called a first for a utility-scale enhanced geothermal development (Fervo Energy, Sep 2026).
- The IEA says next-generation geothermal costs could fall 80% by 2035, to about USD 50 per megawatt-hour (IEA, Dec 2024).
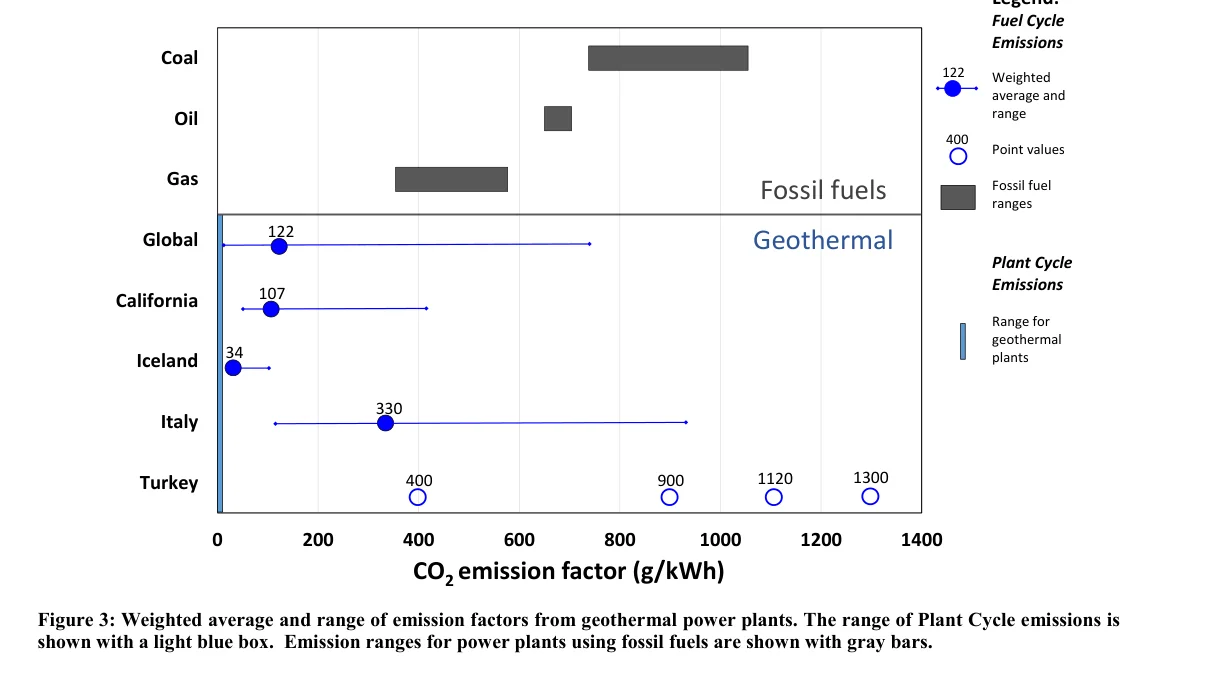
- The weighted average CO2 factor for geothermal plants is 122 g/kWh, against about 450 g/kWh for natural gas power (World Bank, Feb 2017).
Global Capacity and Output
Geothermal is a small source with a big capacity factor. It will not top any renewable chart by volume, but it runs close to flat out all year, and that changes how much a gigawatt is worth.
How much geothermal capacity did the world add in 2025?
The world added 0.3 GW of geothermal capacity in 2025, led by the Philippines and Indonesia at 0.1 GW each, followed by Germany, Türkiye and Japan (IRENA, Mar 2026).
- IRENA’s July 2026 update put geothermal at 15.6 GW, about 0.3% of all renewable capacity (IRENA, Jul 2026).
- Capacity grew almost 40% over the decade to 2023, to nearly 15 GW (IEA, Dec 2024).
- Annual additions swung from under 200 MW to 800 MW over the past decade, because a few large projects set the pace (IEA, Dec 2024).
- National geothermal goals add up to 19 GW, a 30% rise on current capacity (IEA, Dec 2024).
- Under current policies the IEA expects 22 GW in 2030 and almost 60 GW in 2050 (IEA, Dec 2024).
How much electricity does geothermal make?
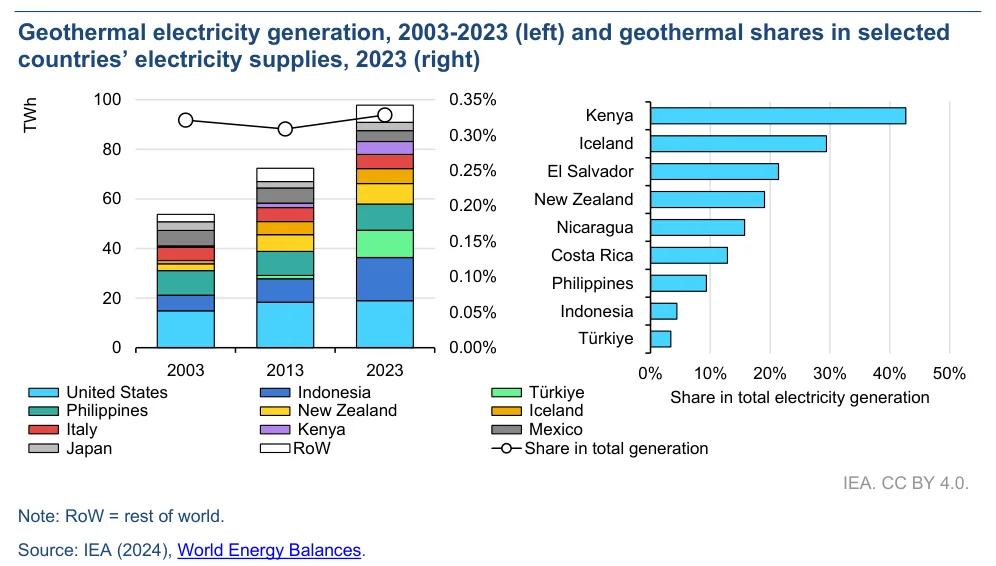
Geothermal generation was just below 100 TWh in 2023, which is 0.3% of global electricity and just above 1% of renewable electricity (IEA, Dec 2024).
- The United States, Indonesia, Türkiye, the Philippines and New Zealand made two-thirds of 2023 output, and Iceland, Italy, Kenya, Mexico and Japan made another 25% (IEA, Dec 2024).
- Geothermal supplies more than 10% of electricity in Kenya, Iceland, El Salvador, New Zealand, Nicaragua and Costa Rica (IEA, Dec 2024).
- Geothermal made 6.8% of Oceania’s renewable electricity in 2024 and 0.7% of Europe’s (IRENA, Jul 2026).
- Including heat, geothermal energy use reached 5 exajoules in 2023, almost 0.8% of global energy demand (IEA, Dec 2024).
- Use is concentrated in a few countries with easy access to high-quality resources, the IEA notes (IEA, Dec 2024).
How steady is geothermal output?
A typical geothermal plant makes five to six times more energy than a solar PV plant of the same installed capacity (IEA, Dec 2024).
- The global geothermal fleet averaged a 75% to 80% capacity factor over the last decade (IEA, Dec 2024).
- National averages passed 90% in some years in New Zealand, Iceland, Italy and Ethiopia (IEA, Dec 2024).
- Coal and gas fleets average about 60% and 50% utilisation, because many plants follow demand (IEA, Dec 2024).
Country Leaders and Dependence
Size and dependence are two different rankings. The countries with the most megawatts are not the ones that lean on geothermal the hardest, and the gap shows where the technology has real system value.
Which countries have the most geothermal capacity?
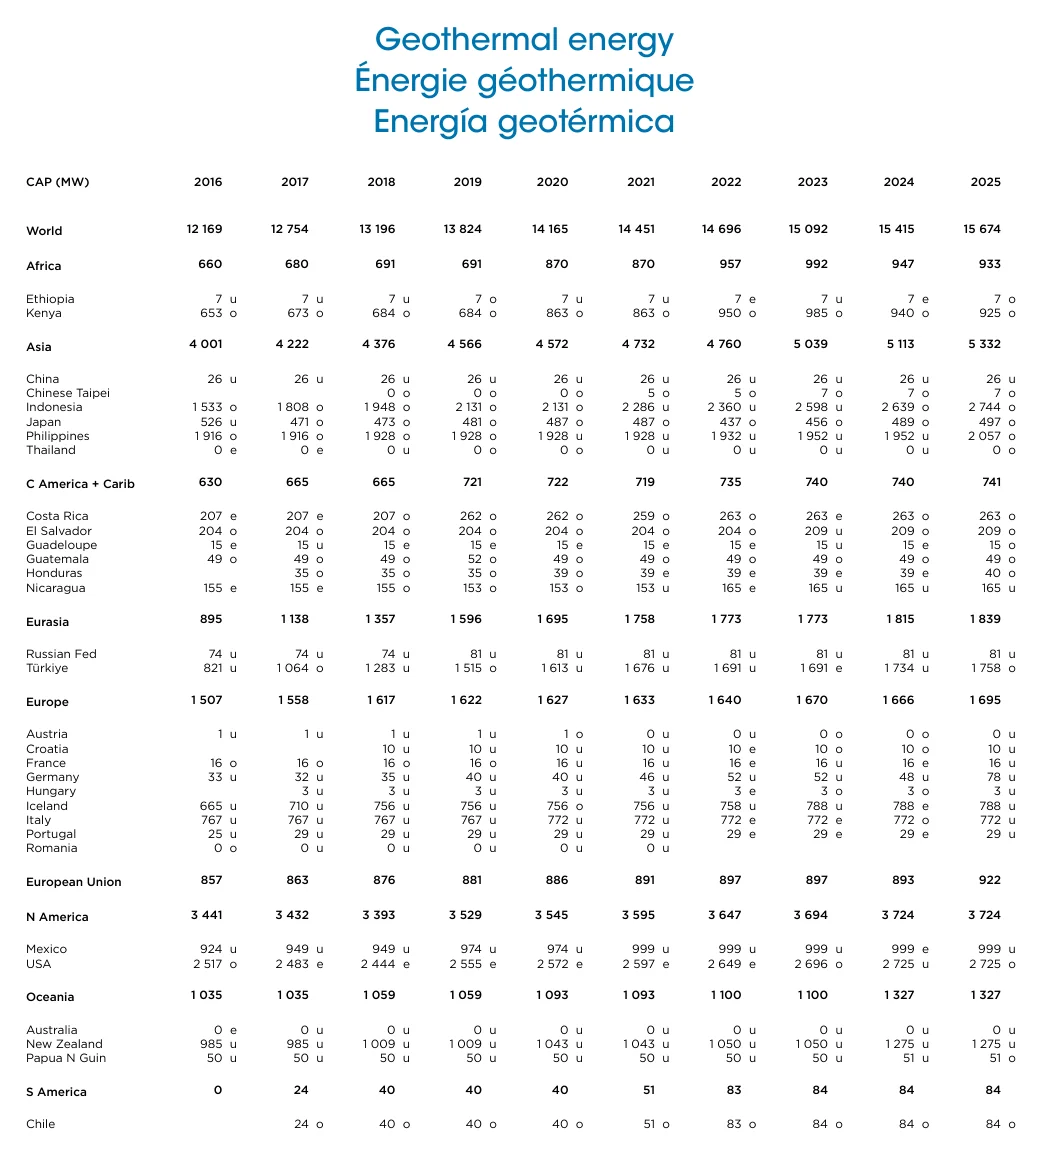
The Philippines ranks third with 2,057 MW, and Türkiye is fourth with 1,758 MW (IRENA, Mar 2026).
- New Zealand has 1,275 MW (IRENA, Mar 2026).
- Mexico has 999 MW and Kenya has 925 MW (IRENA, Mar 2026).
- Iceland has 788 MW, Italy 772 MW and Japan 497 MW (IRENA, Mar 2026).
- Türkiye grew from 821 MW in 2016 to 1,758 MW in 2025 (IRENA, Mar 2026).
- Germany’s capacity rose from 48 MW in 2024 to 78 MW in 2025 (IRENA, Mar 2026).
- The European Union as a whole has 922 MW (IRENA, Mar 2026).
Which countries depend most on geothermal power?
Kenya made 5,718.16 GWh from geothermal in the year to June 2025, 10.45 GWh more than a year earlier (Kenya EPRA, Jun 2025).
- Geothermal is 25.92% of Kenya’s installed capacity, and its generation share slipped 2.19 points from 41.7% a year earlier (Kenya EPRA, Jun 2025).
- Kenya’s 940 MW is 8.16% of East African Community capacity (Kenya EPRA, Jun 2025).
- In 2022, 25 countries made about 92 billion kWh from geothermal, and Indonesia led with about 17 billion kWh, roughly 5% of its electricity (EIA, Feb 2026).
- Geothermal supplies 65% of Iceland’s primary energy, and its nine plants hold 755 MWe and make almost 6 TWh a year, around 30% of the country’s electricity (Iceland GeoSurvey, Sep 2023).
- Geothermal covers more than 90% of Iceland’s house heating (Iceland GeoSurvey, Sep 2023).
- New Zealand set a geothermal record of 8,741 GWh in 2024, up 13%, after Tauhara and Te Huka 3 added 225 MW (New Zealand MBIE, Aug 2025).
US Power Plants and Resource Potential
U.S. geothermal power is a Western story and a small one. Two states hold nearly all of it, and every official estimate of the resource is many times larger than what is installed.
Where does U.S. geothermal power come from?
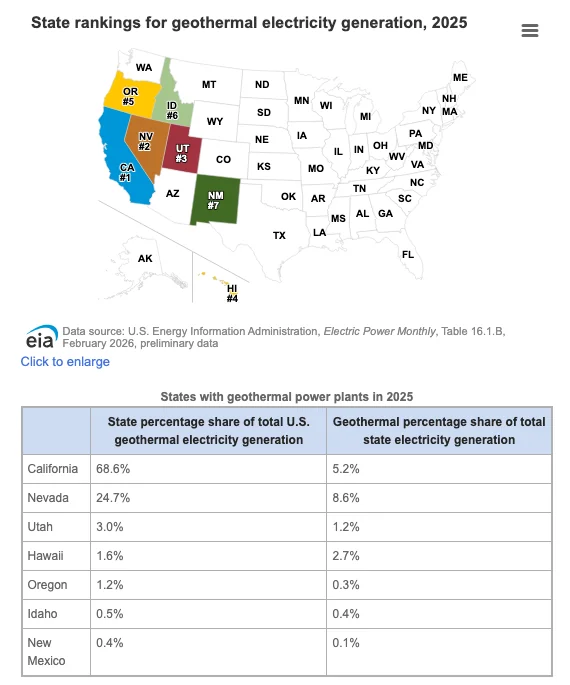
Nevada made 24.7% of U.S. geothermal electricity in 2025, and geothermal was 8.6% of Nevada’s own generation (EIA, Feb 2026).
- Geothermal was 5.2% of California’s generation, 1.2% of Utah’s and 2.7% of Hawaii’s (EIA, Feb 2026).
- Utah made 3.0% of the U.S. total and Hawaii 1.6% (EIA, Feb 2026).
- The Geysers in Northern California is the largest known dry steam field in the world and has made electricity since 1960 (EIA, Feb 2026).
- The U.S. had 2.5 GW of operating geothermal capacity in 2019, and about half of it came online in the 1980s (EIA, Nov 2019).
- U.S. geothermal plants ran at a 76% capacity factor in 2018, the highest among renewables (EIA, Nov 2019).
- About 94% of U.S. geothermal capacity sat in California and Nevada in 2019 (EIA, Nov 2019).
How much more U.S. geothermal power could be built?
The USGS estimated 9,057 MWe from identified U.S. geothermal systems and a mean of 30,033 MWe from undiscovered ones (USGS, Sep 2008).
- The same assessment put enhanced geothermal potential at another 517,800 MWe if reservoir creation technology works (USGS, Sep 2008).
- A 2025 provisional USGS estimate for the Great Basin alone is 135 GWe from the upper 6 km of crust (USGS, May 2025).
- DOE’s 2019 GeoVision analysis found geothermal could reach 60 GW by 2050, which is 8.5% of U.S. generation and more than 26 times current deployment (DOE GeoVision, Oct 2026).
- GeoVision found that permitting reform alone could double geothermal capacity by 2050 (DOE GeoVision, Oct 2026).
- NREL’s 2023 model run reached 38.30 GWe in 2035 and 90.52 GWe in 2050, where geothermal is 3.94% of capacity but 12.04% of generation (NREL Enhanced Geothermal Shot, Jan 2023).
- DOE’s 2024 liftoff roadmap described 90 GW or more by 2050 as a twentyfold increase (DOE Next-Generation Liftoff, Mar 2024).
Europe’s Geothermal Market
Europe’s geothermal power fleet is small and sits in three countries. The growth in Europe is in heat, and the power numbers are the part that tells you how much room is left.
How many geothermal power plants does Europe have?
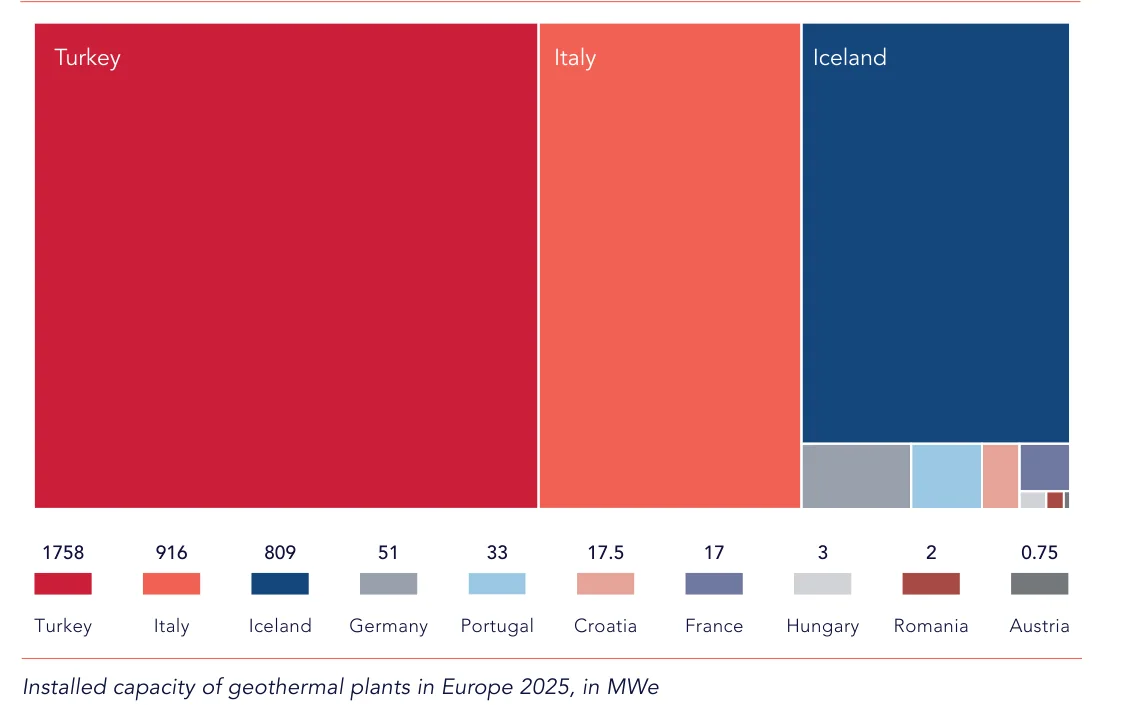
Europe had 150 geothermal power plants with 3.53 GWe of capacity at the end of 2025, 1.02 GW of it in EU countries (EGEC, Jul 2026).
- Capacity by country was Türkiye 1,758 MWe, Italy 916 MWe, Iceland 809 MWe and Germany 51 MWe (EGEC, Jul 2026).
- European plants made 20 TWh of firm power in 2025, and 7 TWh of it came from EU countries (EGEC, Jul 2026).
- Five new plants opened in 2025, three in Türkiye, one in Germany and one in Iceland, and Croatia restarted, for about 125 MW together (EGEC, Jul 2026).
- Around 45 plants are in development and proposals for 152 more are being studied (EGEC, Jul 2026).
What does European geothermal deliver?
Newly installed geothermal capacity in Europe in 2025 was about 2 GW, an investment of 2.5 billion euros (EGEC, Jul 2026).
- Total installed geothermal capacity across all uses stood at 48.73 GW in December 2025 (EGEC, Jul 2026).
- The sector spent more than 500 million euros on exploration over three years (EGEC, Jul 2026).
- Deep geothermal project cycles last 4 to 6 years (EGEC, Jul 2026).
- Geothermal produced about 500 TWh since 2020 and saved over 43 Mtoe of energy imports, roughly 316 million barrels of oil a year (EGEC, Jul 2026).
- The sector directly employed 30,000 professionals and indirectly employed 20,000 (EGEC, Jul 2026).
Ground-Source Heat Pump Installations Worldwide
Most of the world’s geothermal heat comes from heat pumps in basements and boreholes, not from steam wells. These geothermal heat pump statistics show a market led by China, the United States and northern Europe. Air-source units are covered separately in our heat pump statistics.
How many ground-source heat pumps are installed around the world?
China, the United States, Sweden, Germany and Finland lead in ground-source heat pump capacity, and the leaders hold 77.4% of the world’s units (Lund and Toth, Apr 2021).
- Ground-source heat pumps use 58.8% of all thermal energy from direct geothermal use (Lund and Toth, Apr 2021).
- Installed heat pump capacity in 2019 was 26,450 MWt in China, 20,230 MWt in the United States, 6,680 MWt in Sweden, 4,400 MWt in Germany and 2,300 MWt in Finland (Lund and Toth, Apr 2021).
- Buildings using ground-source heat pumps in China reached 500 million square meters by the end of 2019 (Lund and Toth, Apr 2021).
- Sweden had about 590,000 ground-source units, and 140,000 of Finland’s 900,000 heat pumps drew from the ground (Lund and Toth, Apr 2021).
- Germany had 382,000 units at the end of 2018, about 1.62% of residential heat demand, and sold about 23,500 that year (Lund and Toth, Apr 2021).
- France had about 174,000 units and Switzerland about 110,000 (Lund and Toth, Apr 2021).
How many ground-source heat pumps does Europe sell?
EU sales were just under 112,000 units in 2024 before the 2025 rebound, and the EU stock has passed 2.5 million units (EGEC, Jul 2026).
- Sweden sold 26,785 units in 2025, the Netherlands 22,148, Germany 19,125 and Switzerland 8,491 (EGEC, Jul 2026).
- Finland sold 6,602 units, Poland 6,600 and the United Kingdom 4,070 (EGEC, Jul 2026).
- Installed European capacity is 39.2 GWth, of which 36.66 GW is small units under 50 kWth (EGEC, Jul 2026).
- Ground-source heat pumps provided 88 TWh of heat in 2025, serving more than 10.6 million people (EGEC, Jul 2026).
- At least 16 large closed-loop systems opened in 2025, including six in Sweden, five in Hungary and four in the United Kingdom (EGEC, Jul 2026).
US Stock and Shipments
The United States counts its ground-source heat pumps badly. The federal shipment survey is gone, so today’s totals are estimates built from tax returns, trade data and older surveys.
How many U.S. homes have a ground-source heat pump?
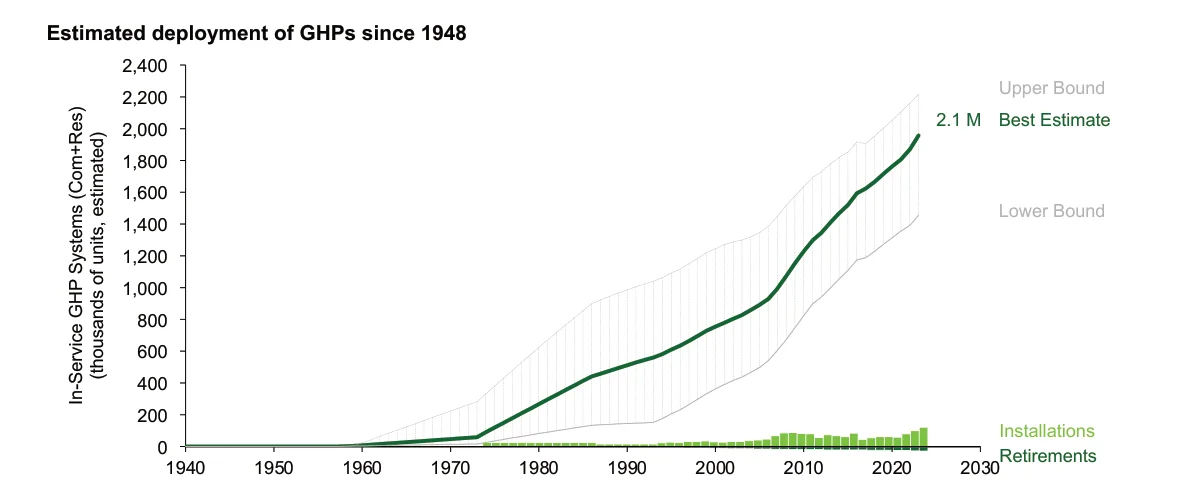
About 1.3 million U.S. homes heat with a ground-source heat pump, against 15.9 million with an air-source heat pump, in a dataset of 123.5 million homes (DOE Liftoff Heating and Cooling, Jan 2025).
- DOE’s best estimate of units in service, which includes commercial buildings, is about 2.1 million (DOE Liftoff Heating and Cooling, Jan 2025).
- Installations run near 114,000 units a year, with net additions of about 85,000 after retirements (DOE Liftoff Heating and Cooling, Jan 2025).
- Air-source heat pumps sell at 3.6 million units a year, and gas and oil furnaces at 3 million (DOE Liftoff Heating and Cooling, Jan 2025).
- The installed U.S. stock grows 4.6% a year, less than half the roughly 12% a year estimated for Europe in 2023 (DOE Liftoff Heating and Cooling, Jan 2025).
- DOE sees technical potential for up to about 80 million homes by 2050, but expects actual adoption near 9 million homes in the residential market (DOE Liftoff Heating and Cooling, Jan 2025).
- Lund and Toth counted about 1.685 million U.S. units growing 4.0% a year, with about 40% in homes (Lund and Toth, Apr 2021).
- About 75% of residential installations are in new construction and 25% in retrofits (ORNL GeoVision Heat Pumps, Apr 2019).
What did U.S. shipments look like when EIA counted them?
U.S. makers shipped 121,243 geothermal heat pump units in 2008, a rise of more than 40% on 2007 (EIA, Oct 2009).
- Rated capacity shipped in 2008 was 416,105 tons, up from 291,300 tons in 2007 (EIA, Oct 2009).
- Makers named a backlog of orders, a shortage of trained installers and high investment costs as pressures in 2008 (EIA, Oct 2009).
- Shipments fell almost 5% in 2009 to 115,442 units, the first drop since 2003 (EIA, Dec 2012).
- Total revenue in 2009 was about $319.5 million, and the industry employed 1,832 person-years (EIA, Dec 2012).
- Exports were about 17% of 2009 capacity, and Canada took more than 83% of them (EIA, Dec 2012).
- Residential buyers took almost 51% of domestic capacity in 2009 and commercial buyers 46% (EIA, Dec 2012).
- EIA discontinued its survey of U.S. ground-source shipments in 2010 (ORNL GeoVision Heat Pumps, Apr 2019).
- ORNL put ground-source heat pumps at about 1% of the U.S. HVAC market (ORNL GeoVision Heat Pumps, Apr 2019).
Installed Cost, Payback and Incentives
Upfront price decides this market. The ground loop is the cost, and the federal credit that eased it ended with 2025.
What does a ground-source heat pump cost per ton?
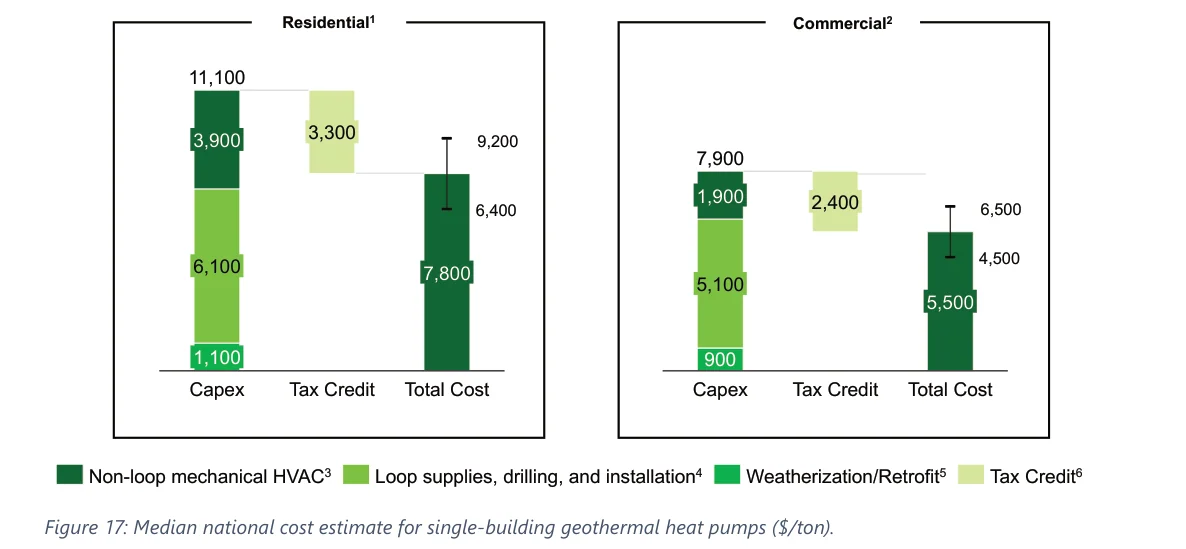
DOE puts a typical U.S. home at $19,000 after incentives, and says the ground loop is the highest cost in almost every installation (DOE Liftoff Heating and Cooling, Jan 2025).
- Of the $11,100 per ton residential cost, loop supplies, drilling and installation are $6,100, non-loop HVAC equipment is $3,900 and weatherization is $1,100 (DOE Liftoff Heating and Cooling, Jan 2025).
- The residential tax credit took $3,300 per ton off, and the net cost ranged from $6,400 to $9,200 per ton (DOE Liftoff Heating and Cooling, Jan 2025).
- Net residential cost was lowest in the Northeast and South at $7,200 to $7,300 per ton and highest in the West at $11,600 (DOE Liftoff Heating and Cooling, Jan 2025).
- Commercial systems cost $7,900 per ton before a $2,400 credit and $5,500 after it (DOE Liftoff Heating and Cooling, Jan 2025).
- ORNL used a national median borehole price of $14 per foot for its cost model (ORNL GeoVision Heat Pumps, Apr 2019).
- DOE’s example of a large Northeast building assumed drilling at $28 per foot (DOE Liftoff Heating and Cooling, Jan 2025).
How long does a ground-source heat pump take to pay back?
A simple payback of 8 to 14 years is typical for U.S. retrofits, and new construction is shorter (ORNL GeoVision Heat Pumps, Apr 2019).
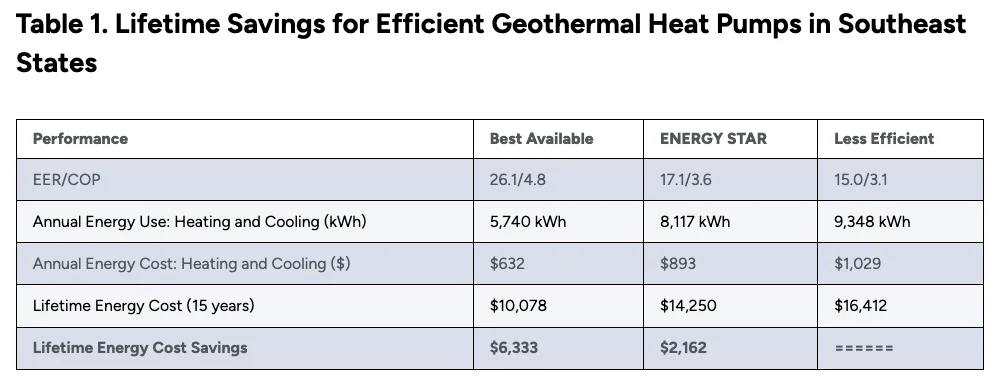
- The federal buyer test says an ENERGY STAR unit saves money if it costs no more than $2,162 extra in the Southeast, $842 in the Southwest and $1,666 in northern states (DOE FEMP, Dec 2024).
- The best available model saves up to $6,333 over 15 years in the Southeast, $2,658 in the Southwest and $4,496 in the North (DOE FEMP, Dec 2024).
- Long Island homes saved $173 per installed ton a year against fuel oil and $76 per ton against natural gas (NYSERDA, Jan 2024).
- At post-pandemic fuel oil prices, annual savings were as high as $295 per installed ton (NYSERDA, Jan 2024).
- DOE says reaching liftoff by 2035 means ground-source systems in the equivalent of 7 million homes, a $100 billion to $150 billion opportunity (DOE Liftoff Heating and Cooling, Jan 2025).
Is there still a federal tax credit?
The credit is no longer open to new installs. The IRS says the cost counts as made when the original installation is finished, so equipment finished after December 31, 2025 does not qualify even if it was paid for earlier (IRS, Aug 2025).
- Before the change, residential and commercial credits each covered 30% of total installation cost with no upper limit (DOE Liftoff Heating and Cooling, Jan 2025).
- An earlier credit paid 30% of the whole system for installs between December 1, 2009 and December 31, 2016, with no cap (ORNL GeoVision Heat Pumps, Apr 2019).
- The 2008 law capped the residential credit at $2,000 and required 14.1 EER and 3.3 COP for closed-loop systems (EIA, Oct 2009).
Efficiency and Operating Savings
Ground-source heat pumps win on efficiency because the ground stays near one temperature all year. The ratings below are the part a buyer can check against a nameplate.
What efficiency must an ENERGY STAR ground-source heat pump reach?
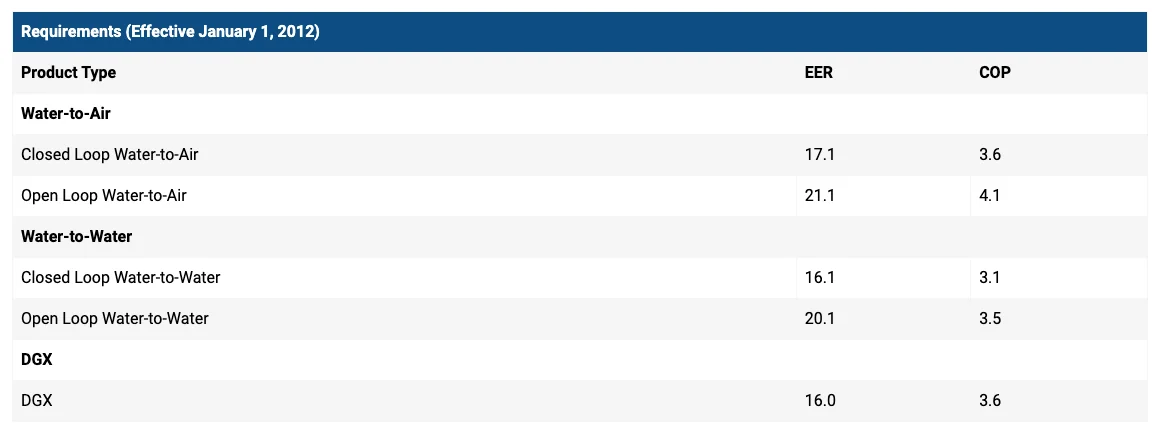
A closed-loop water-to-air unit needs an EER of 17.1 and a COP of 3.6 to earn the label (ENERGY STAR, Jan 2012).
- Open-loop water-to-air units need an EER of 21.1 and a COP of 4.1 (ENERGY STAR, Jan 2012).
- Water-to-water units need an EER of 16.1 and a COP of 3.1 on a closed loop, and 20.1 and 3.5 on an open loop (ENERGY STAR, Jan 2012).
- Direct exchange units need an EER of 16.0 and a COP of 3.6 (ENERGY STAR, Jan 2012).
- The best listed model reaches an EER of 26.1 and a COP of 4.8, against 15.0 and 3.1 for a less efficient unit (DOE FEMP, Dec 2024).
How do these systems perform in real homes?
Long Island ground-source systems averaged a corrected seasonal heating COP of 3.8, including pumps and backup heat (NYSERDA, Jan 2024).
- An earlier upstate New York study measured an average heating COP of 3.6 (NYSERDA, Jan 2024).
- Simulations show ground-source heat pumps beat ENERGY STAR air-source heat pumps on winter COP in almost every U.S. region (DOE Liftoff Heating and Cooling, Jan 2025).
- Soil ten feet down holds a steady 50 to 60 degrees Fahrenheit (EIA, Feb 2026).
What could mass adoption do for the grid?
Mass deployment of about 5 million ground-source heat pumps a year cut grid costs and CO2 in every scenario DOE’s labs modeled (ORNL and NREL Grid Study, Nov 2023).
- At liftoff scale, summer peak demand could fall by 12 GW and winter peak by over 40 GW (DOE Liftoff Heating and Cooling, Jan 2025).
- The winter peak effect is about six times the summer effect, roughly 18% against 4% (DOE Liftoff Heating and Cooling, Jan 2025).
- Retrofitting every existing U.S. HVAC system with a ground-source unit could cut primary energy for space conditioning by 5.7 quads a year, or 46% (ORNL GeoVision Heat Pumps, Apr 2019).
- That retrofit would also cut energy costs by $49.8 billion a year (ORNL GeoVision Heat Pumps, Apr 2019).
District Heating and Direct Use
Direct geothermal heat is the old half of the industry. It is hot water from a well sent straight to buildings, pools, greenhouses and factories, and it works best where cities already have heat networks.
How much geothermal heat is used worldwide?
Direct use of geothermal energy reached 107,727 MWt at the end of 2019, up 52.0% from 2015 (Lund and Toth, Apr 2021).
- Energy used grew 72.3% to 283,580 GWh a year (Lund and Toth, Apr 2021).
- Direct use was reported in 88 countries, up from 28 in 1995 (Lund and Toth, Apr 2021).
- Bathing and swimming take 18.0% of the energy, space heating 16.0% (91.0% of it district heating) and greenhouses 3.5% (Lund and Toth, Apr 2021).
- Industry uses 1.6% of direct-use energy (Lund and Toth, Apr 2021).
- China leads with 40,610 MWt of direct use and the United States follows with 20,713 MWt (Lund and Toth, Apr 2021).
How large is Europe’s geothermal district heating market?
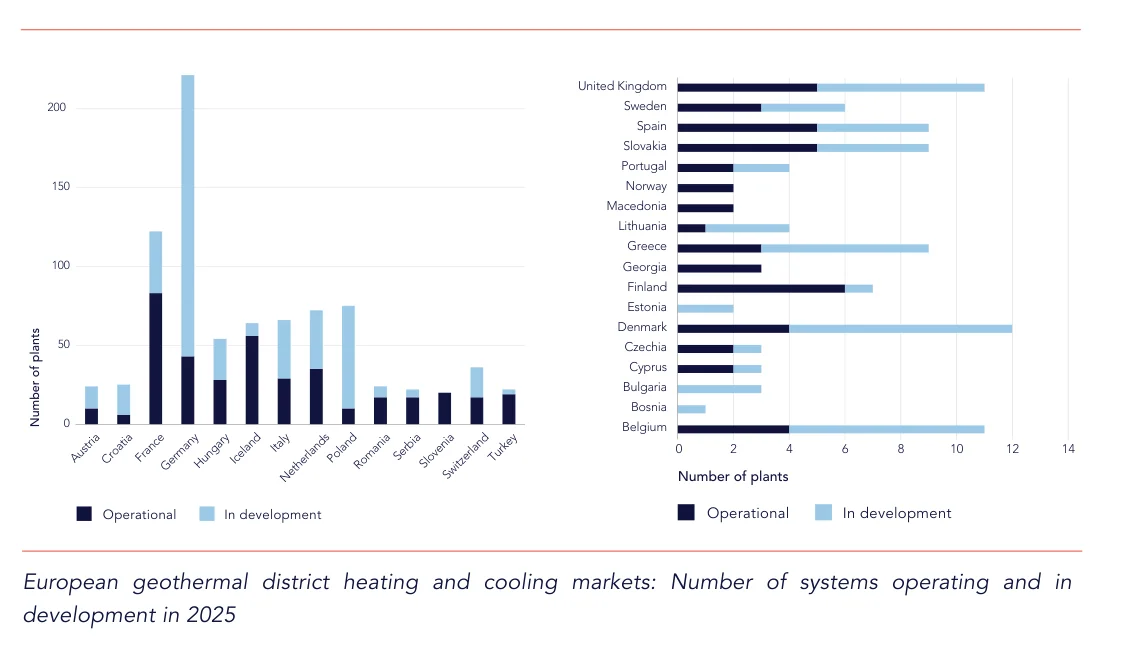
Europe had 434 operating geothermal district heating and cooling systems at the end of 2025, with more than 6 GWth of capacity across 29 countries (EGEC, Jul 2026).
- Ten new systems opened in 2025, adding about 70 MWth, in France, Germany, the Netherlands, Denmark, Serbia and Spain (EGEC, Jul 2026).
- More than 500 projects are in development and could add another 6 GWth (EGEC, Jul 2026).
- Geothermal is now the second largest renewable source for district heating in Europe (EGEC, Jul 2026).
- Italy added 16 district heating projects to its pipeline in 2025 (EGEC, Jul 2026).
- Even so, geothermal provides under 3% of European district heating (IEA, Dec 2024).
- Over 90% of Iceland’s district heat comes from geothermal (IEA, Dec 2024).
- Geothermal meets around 1% of heat demand in buildings worldwide, and over 60% of geothermal heat goes to buildings (IEA, Dec 2024).
- Heat for district systems cost about USD 22 per gigajoule in the EU in 2014 and USD 10 in the United States in 2017 (IEA, Dec 2024).
What do U.S. networked systems look like?
Boise runs the largest municipally operated geothermal heating utility in the United States, with more than 20 miles of pipe serving over six million square feet of buildings (DOE Networked Geothermal, Oct 2026).
- Klamath Falls, Oregon serves 23 commercial, nonprofit and government facilities from a geothermal reservoir at 200 to 220 degrees (DOE Networked Geothermal, Oct 2026).
- Ball State University drilled about 3,600 boreholes to heat and cool 47 buildings and expects $2 million in annual savings (DOE Networked Geothermal, Oct 2026).
- DOE’s district-scale pilot program selected 11 community coalitions in 10 states for planning and then chose three to install networks (DOE Networked Geothermal, Oct 2026).
- GeoVision found economic potential for 17,500 geothermal district heating systems nationwide (DOE GeoVision, Oct 2026).
Power Costs, Investment and Next-Generation Projects
Geothermal power has not followed solar down the cost curve, and that is the case for next-generation drilling. Fresh projects in Utah are the first real test of whether it can.
What does geothermal power cost?
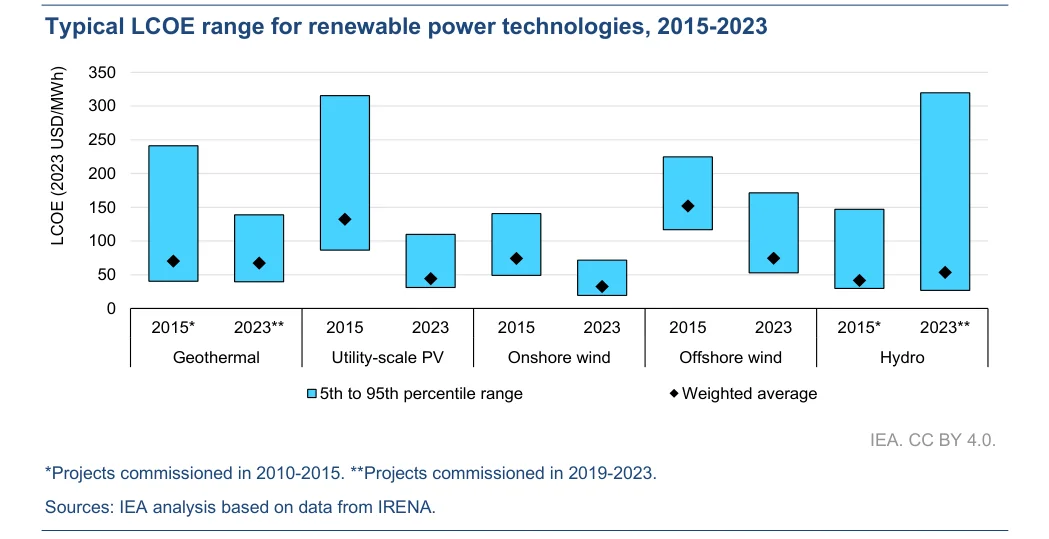
Since 2010 the levelised cost of geothermal power rose 53% and hydropower rose 41%, while solar PV fell 89% (IRENA, Jul 2026).
- Recent auctions in Croatia, Italy, Mexico and the United Kingdom awarded geothermal contracts at USD 100 to 170 per MWh, three to four times wind and solar (IEA, Dec 2024).
- Germany offers almost USD 275 per MWh for new geothermal electricity (IEA, Dec 2024).
- Initial investment makes up about 80% of generation cost (IEA, Dec 2024).
- Plant equipment and construction are 40% to 60% of conventional project cost, and wells and steamfield are 30% to 45% (IEA, Dec 2024).
- Doubling the cost of capital from 5% to 10% lifts a plant’s levelised cost by about 40% (IEA, Dec 2024).
How much money goes into geothermal?
Geothermal power and heat investment topped USD 47 billion in 2023, more than 5% of all renewable spending (IEA, Dec 2024).
- Heating for buildings, including ground-source heat pumps, was over 95% of that, and China alone was over 70% (IEA, Dec 2024).
- If next-generation costs fall, investment could reach USD 1 trillion by 2035 and USD 2.5 trillion by 2050 (IEA, Dec 2024).
- Up to 80% of the investment in a geothermal project involves skills common in the oil and gas industry (IEA, Dec 2024).
- The industry provides about 145,000 jobs today and could reach 1 million by the end of this decade (IEA, Dec 2024).
- Over 100 countries have policies for solar PV or onshore wind, and fewer than 30 have them for geothermal (IEA, Dec 2024).
- Permitting can take up to a decade for a new project (IEA, Dec 2024).
How close are next-generation plants?
Cape Station Phase I is about 100 MW built as three 33 MW GeoBlocks, and the first reached First Power with full commercial operation expected by October 1, 2026 (Fervo Energy, Sep 2026).
- A further 400 MW is under construction for 2028 (Fervo Energy, Sep 2026).
- About 900 MW of offtake is contracted, enough for nearly 1 million U.S. homes, per the company (Fervo Energy, Sep 2026).
- The Cape Station site has permit approval to expand up to 2 GW (Fervo Energy, Jun 2025).
- The IEA puts next-generation technical potential at 140 times global electricity demand (IEA, Dec 2024).
- It says up to 800 GW could meet up to 15% of global demand growth to 2050 (IEA, Dec 2024).
- DOE’s Enhanced Geothermal Shot targets a 90% cost cut, to $45 per MWh by 2035 (NREL Enhanced Geothermal Shot, Jan 2023).
Emissions and Climate Benefits
Geothermal is low carbon on average, but not uniformly so. Flash plants vent the CO2 trapped in their fluids, and a few sites do it at coal-like rates.
How much CO2 do geothermal plants emit?
Recent national averages were 34 g/kWh in Iceland, 107 in California, 104 in New Zealand and 330 in Italy (World Bank, Feb 2017).
- Some plants in Italy and Türkiye emit above 500 g/kWh, and a few above 1,000, on par with coal (World Bank, Feb 2017).
- Methane adds 18.3 gCO2e/kWh in New Zealand, the only country with enough data to say (World Bank, Feb 2017).
- Emissions from building a plant run between 2 and almost 20 gCO2e/kWh over 30 years (World Bank, Feb 2017).
What do life cycle studies find?
NREL’s median life cycle estimates were 32.0 gCO2e/kWh for enhanced systems, 47.0 for flash plants and 11.3 for hydrothermal binary plants (NREL Life Cycle Review, Sep 2017).
- Only 29 of more than 180 geothermal studies passed both screening stages (NREL Life Cycle Review, Sep 2017).
- Flash plant emissions come mostly from operations, while binary plant emissions come mostly from construction (NREL Life Cycle Review, Sep 2017).
How much carbon do geothermal heating systems avoid?
Worldwide direct use, heat pumps included, saves 596 million barrels of oil equivalent a year and avoids 252.6 million tonnes of CO2 (Lund and Toth, Apr 2021).
- Retrofitting all U.S. HVAC systems with ground-source heat pumps could cut CO2 emissions by 356.3 million metric tons a year (ORNL GeoVision Heat Pumps, Apr 2019).
- EGEC estimates European geothermal saves the equivalent of 200 million tonnes of CO2e a year (EGEC, Jul 2026).
For wider context on how buildings use energy, see our HVAC energy consumption statistics and building electrification statistics.
Sizing a Ground-Loop System
Everything above assumes the system was sized right. The loop, the pump and the budget all follow from the load, so the first number to get is the building’s heating and cooling load, not the loop length.
How big is a typical ground-source heat pump?
The average unit shipped in 2009 was 3.53 tons, and one ton is 12,000 Btu per hour of heating or cooling (EIA, Dec 2012).
- A typical unit is about 12 kW thermal, and U.S. buildings run about 600 square feet per ton in homes and 400 in commercial space (ORNL GeoVision Heat Pumps, Apr 2019).
- DOE’s federal cost examples use a 36,000 Btu per hour residential unit, which is a 3 ton heat pump (DOE FEMP, Dec 2024).
- Ground loops run from a few feet down to average depths of about 300 feet (DOE Liftoff Heating and Cooling, Jan 2025).
To turn a house into tons, run its load first. The BTU calculator gives a quick heating and cooling load, and the heat pump sizing calculator helps pick a heat pump size from it.
How much do local heating and cooling hours change energy use?
The same 36,000 Btu per hour ENERGY STAR unit uses 8,117 kWh a year in El Dorado, Arkansas, against 3,274 kWh in Albuquerque and 6,030 kWh in Albany (DOE FEMP, Dec 2024).
- The Arkansas model assumes 1,738 hours of cooling and 1,521 hours of heating a year (DOE FEMP, Dec 2024).
- The Albany model assumes 524 hours of cooling and 1,681 hours of heating (DOE FEMP, Dec 2024).
- The Albuquerque model uses a small-office profile of 1,083 hours of cooling and 339 hours of heating (DOE FEMP, Dec 2024).
- Yearly energy cost for the ENERGY STAR unit runs $893 in the Southeast model, $360 in the Southwest and $664 in the North, at 11 cents per kWh (DOE FEMP, Dec 2024).
Methodology and Sources
We selected figures from the body that produced them: statistical agencies, regulators, national laboratories, intergovernmental agencies, trade bodies that count their own markets, and company announcements for company facts. We did not use statistics roundups or market research summaries. Each figure was read in the source document before it was used. Where a government web page carries no publication date, the month shown is the month we read it, and the text names the underlying report. DOE’s Liftoff report on heating and cooling is cited from a copy hosted by the International Ground Source Heat Pump Association, because the DOE liftoff site is no longer reachable. Capacity numbers differ slightly between sources and between editions of the same source, so each is labeled with its date. This page is refreshed monthly.
Glossary
- COP: Coefficient of performance, the heat delivered divided by the electricity used.
- EER: Energy efficiency ratio, cooling output in Btu per hour divided by electric input in watts.
- EGS: Enhanced geothermal systems, engineered underground reservoirs for hot rock with little natural water.
- GHP: Geothermal heat pump, also called a ground-source heat pump.
- GWth, MWt, MWe, GWe: Gigawatts or megawatts of thermal (t, th) or electric (e) capacity.
- LCOE: Levelised cost of electricity, the average cost per MWh over a plant’s life.
- District heating: A network that sends hot water from a central source to many buildings.
- Ton: A cooling and heating capacity unit equal to 12,000 Btu per hour.
- 25D: The Residential Clean Energy Credit in the U.S. tax code.
- Sources: See the list below.
Sources
- DOE FEMP, Dec 2024
- DOE GeoVision, Oct 2026
- DOE Liftoff Heating and Cooling, Jan 2025
- DOE Networked Geothermal, Oct 2026
- DOE Next-Generation Liftoff, Mar 2024
- EGEC, Jul 2026
- EGEC, Jul 2026
- EIA, Dec 2012
- EIA, Feb 2026
- EIA, Nov 2019
- EIA, Oct 2009
- ENERGY STAR, Jan 2012
- Fervo Energy, Jun 2025
- Fervo Energy, Sep 2026
- IEA, Dec 2024
- IRENA, Jul 2026
- IRENA, Jul 2026
- IRENA, Mar 2026
- IRENA, Mar 2026
- IRS, Aug 2025
- Iceland GeoSurvey, Sep 2023
- Kenya EPRA, Jun 2025
- Lund and Toth, Apr 2021
- NREL Enhanced Geothermal Shot, Jan 2023
- NREL Life Cycle Review, Sep 2017
- NYSERDA, Jan 2024
- New Zealand MBIE, Aug 2025
- ORNL GeoVision Heat Pumps, Apr 2019
- ORNL and NREL Grid Study, Nov 2023
- USGS, May 2025
- USGS, Sep 2008
- World Bank, Feb 2017