Indoor air quality statistics point to one fact that most buildings ignore: people spend most of their lives breathing air that nobody measures. No federal agency sets rules for the air inside homes, and only two national indicators track it. Meanwhile the same air carries radon, cooking fumes, chemicals from paint and furniture, and the smoke of other people.
This page collects the primary data on that air. Every figure below comes from the agency, lab or journal that produced it, with the month of the data. It covers what is in indoor air, what it does to health, how much fresh air buildings get, how well filters work, and what clean air does for thinking and learning. It is written for HVAC techs who set airflow and pick filters, and for owners who want the numbers behind the advice.
Key Takeaways
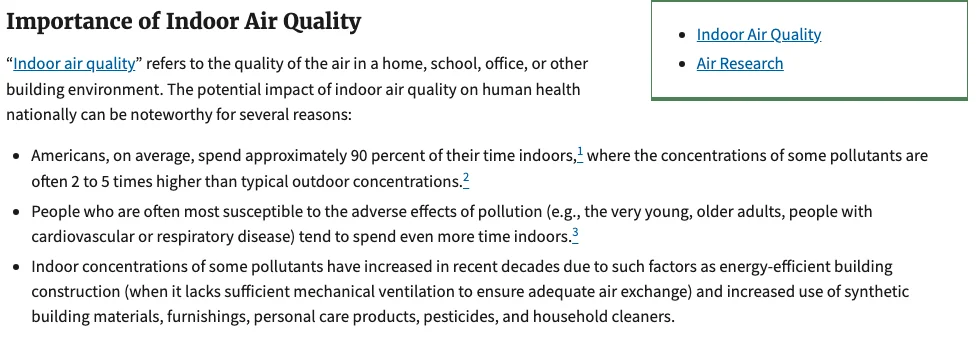
- Americans spend about 90 percent of their time indoors, where some pollutant levels are often 2 to 5 times higher than outdoors (EPA Report on the Environment, May 2026).
- Radon is believed to cause an estimated 21,100 lung cancer deaths in the U.S. each year (EPA Report on the Environment, Radon, Oct 2023).
- An estimated 12.7% of current childhood asthma in the U.S. is attributable to gas stove use (International Journal of Environmental Research and Public Health, Dec 2022).
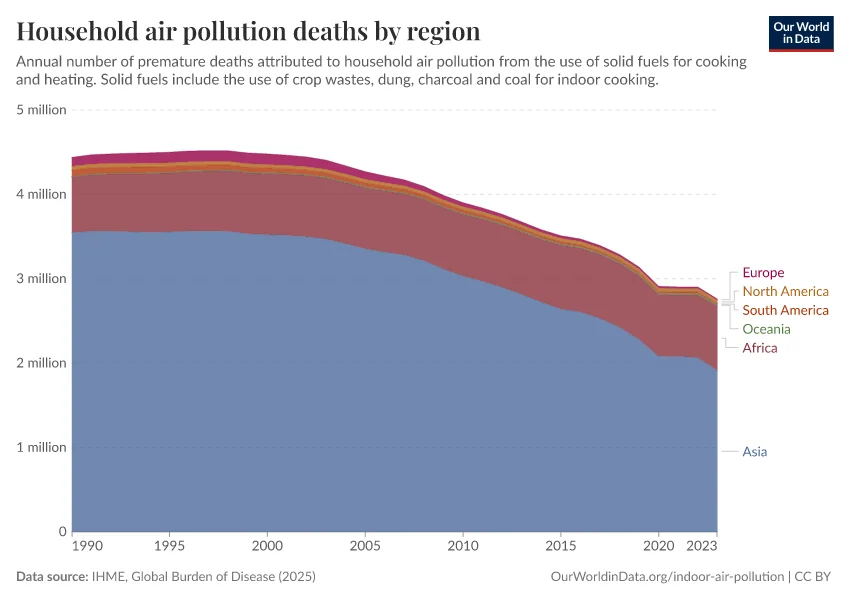
- Household air pollution was responsible for an estimated 2.9 million deaths in 2021 (WHO, Dec 2025).
- About 2.0 billion people still lacked access to clean cooking in 2024 (World Bank, Tracking SDG 7, Jun 2026).
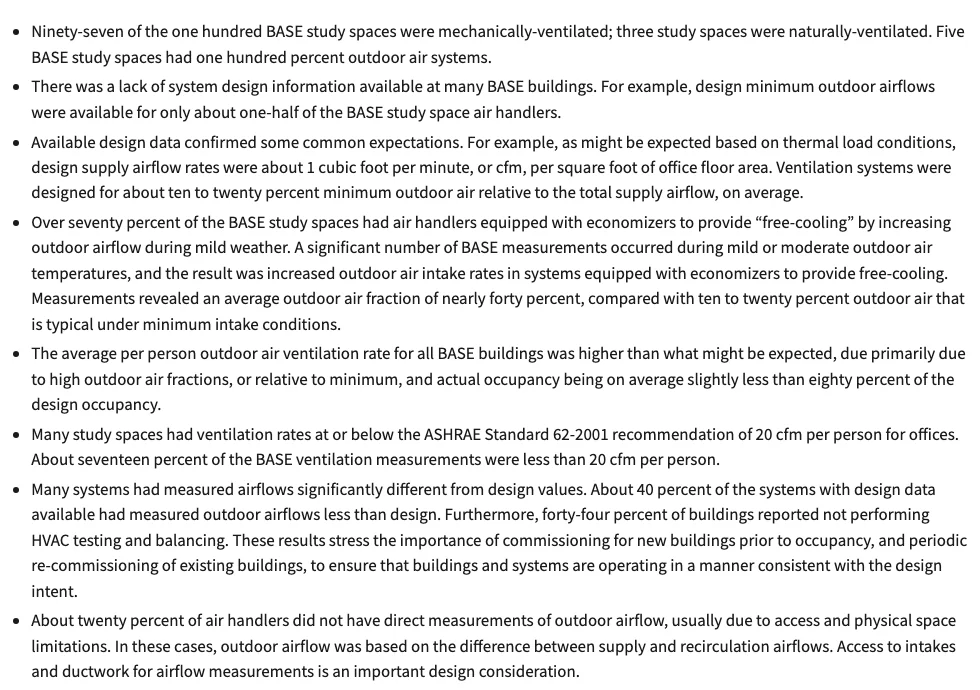
- In EPA’s study of 100 office buildings, 44 percent reported not performing HVAC testing and balancing (EPA Building Assessment Survey, Apr 2026).
- Ventilation fans were running in only 26% of 70 new California homes when researchers first visited (Berkeley Lab, Apr 2020).
- Range hoods were used for only 36% of cooking events in monitored California houses (Berkeley Lab, Nov 2020).
- Home HVAC systems usually run less than 25% of the time, and a furnace filter cleans air only while the fan runs (EPA Guide to Air Cleaners, Oct 2026).
- An estimated 41 percent of U.S. school districts need to update or replace HVAC systems in at least half of their schools (GAO, Jun 2020).
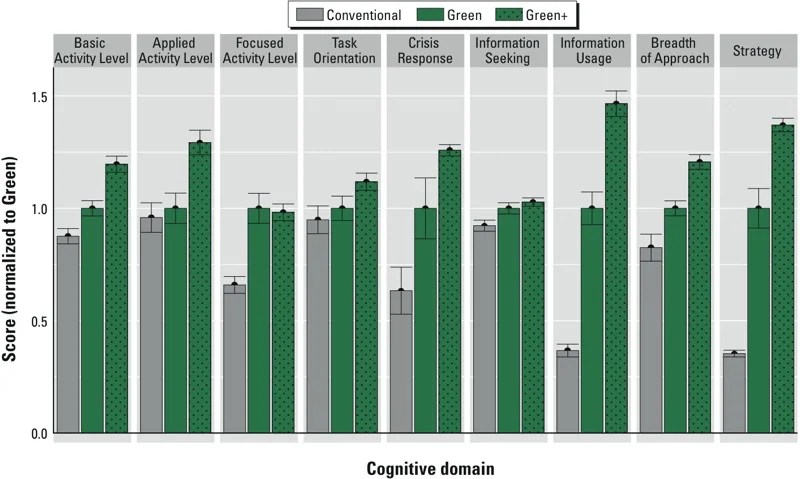
- Cognitive scores were 61% higher in a green office and 101% higher with enhanced ventilation than in a conventional office (Environmental Health Perspectives, Oct 2015).
- At 1,000 ppm of CO2, decision-making scores fell on six of nine scales compared with 600 ppm (Environmental Health Perspectives, Sep 2012).
- Asthma will cost the U.S. at least $118 billion in 2026 after adjusting for inflation (Asthma and Allergy Foundation of America, Apr 2026).
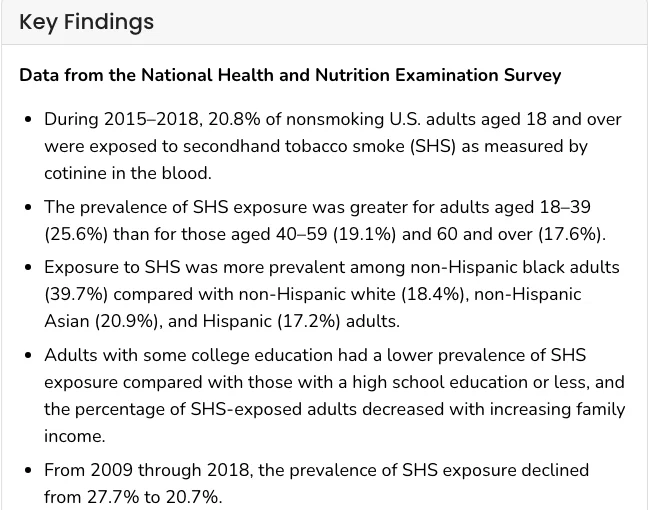
- During 2015 to 2018, 20.8% of nonsmoking U.S. adults were exposed to secondhand smoke, measured by cotinine in the blood (CDC National Center for Health Statistics, Feb 2021).
How Long Do People Spend Breathing Indoor Air?
The air inside a building matters more than the air outside for one plain reason: it is the air people breathe nearly all day. Yet the data on it is thin, old and rarely updated.
How much of the day is spent in buildings?
Most of it, and nearly all of that at home or work.
- In a two-year EPA telephone survey of 9,386 people, respondents reported spending an average of 87% of their time in enclosed buildings and about 6% in enclosed vehicles (Journal of Exposure Science & Environmental Epidemiology, Jul 2001).
- Interviews were completed in 63% of the households contacted, across all 10 EPA regions of the contiguous 48 states (Journal of Exposure Science & Environmental Epidemiology, Jul 2001).
- Americans aged 15 and over slept an average of 9.03 hours a day in 2025 (BLS American Time Use Survey, Jun 2026).
How many people work from home?
About one in three workers does some of the job in the building where they live.
- On days they worked in 2025, 35 percent of employed people did some or all of their work at home (BLS American Time Use Survey, Jun 2026).
- Employed people who worked at home put in an average of 5.10 hours of work there on those days (BLS American Time Use Survey, Table 6, Jun 2026).
Who tracks indoor air nationally?
Almost nobody, and no agency has the power to regulate it.
- EPA says only two national indicators of indoor air quality have long-term, quality data: radon and serum cotinine, a marker of tobacco smoke exposure (EPA Report on the Environment, May 2026).
- EPA does not have Congressional authority to regulate indoor air, though it promotes healthier indoor environments through other activities (EPA Air Research, Sep 2026).
- EPA names energy-efficient building construction without enough mechanical ventilation as one reason indoor concentrations of some pollutants have risen in recent decades (EPA Report on the Environment, May 2026).
What Is in Indoor Air Pollution?
Indoor pollution is mostly a product of what people bring in and do inside: paint, cleaners, cooking, furniture and dust. The numbers are not small, and they have not changed much in 40 years.
How much higher are indoor pollutant levels than outdoor ones?
Two to five times higher for common organic chemicals, and sometimes far more.
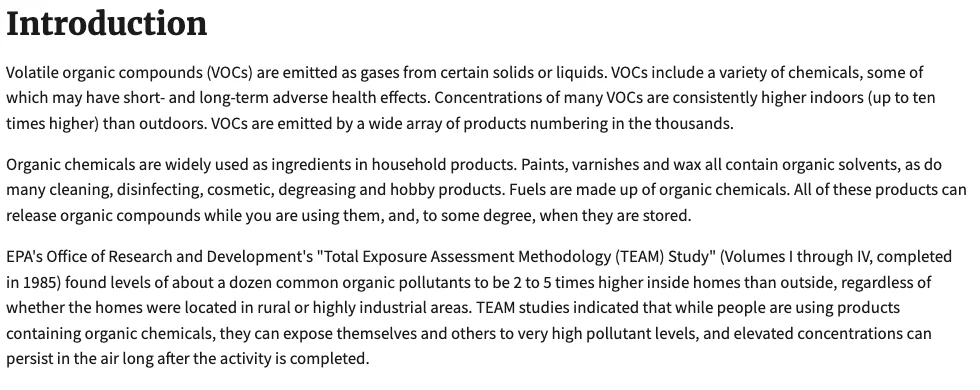
- EPA’s TEAM study found levels of about a dozen common organic pollutants to be 2 to 5 times higher inside homes than outside, whether the homes sat in rural or highly industrial areas (EPA, Jun 2026).
- EPA also notes that concentrations of many VOCs are consistently higher indoors, up to ten times higher than outdoors (EPA, Jun 2026).
- During and for several hours after activities such as paint stripping, VOC levels may be 1,000 times background outdoor levels (EPA, Jun 2026).
- For some pollutants, indoor levels may be two to five times, and occasionally more than 100 times, higher than outdoor levels (EPA Indoor Air Quality in Schools, Sep 2026).
What do building materials and household products add?
A lot, and they keep adding it after they are installed.
- Formaldehyde can cause watery eyes, burning in the eyes and throat, nausea and trouble breathing in some people at levels above 0.1 parts per million (EPA, Aug 2026).
- In homes with significant amounts of new pressed wood products, formaldehyde levels can be greater than 0.3 ppm (EPA, Aug 2026).
- NOAA researchers found that household chemicals now contribute as much to urban VOC air pollution as transportation and oil and gas emissions do (NOAA Chemical Sciences Laboratory, Feb 2018).
- U.S. inventories underestimate the VOCs emitted by consumer products by a factor of two or three (NOAA Chemical Sciences Laboratory, Feb 2018).
- Americans use almost 15 times more fuel than household products, yet the products add comparable amounts of VOCs (NOAA Chemical Sciences Laboratory, Feb 2018).
- Benzene was detected indoors in all 70 BASE office buildings where it was sampled, with a median of 3.6 micrograms per cubic meter (EPA Building Assessment Survey, Aug 2026).
- Acetaldehyde was detected indoors in all 86 buildings where it was sampled, with a median of 7.2 micrograms per cubic meter (EPA Building Assessment Survey, Aug 2026).
What about dust, particles and kitchen fumes?
Beds hold allergens in most homes, and kitchen fans are mostly left off.
- Dust mite allergen was detected in the beds of 84.2% of U.S. homes in the first National Survey of Lead and Allergens in Housing (Journal of Allergy and Clinical Immunology, Feb 2003).
- Allergen levels at or above 2.0 micrograms per gram of bed dust were found in 46.2% of homes (Journal of Allergy and Clinical Immunology, Feb 2003).
- Levels at or above 10.0 micrograms per gram, a higher threshold, were found in 24.2% of homes (Journal of Allergy and Clinical Immunology, Feb 2003).
- Particles of 10 micrometers or smaller are at least 5 times smaller than the width of a human hair, small enough to be inhaled deep into the lungs (EPA, Mar 2026).
- In 49% of monitored houses with five or more cooking events, the range hood ran for less than 30% of events (Berkeley Lab, Nov 2020).
- The same study found range hood use in 28% of cooking events in low-income apartments (Berkeley Lab, Nov 2020).
How Much Risk Do Gas Stoves and Radon Add?
Two home hazards stand out because they are common, measurable and fixable by trades people already in the house. One is a combustion appliance in the kitchen. The other is a gas that seeps up from the soil.
How common are gas stoves, and what do they emit?
Common enough that millions of kitchens add nitrogen dioxide to the air every day.
- Gas stoves are used for cooking in 35% of U.S. households, and in some states the share reaches 68% (International Journal of Environmental Research and Public Health, Dec 2022).
- Gas stoves are used in approximately 50 million U.S. homes (Science Advances, May 2024).
- Median gas and propane stove use raises long-term nitrogen dioxide exposure by 4.0 parts per billion, which is 75% of the WHO annual guideline (Science Advances, May 2024).
- That stove-driven increase equals 50% of the U.S.-average outdoor NO2 level in 2021 (Science Advances, May 2024).
- Median stove use pushes the daily peak hour above the WHO 1-hour guideline on 12 days a year, or 3.3% of days (Science Advances, May 2024).
- With oven use, interior doors open and the range hood off, bedroom NO2 passed EPA’s 1-hour benchmark within 25 minutes in three of six homes tested (Science Advances, May 2024).
- In two test cases, bedroom NO2 stayed above health guidelines for 2 to 3 hours after the oven was turned off (Science Advances, May 2024).
How much childhood asthma links to gas cooking?
Close to the share tied to secondhand smoke.
- The 12.7% attributable share is similar to the childhood asthma burden attributed to secondhand smoke exposure (International Journal of Environmental Research and Public Health, Dec 2022).
- A meta-analysis of 41 studies found a summary odds ratio of 1.32 for childhood asthma with gas cooking exposure (International Journal of Epidemiology, Aug 2013).
- The same analysis linked a 15 parts per billion increase in indoor NO2 to an odds ratio of 1.15 for current wheeze (International Journal of Epidemiology, Aug 2013).
How many U.S. homes have high radon?
About one in 15, and most have not been fixed.
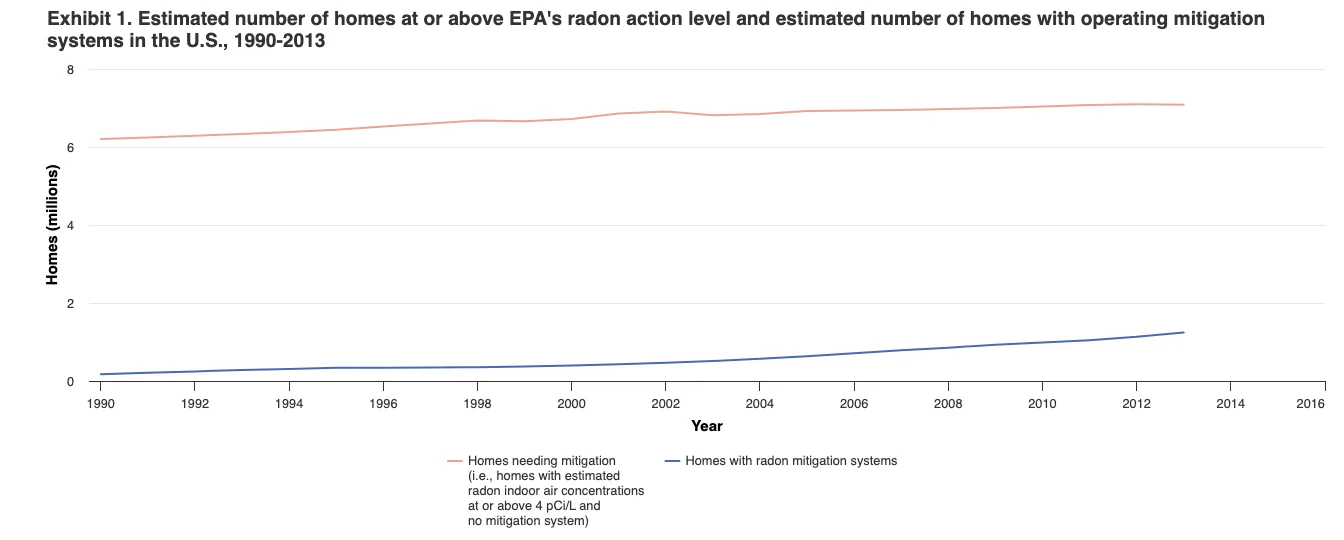
- About one in 15 homes in EPA’s “should test” category was estimated to be at or above the 4 pCi/L action level (EPA Report on the Environment, Radon, Oct 2023).
- An estimated 7.1 million homes needed mitigation in 2013, up 14 percent from 6.2 million in 1990 (EPA Report on the Environment, Radon, Oct 2023).
- Homes with operating mitigation systems rose 611 percent in that period, from 175,000 to 1,244,000 (EPA Report on the Environment, Radon, Oct 2023).
- Whole-house mechanical ventilation that works properly cut radon and nitrogen dioxide levels by 42% in a study of 51 Southeastern homes (U.S. Department of Energy, Aug 2024).
How dangerous is radon?
It is the second leading cause of lung cancer, and smoking multiplies the risk.
- An estimated 13.4 percent of U.S. lung cancer deaths are believed to be radon-related (EPA Report on the Environment, Radon, Oct 2023).
- At 4 pCi/L over a lifetime, about 62 of every 1,000 people who smoked could get lung cancer, versus about 7 of every 1,000 who never smoked (EPA, Jun 2026).
- At 20 pCi/L, about 260 of every 1,000 people who smoked could get lung cancer (EPA, Jun 2026).
- EPA lists the average indoor radon level at 1.3 pCi/L and the average outdoor level at 0.4 pCi/L (EPA, Jun 2026).
- People who smoke and are exposed to radon have a 10 times greater risk of lung cancer from radon than people who do not smoke at the same radon level (CDC, Aug 2026).
How Big Is Household Air Pollution Worldwide?
Outside the US, the worst indoor air comes from cooking over open fires. It kills more people each year than most diseases that get headlines, and it is falling too slowly.
How many people cook with polluting fuels?
About a quarter of humanity.
- Around 2.1 billion people cook using open fires or inefficient stoves fueled by kerosene, biomass or coal (WHO, Dec 2025).
- In 2023, 33% of the global population, or about 2.6 billion people, relied on solid fuels for cooking (State of Global Air, Oct 2025).
- In 2024, an estimated 75% of the world relied mainly on clean cooking fuels and technologies (World Bank, Tracking SDG 7, Jun 2026).
- Some 970 million people in Sub-Saharan Africa lack clean cooking access, and the figure may reach 1 billion by 2027 (World Bank, Tracking SDG 7, Jun 2026).
- Of the people without access, 1.5 billion live in rural areas, while the urban access rate is 89% (World Bank, Tracking SDG 7, Jun 2026).
- In 2021 only 14% of people in urban areas relied on polluting fuels, compared with 49% of the global rural population (WHO, Dec 2025).
- The IEA and WHO estimate that between 1.6 and 1.8 billion people will still lack clean cooking at the end of the decade (World Bank, Tracking SDG 7, Jun 2026).
How many deaths come from household air pollution?
Close to three million a year.
- Over 309,000 of the 2021 deaths were children under the age of 5 (WHO, Dec 2025).
- About 95 million disability-adjusted life years were attributable to household air pollution in 2021 (WHO, Dec 2025).
- In 2023, 2.8 million deaths were attributable to household air pollution (State of Global Air, Oct 2025).
- An estimated 21% of newborn deaths in the first week of life were due to household air pollution in 2023 (State of Global Air, Oct 2025).
- Over 500,000 deaths in children under five were linked to household air pollution in 2023 (State of Global Air, Oct 2025).
- Air pollution of all kinds contributed to 8.1 million deaths worldwide in 2021, more than 1 in 8 deaths (IHME, Jun 2024).
- In 2021, exposure to air pollution was linked to more than 700,000 deaths of children under five (IHME, Jun 2024).
Which diseases does it cause?
Heart disease, stroke, pneumonia, COPD and lung cancer.
- In poorly ventilated dwellings, indoor smoke can carry fine particle levels 100 times higher than acceptable (WHO, Dec 2025).
- About 12% of all deaths from ischaemic heart disease can be attributed to household air pollution (WHO, Dec 2025).
- Household air pollution is responsible for 44% of all pneumonia deaths in children under 5 (WHO, Dec 2025).
- In low- and middle-income countries, 23% of adult COPD deaths are due to household air pollution exposure (WHO, Dec 2025).
- About 11% of adult lung cancer deaths are attributable to carcinogens from household air pollution (WHO, Dec 2025).
- More than 750 million people lack electricity and rely on polluting devices such as kerosene lamps (WHO, Dec 2025).
What Does Indoor Air Pollution Do to Health in the U.S.?
In the U.S. the harm is quieter than in homes with open fires, but it is steady. Smoke from other people, asthma triggers and lung disease add up to a large and costly burden.
How many nonsmokers still breathe secondhand smoke?
Roughly one in five, down from more than one in four.
- Exposure was greater for adults aged 18 to 39, at 25.6%, than for those aged 40 to 59 (19.1%) and 60 and over (17.6%) (CDC National Center for Health Statistics, Feb 2021).
- Non-Hispanic Black adults had the highest exposure, at 39.7%, versus 18.4% for non-Hispanic White adults (CDC National Center for Health Statistics, Feb 2021).
- From 2009 through 2018, exposure declined from 27.7% to 20.7% (CDC National Center for Health Statistics, Feb 2021).
- Exposure prevalence fell by 71.2% from 1988 to 2014 (CDC National Center for Health Statistics, Feb 2021).
What does secondhand smoke do?
It kills tens of thousands of nonsmokers a year.
- Since 1964, about 2,500,000 people who did not smoke died from health problems caused by secondhand smoke (CDC, Jan 2025).
- Secondhand smoke causes nearly 34,000 premature deaths from heart disease each year in the U.S. (CDC, Jan 2025).
- It causes more than 7,300 lung cancer deaths a year among U.S. adults who do not smoke (CDC, Jan 2025).
- Nonsmoking adults exposed to secondhand smoke raise their risk of coronary heart disease by 25 to 30 percent (CDC, Jan 2025).
- Commercial tobacco smoke contains more than 7,000 chemicals, about 70 of which can cause cancer (CDC, May 2024).
How heavy is the asthma burden?
Heavy, and it falls hardest on children and lower-income households.
- Children had 374,265 asthma emergency department visits in 2023, a rate of 51.4 per 10,000, against 30.1 per 10,000 across all ages (CDC Asthma Data, Oct 2026).
- Asthma led to 60,770 hospital inpatient stays among children in 2023 (CDC Asthma Data, Oct 2026).
- Among children with current asthma, 47.1% had an asthma attack, against 41.2% of adults (CDC Asthma Data, Oct 2026).
- Asthma caused 166 child deaths and 3,458 adult deaths in 2023 (CDC Asthma Data, Oct 2026).
- Current asthma affected 11.7% of people below the poverty threshold, against 6.9% of those at 450% of the threshold or higher (CDC Asthma Data, Oct 2026).
- Nearly 1 in 13 school-age children has asthma, the leading cause of school absenteeism due to chronic illness (EPA Indoor Air Quality in Schools, Sep 2026).
- Asthma accounted for more than 14 million missed school days in 2001 (EPA Reference Guide for Indoor Air Quality in Schools, Oct 2026).
What does lung disease cost?
Billions, plus the deaths.
- About $3 billion of the yearly cost of asthma from 2008 to 2013 came from missed work and school days (Asthma and Allergy Foundation of America, Apr 2026).
- COPD was the fifth leading cause of death in the U.S. in 2023, with 141,733 deaths (CDC National Center for Health Statistics, Apr 2025).
- COPD costs adults aged 45 and older $24 billion a year in medical costs (CDC National Center for Health Statistics, Apr 2025).
- The age-adjusted share of adults with COPD was 3.8% in 2023, and 8.2% among those with family income below the federal poverty level (CDC National Center for Health Statistics, Apr 2025).
Moisture and mold drive part of this burden, and they have their own page: see mold statistics. Carbon monoxide from fuel-burning appliances is covered in carbon monoxide poisoning statistics.
Do Buildings Get Enough Fresh Air?
Often they do not, and the cause is usually a system problem, not a missing product. Fans that are off, airflows that were never tested and design values that nobody checked leave the air in many rooms staler than the plans say.
What did EPA find in 100 office buildings?
Many systems moved less outdoor air than designed.
- EPA’s BASE study collected data from 100 randomly selected public and commercial office buildings in 37 cities and 25 states (EPA, Jun 2026).
- Ninety-seven of the 100 study spaces were mechanically ventilated (EPA Building Assessment Survey, Apr 2026).
- Design minimum outdoor airflows were available for only about one-half of the air handlers (EPA Building Assessment Survey, Apr 2026).
- About 17 percent of ventilation measurements were below the 20 cfm per person recommended for offices in ASHRAE 62-2001 (EPA Building Assessment Survey, Apr 2026).
- About 40 percent of systems with design data had measured outdoor airflows less than design (EPA Building Assessment Survey, Apr 2026).
- Over seventy percent of the study spaces had economizers for free cooling (EPA Building Assessment Survey, Apr 2026).
How much fresh air do homes get?
Less than the code says, because the fans are often off.
- In 70 new California homes built to code, the dwelling-unit ventilation fan moved on average 50% more airflow than the minimum requirement (Berkeley Lab, Apr 2020).
- Mean indoor formaldehyde was 44% lower, and PM2.5 44% lower, than in a 2006 to 2007 study of California homes built in 2002 to 2005 (Berkeley Lab, Apr 2020).
- In a study of 51 recently built homes in Florida, Georgia and South Carolina, most homes could not meet ASHRAE 62.2 requirements (U.S. Department of Energy, Aug 2024).
- Properly working whole-house mechanical ventilation cut carbon dioxide by 30% and formaldehyde by 7% in that study (U.S. Department of Energy, Aug 2024).
- ASHRAE 62.2 sets total home ventilation at 0.03 cfm per square foot of floor area plus 7.5 cfm times the number of bedrooms plus one (ASHRAE Addendum n to Standard 62.2-2010, Jan 2012).
Outdoor air is also a load. Every cfm brought in has to be heated or cooled, so the ventilation rate belongs in the sizing math. A free BTU calculator is a quick way to see how a room’s load changes.
What carbon dioxide level shows good ventilation?
Below about 800 ppm is one working target.
- CDC and NIOSH name CO2 readings below 800 ppm as one potential target for good ventilation (CDC NIOSH, Oct 2024).
- ASHRAE Standard 241, “Control of Infectious Aerosols,” was published in July 2023 (CDC NIOSH, Oct 2024).
- A peak CO2 above roughly 1,000 ppm indicates a ventilation rate below 7 L/s (15 cfm) per occupant (Berkeley Lab, The Ventilation Problem in Schools, Jul 2017).
How are schools doing?
Many are behind on the equipment that moves the air.
- About 54 percent of public school districts need to update or replace multiple building systems or features (GAO, Jun 2020).
- In 51 classrooms in one school district, median ventilation rates were only 2.6 L/s per occupant (Berkeley Lab, The Ventilation Problem in Schools, Jul 2017).
- In 100 fifth-grade classrooms in the U.S. Southwest, the average CO2 concentration was 1,780 ppm (Berkeley Lab, The Ventilation Problem in Schools, Jul 2017).
- Maximum peak CO2 in studied classrooms ranged from about 3,000 to 6,000 ppm (Berkeley Lab, The Ventilation Problem in Schools, Jul 2017).
- In 2012, 47.7% of school districts had an indoor air quality management program (EPA, Aug 2026).
How Well Do Filters and Air Cleaners Work?
A filter only helps while air moves through it, so how often the system runs matters as much as the rating. Portable cleaners fill the gap, and the best evidence for them is strong.
How much do furnace and HVAC filters clean the air?
Only while the fan is on.
- Filters with a MERV of 13 and above must show at least 50% removal efficiency for the smallest particles tested (EPA, Oct 2026).
- HEPA filters can theoretically remove at least 99.97% of airborne particles 0.3 micron in size (EPA, Jan 2026).
A higher-rated filter adds airflow resistance. Before a customer upgrades to MERV 13, check the duct and fan with a ductulator.
How well do portable air cleaners work in real homes?
Very well in the room they sit in, and still well next door.
- In a randomized crossover study of 29 homes, a HEPA portable air cleaner cut mean PM2.5 by 78.8% in the room it sat in (CDC, Jan 2024).
- PM10 fell 63.9% in the same rooms (CDC, Jan 2024).
- In secondary rooms, PM2.5 fell 57.9% and PM10 fell 60.4% (CDC, Jan 2024).
- Two HEPA air cleaners placed near an aerosol source reduced exposure of nearby people by up to 65% in a conference room test (CDC MMWR, Jul 2021).
- Adding universal masking to the HEPA cleaners cut exposure by up to 90% (CDC MMWR, Jul 2021).
Can a box fan and a filter do the job?
Yes, and small changes make it much better.
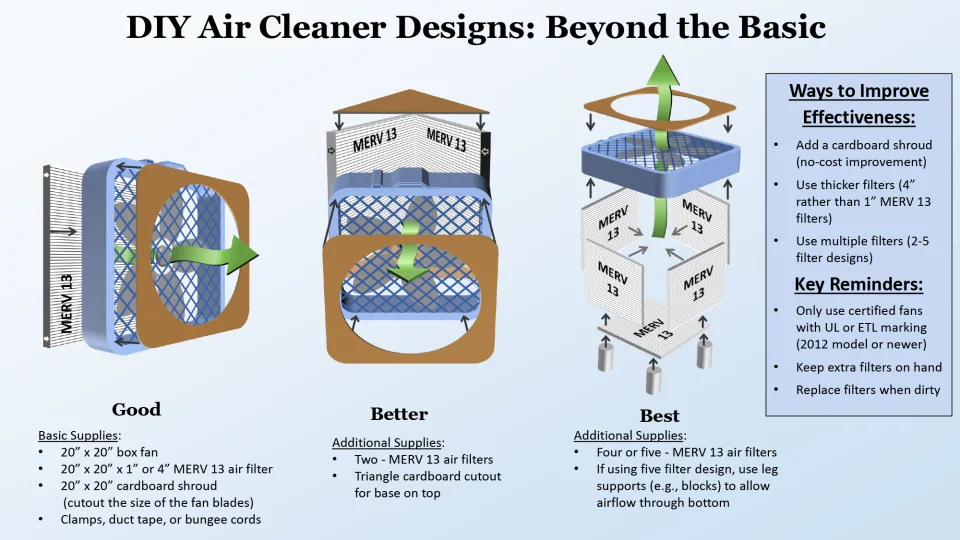
- A cardboard shroud raises the clean air delivery rate of a DIY air cleaner by 40% with no change in cost or footprint (EPA, Jul 2026).
- EPA reports that a single 4-inch MERV 13 filter increased the clean air delivery rate by 123% (EPA, Jul 2026).
Which air cleaners should be avoided?
Any that make ozone on purpose.
- No federal government agency has approved ozone generators sold as air cleaners for use in occupied spaces (EPA, Oct 2026).
Does Better Air Improve Work and Learning?
Yes, and the effect is measurable at normal office levels of CO2, not only in extreme cases. EPA lists productivity and student performance as active research areas for indoor air, and several controlled studies now put numbers on it.
How much do ventilation and VOCs change cognitive scores?
By a wide margin in a controlled test.
- Twenty-four participants spent six full workdays in an environmentally controlled office space under different conditions (Environmental Health Perspectives, Oct 2015).
- Strategy scores were 183% higher on the green day and 288% higher on the enhanced ventilation days than on the conventional day (Environmental Health Perspectives, Oct 2015).
What does carbon dioxide do to decisions?
It lowers scores well below the levels seen as dangerous.
- Twenty-two participants were exposed to CO2 at 600, 1,000 and 2,500 ppm in an office-like chamber (Environmental Health Perspectives, Sep 2012).
- At 2,500 ppm, large and statistically significant reductions occurred in seven of nine decision-making scales (Environmental Health Perspectives, Sep 2012).
How much do particles and CO2 slow office workers?
By single-digit percentages for each small step up.
- The Global CogFx study followed 302 office workers in six countries: China, India, Mexico, Thailand, the UK and the US (Harvard Healthy Buildings, Sep 2021).
- Response times were 0.8 to 0.9% slower for every 10 micrograms per cubic meter increase in PM2.5 (Harvard Healthy Buildings, Sep 2021).
- Throughput, or correct responses per minute, was 0.8 to 1.7% lower for the same PM2.5 increase (Harvard Healthy Buildings, Sep 2021).
- For every 500 ppm increase in CO2, response times were 1.4 to 1.8% slower (Harvard Healthy Buildings, Sep 2021).
- For the same CO2 increase, throughput was 2.1 to 2.4% lower, and the team found no lower threshold at which effects from low ventilation disappear (Harvard Healthy Buildings, Sep 2021).
What does EPA say about productivity and indoor air?
That doubling a low ventilation rate can lift school results by about 8 percent.
- One study showed that doubling the ventilation rate from about 7.5 to 15 cfm per person improved academic performance by about 8 percent (EPA, Mar 2026).
- A review of 30 green schools found they cost on average 2% more than conventional schools, with financial benefits about 20 times greater than that extra cost (EPA, Mar 2026).
What is better air worth in dollars?
Billions a year, with short paybacks.
- Poor indoor air quality can lower office work performance by as much as 6 to 9 percent, and labor costs per unit of floor area keep payback times as low as 2 years (Indoor Air, Wyon, Aug 2004).
- Berkeley Lab estimated potential U.S. savings and productivity gains of $6 to $14 billion a year from reduced respiratory disease (Berkeley Lab, Fisk, Nov 2000).
- It estimated $1 to $4 billion a year from reduced allergies and asthma (Berkeley Lab, Fisk, Nov 2000).
- It estimated $10 to $30 billion a year from reduced sick building syndrome symptoms (Berkeley Lab, Fisk, Nov 2000).
- It estimated $20 to $160 billion a year from direct improvements in worker performance unrelated to health (Berkeley Lab, Fisk, Nov 2000).
- An earlier estimate found that the potential financial benefits of better indoor environments exceed costs by a factor of 18 to 47 (Berkeley Lab, Fisk and Rosenfeld, Sep 1997).
Do students learn and attend more with more fresh air?
Yes, by a few percent for each step up.
- In a study of fifth-grade classrooms, 87 had ventilation rates below the 15 cfm per student minimum of the standard in force at the time (Berkeley Lab, The Ventilation Problem in Schools, Jul 2017).
- In those 87 classrooms, the share of students passing math rose 2.9% and the share passing reading rose 2.7% with higher ventilation (Berkeley Lab, The Ventilation Problem in Schools, Jul 2017).
- A two-year study of 162 classrooms found a 1.6% drop in student absence for each 1 L/s per person increase in ventilation (Berkeley Lab, The Ventilation Problem in Schools, Jul 2017).
- Raising school ventilation costs a net of a few dollars to about ten dollars per person a year, less than 0.1% of typical public spending on elementary and secondary education (Berkeley Lab, The Ventilation Problem in Schools, Jul 2017).
For the energy side of ventilation and filtration, see HVAC energy consumption statistics.
Glossary
- ACH: air changes per hour, how many times the air in a room is replaced each hour.
- ASHRAE: the American Society of Heating, Refrigerating and Air-Conditioning Engineers, which writes ventilation standards.
- BASE: EPA’s Building Assessment Survey and Evaluation study of 100 office buildings.
- CADR: clean air delivery rate, how much clean air a portable air cleaner makes.
- cfm: cubic feet per minute, a measure of airflow.
- COPD: chronic obstructive pulmonary disease, a lung disease that worsens over time.
- HEPA: high efficiency particulate air, a filter type rated to remove at least 99.97% of 0.3 micron particles.
- MERV: Minimum Efficiency Reporting Value, the rating of a filter.
- NO2: nitrogen dioxide, a gas given off by gas stoves.
- pCi/L: picocuries per liter, the unit for radon in air.
- PM2.5: fine particles 2.5 micrometers or smaller.
- ppm / ppb: parts per million / parts per billion.
- VOC: volatile organic compound, a chemical that evaporates into room air.
Methodology and Sources
Every statistic comes from the agency, laboratory, journal or international body that produced it, and each link points to that source document, not to a roundup. Each page was opened and checked for the number and its date before it went in. Where a source reports a range or a confidence interval, the headline figure is used. Figures from different studies are never blended into one claim, and each figure appears once on the page. This page is refreshed monthly, and newer releases replace older figures when they appear.
Sources
- EPA, Report on the Environment: Indoor Air Quality
- EPA, Report on the Environment: Radon, Homes At or Above EPA’s Action Level
- EPA, Health Risk of Radon
- EPA, Indoor Air Quality Exposure and Characterization Research
- EPA, Volatile Organic Compounds’ Impact on Indoor Air Quality
- EPA, What should I know about formaldehyde and indoor air quality
- EPA, Sources of Indoor Particulate Matter
- EPA, Guide to Air Cleaners in the Home
- EPA, What is a HEPA filter
- EPA, Research on DIY Air Cleaners to Reduce Wildfire Smoke Indoors
- EPA, BASE Study
- EPA, BASE Summarized Data
- EPA, BASE Highlighted Analysis
- EPA, Why Indoor Air Quality is Important to Schools
- EPA, Reference Guide for Indoor Air Quality in Schools
- EPA, Take Action to Improve Indoor Air Quality in Schools
- EPA, Making the Business Case for Energy Savings Plus Health
- CDC, Radon and Your Health
- CDC NCHS, Data Brief No. 396
- CDC NCHS, Data Brief No. 529
- CDC, Health Problems Caused by Secondhand Smoke
- CDC, About Secondhand Smoke
- CDC, Most Recent Asthma Data
- CDC NIOSH, Ventilation FAQs
- CDC MMWR, Efficacy of Portable Air Cleaners and Masking
- CDC, Real-World Effectiveness of Portable Air Cleaners in Reducing Home Particulate Matter
- WHO, Household air pollution
- World Bank, Tracking SDG 7: The Energy Progress Report 2026
- State of Global Air, Household Air Pollution
- IHME, Air pollution accounted for 8.1 million deaths globally in 2021
- IHME Global Burden of Disease via Our World in Data, Household air pollution deaths by region
- BLS, American Time Use Survey 2025
- BLS, American Time Use Survey Table 6
- Journal of Exposure Science & Environmental Epidemiology, NHAPS
- NOAA Chemical Sciences Laboratory, Household chemicals and urban air pollution
- Journal of Allergy and Clinical Immunology, House dust mite allergen in US beds
- Berkeley Lab, Factors Impacting Range Hood Use in California Houses and Low-Income Apartments
- Berkeley Lab, Indoor Air Quality in California Homes with Code-Required Mechanical Ventilation
- Berkeley Lab, The Ventilation Problem in Schools
- Berkeley Lab, Health and Productivity Gains from Better Indoor Environments
- Berkeley Lab, Estimates of Improved Productivity and Health from Better Indoor Environments
- International Journal of Environmental Research and Public Health, Population Attributable Fraction of Gas Stoves and Childhood Asthma
- International Journal of Epidemiology, Meta-analysis of indoor NO2 and gas cooking
- Science Advances, NO2 exposure from gas and propane stoves
- U.S. Department of Energy, Ventilation and Indoor Air Quality in Recently Constructed U.S. Homes
- ASHRAE, Addendum n to Standard 62.2-2010
- GAO, K-12 Education: School Districts Frequently Identified Multiple Building Systems Needing Updates or Replacement
- Asthma and Allergy Foundation of America, Asthma Facts
- Environmental Health Perspectives, Allen et al. 2015
- Environmental Health Perspectives, Satish et al. 2012
- Harvard Healthy Buildings, Impacts of Indoor Air Quality on Cognitive Function
- Indoor Air, Wyon 2004