Natural gas statistics for 2026 tell two stories at once. The supply side is at record highs, with U.S. output and exports breaking records month after month. The home side is about cold weather, equipment and bills, where a few degrees of winter decide how much gas a household burns.
This page collects dated figures from the U.S. Energy Information Administration, the International Energy Agency, federal safety and statistics agencies, Eurostat and peer-reviewed research. Every number links to the document that produced it. The sections run from supply and demand to home heating, prices, emissions, LNG, world markets and pipeline safety.
It is a companion to the HVAC energy consumption overview. Use it to check a claim before you repeat it, to explain a gas bill to a customer, or to judge how much heat a gas-fired home needs. Each stat appears once, so scan the headings for the question you need. The figures are refreshed every month.
Key Takeaways
- U.S. natural gas consumption averaged a record 92.0 billion cubic feet per day (Bcf/d) in 2025 (EIA, Mar 2026).
- Gross withdrawals of U.S. natural gas reached a record 137 Bcf/d in July 2026 (EIA, Oct 2026).
- Natural gas was the main heating fuel in 62.71 million U.S. homes in 2020, or 51% of all homes (EIA, Mar 2023).
- U.S. households that use natural gas burned an average of 56.6 million Btu of it in 2020 (EIA, Mar 2024).
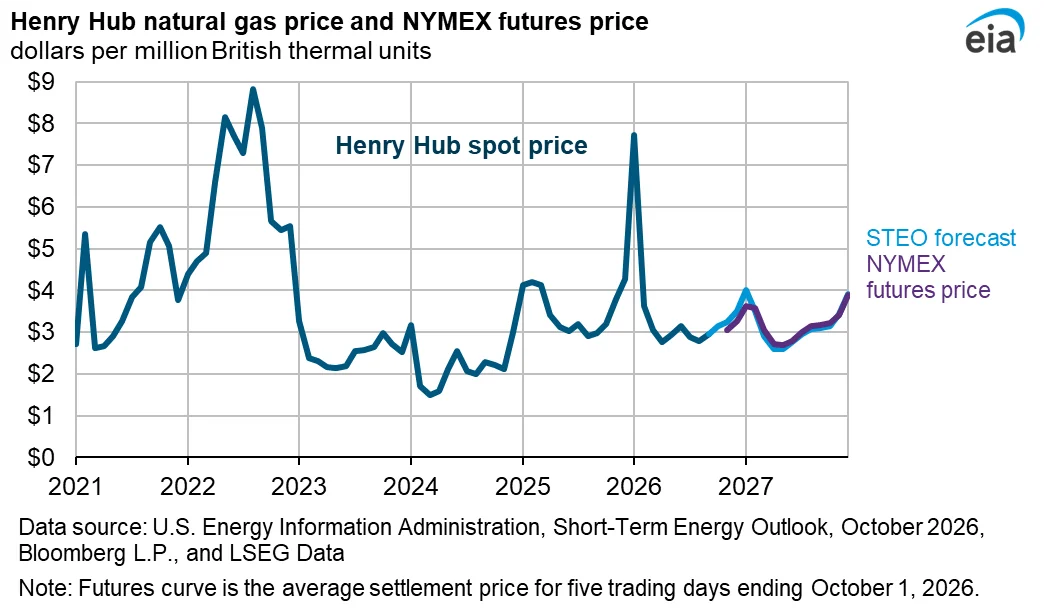
- The Henry Hub spot price averaged $7.72 per million Btu in January 2026 after Winter Storm Fern raised heating demand (EIA, Oct 2026).
- The natural gas index in the Consumer Price Index rose 5.0% over the 12 months ending September 2026 (BLS, Oct 2026).
- Households that heat with natural gas were expected to see heating costs rise 9.5% in the 2025 to 2026 winter (NEADA, Feb 2026).
- The United States supplied 56.0% of the EU’s imported LNG in 2025 (Eurostat, Mar 2026).
- The Strait of Hormuz carried almost 20% of global LNG supply before it effectively closed at the end of February 2026 (IEA, Jul 2026).
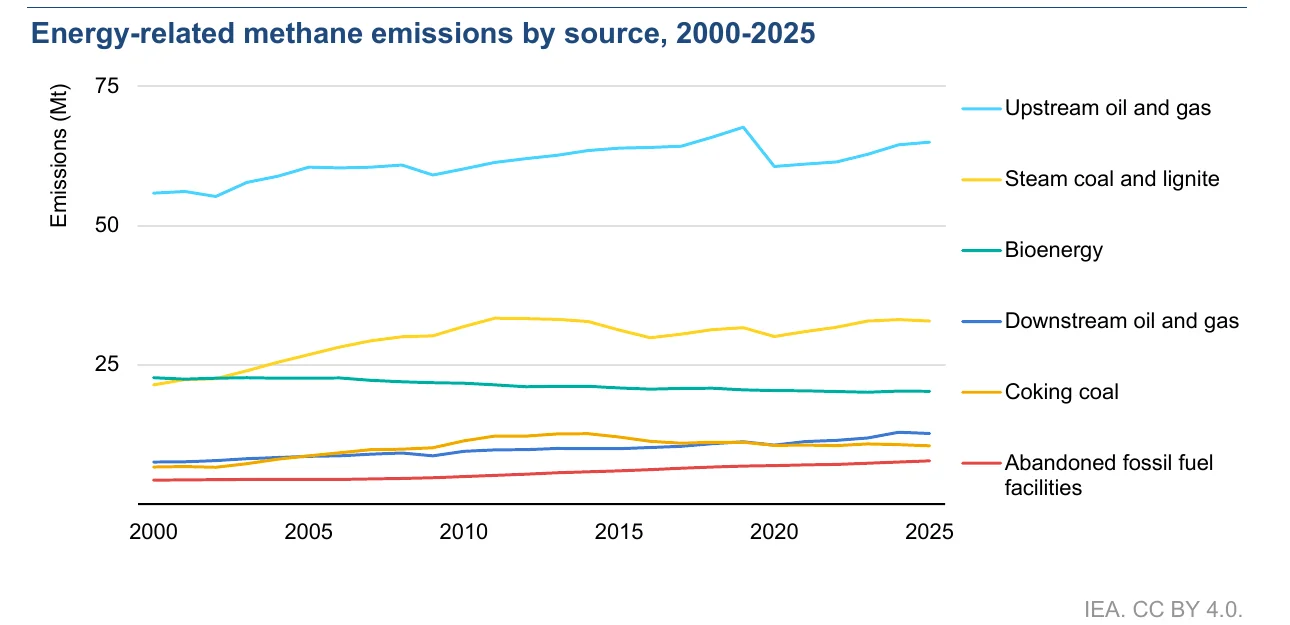
- Natural gas operations caused 36 million tonnes of methane emissions a year, against 45 million tonnes from oil and 43 million tonnes from coal (IEA, May 2026).
- Stanford researchers estimated that methane leaking from U.S. gas stoves has a climate effect equal to the CO2 from about 500,000 gasoline cars (Stanford University, Jan 2022).
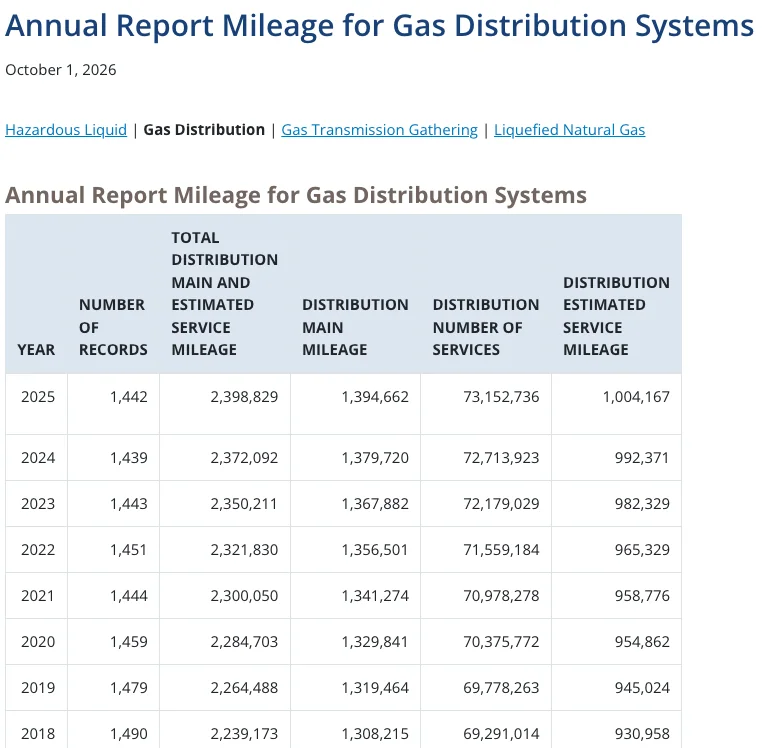
- U.S. gas distribution systems reported 1,394,662 miles of main in 2025 (PHMSA, Oct 2026).
- Home structure fires involving natural gas or LP gas numbered 9,171 in 2022 and caused 84 civilian deaths (NFPA, Oct 2024).
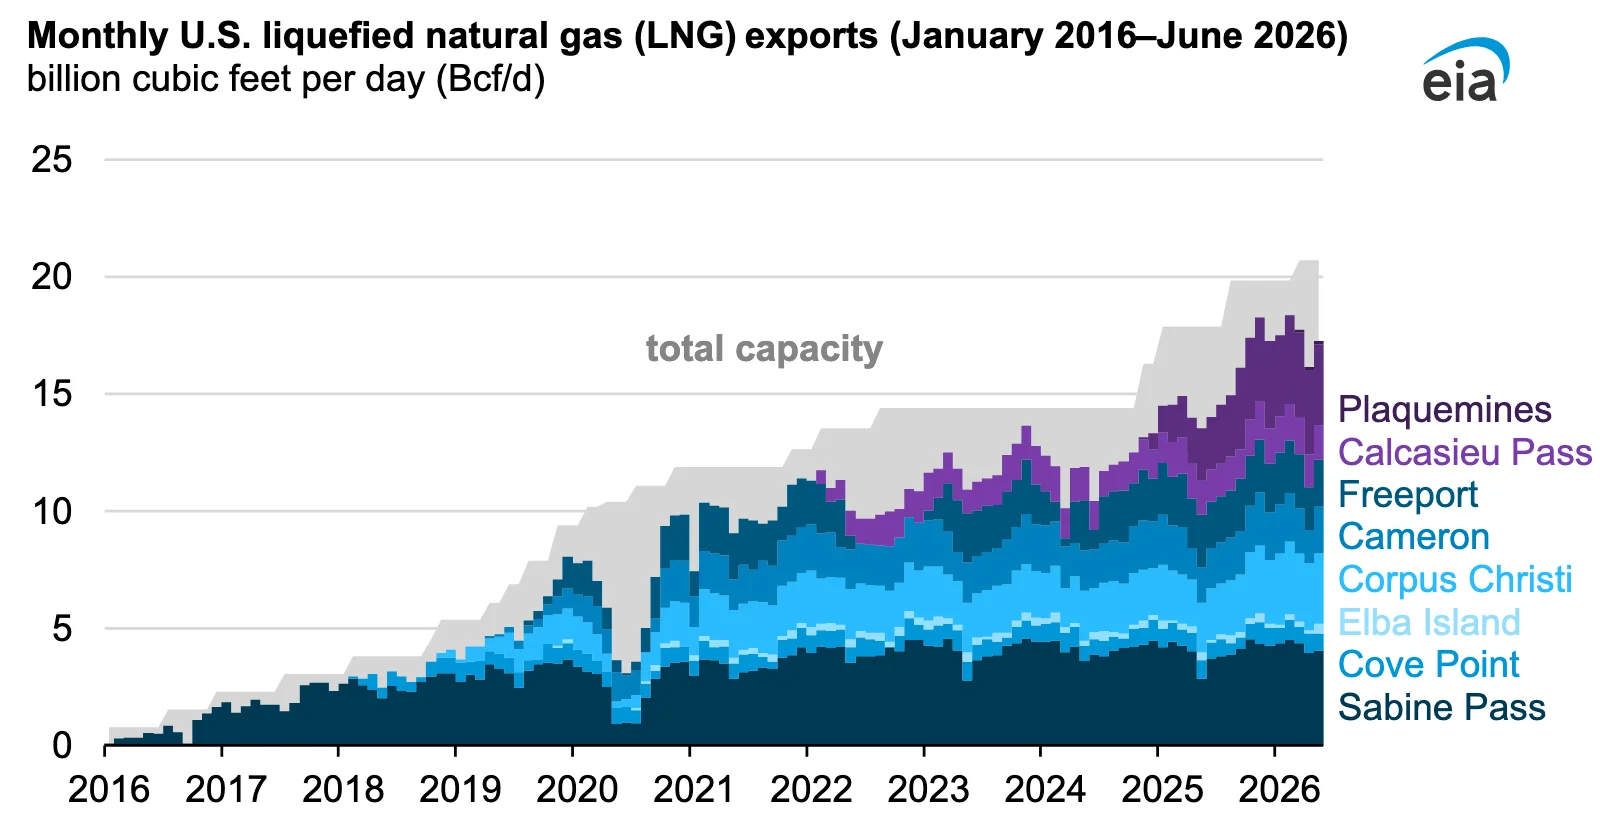
- U.S. LNG exports averaged 17.4 Bcf/d in the first half of 2026, 23% more than a year earlier (EIA, Sep 2026).
How much natural gas does the United States produce?
The United States now makes more gas than any year on record, and three regions do most of the work. That supply is the reason wholesale prices stayed low through a hot summer.
Where does U.S. gas production come from?
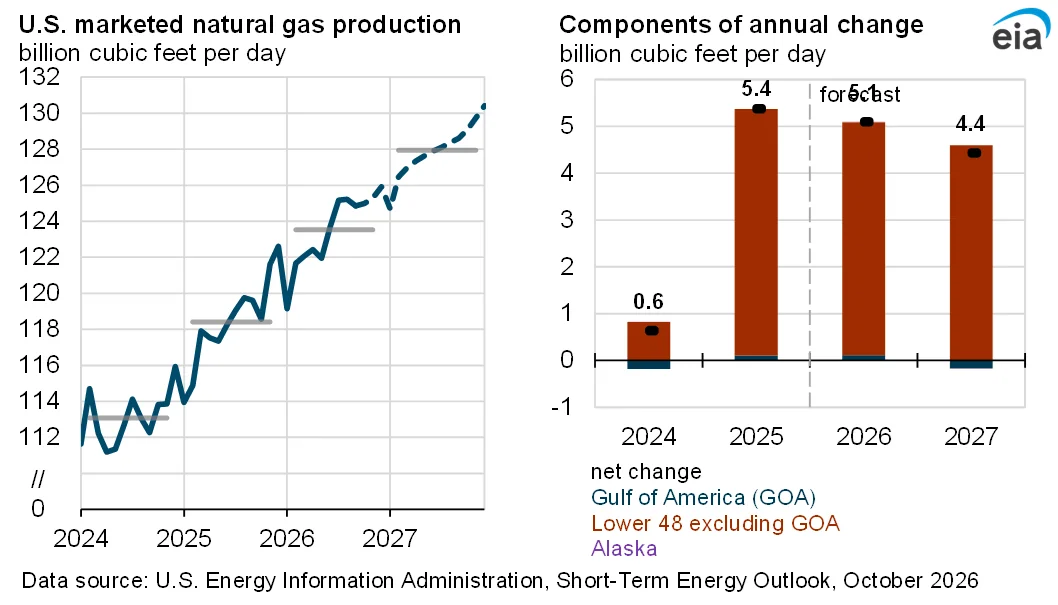
Marketed gas production reached a record 118.5 Bcf/d in 2025, up 5.3 Bcf/d from 2024 (EIA, Mar 2026).
- Appalachia, the Permian and Haynesville made up 67% of 2025 marketed production and 81% of the growth (EIA, Mar 2026).
- Appalachia is the largest region, at 36.6 Bcf/d or 31% of the total (EIA, Mar 2026).
- The Permian produced 27.7 Bcf/d in 2025, up 11%, mostly as gas that comes up with oil (EIA, Mar 2026).
- Permian output rose 6.5% in the first half of 2026 compared with a year earlier (IEA, Jul 2026).
Is U.S. production still growing in 2026?
Marketed production averaged 121.3 Bcf/d in the first half of 2026, which is 4% above the same months of 2025 (EIA, Aug 2026).
- EIA forecasts dry gas production of 112.20 Bcf/d in 2026 and 116.13 Bcf/d in 2027 (EIA, Oct 2026).
- The IEA expects U.S. dry gas production to grow by about 3% in 2026 (IEA, Jul 2026).
- Proved reserves of U.S. natural gas fell 3% to 583.9 trillion cubic feet (Tcf) at the end of 2024 (EIA, Apr 2026).
How full is gas storage going into winter?
The United States held 3,523 billion cubic feet (Bcf) of gas in storage at the end of September 2026, and EIA forecasts 3,850 Bcf at the end of October (EIA, Oct 2026).
- U.S. storage levels stayed above average through June and level with the year before (IEA, Jul 2026).
Who uses the most natural gas in the United States?
Power plants and factories burn more gas than homes do, but homes set the winter peak. That makes heating the part of demand that moves with the weather.
Which sectors burn the most gas?
The United States consumed 32.50 trillion cubic feet of gas in 2023, about 36% of all primary energy used (EIA, Oct 2024).
- The electric power sector took about 40% of U.S. gas consumption in 2023 (EIA, Oct 2024).
- Industry took about 32% (EIA, Oct 2024).
- Homes took about 14% (EIA, Oct 2024).
How much did each sector use in 2025?
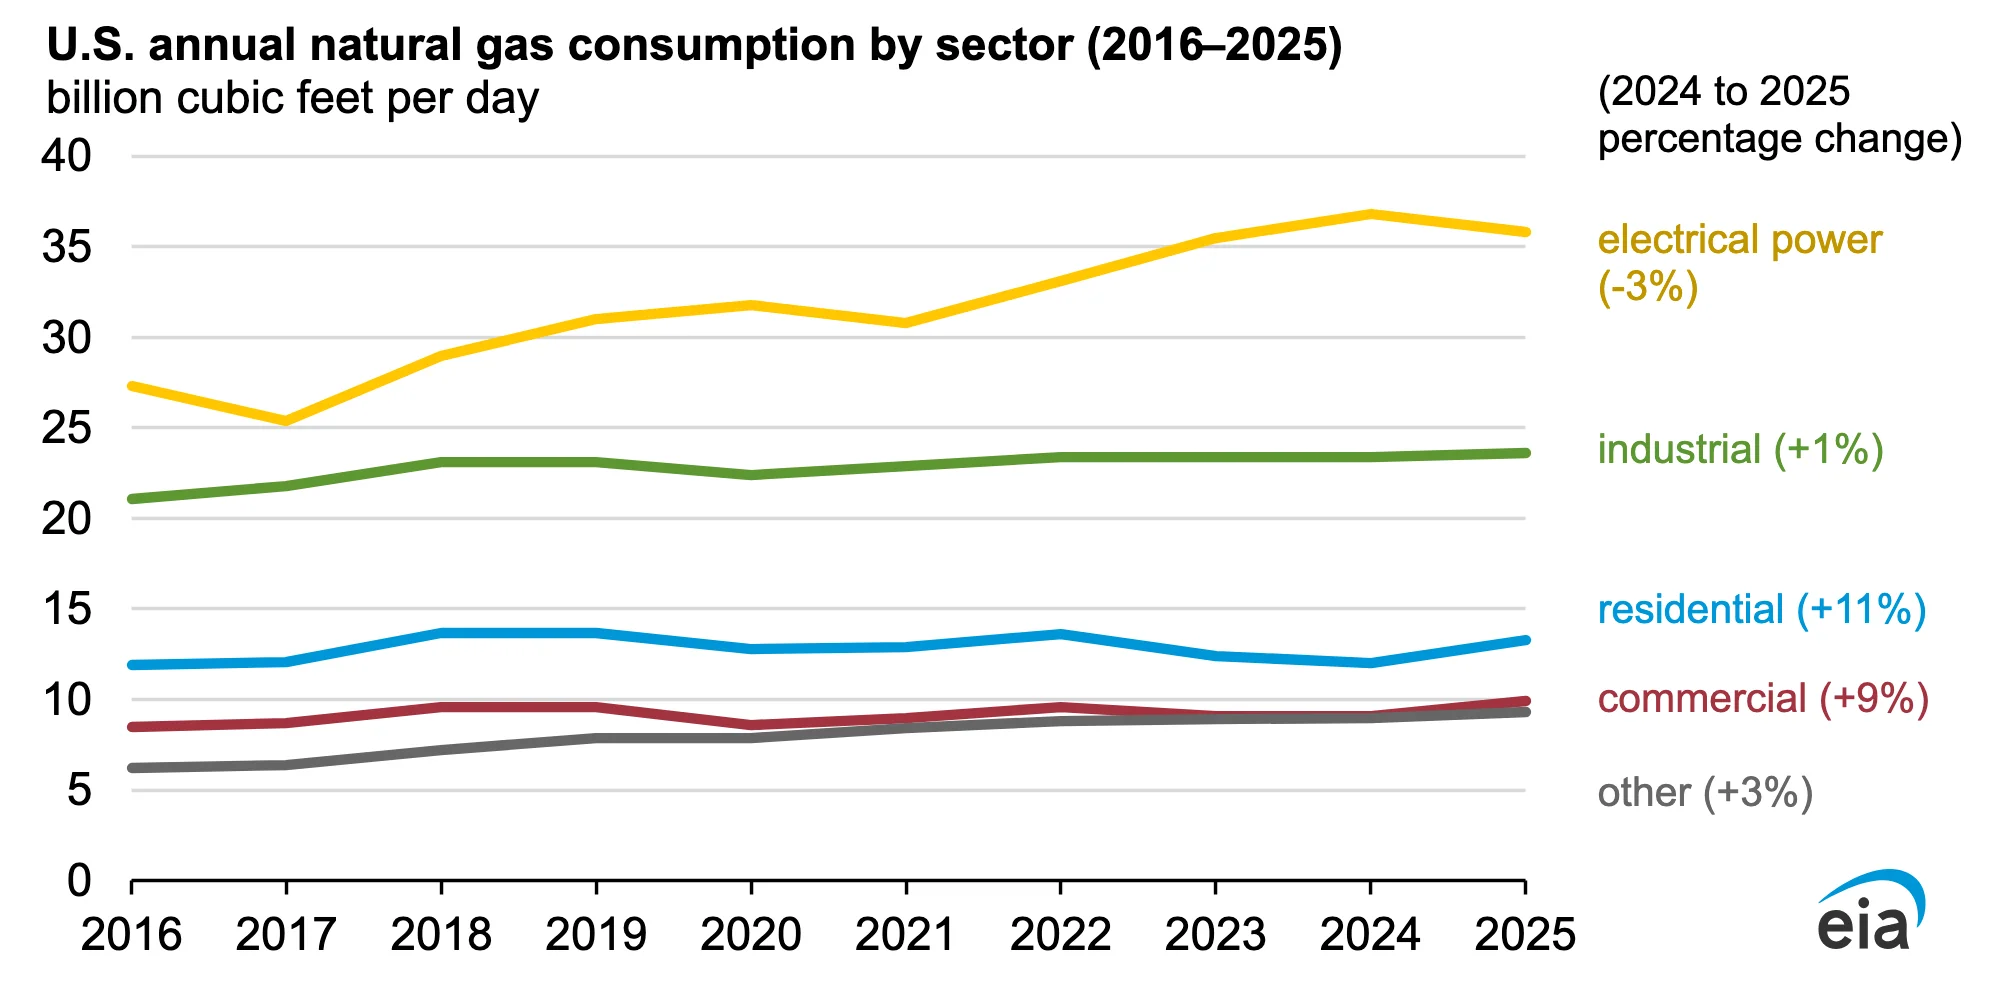
Residential gas use averaged 13.3 Bcf/d in 2025, up 11% from 2024 because of a colder winter (EIA, Mar 2026).
- January 2025 set a winter monthly record of 126.6 Bcf/d (EIA, Mar 2026).
- Gas burned for electricity grew from 27.3 Bcf/d in 2016 to 35.8 Bcf/d in 2025 (EIA, Mar 2026).
- Industrial use set a record of 23.6 Bcf/d in 2025, 1% above the 2023 record (EIA, May 2026).
How much does weather change demand?
Heating degree days in the first and fourth quarters of 2025 ran nearly 9% above 2024, and gas use in buildings rose by around 9% (IEA, Apr 2026).
- Total U.S. gas consumption rose just over 1% in 2025 (IEA, Apr 2026).
- Gas demand in the U.S. power sector fell by around 3.5% in 2025 as higher prices pushed some plants to coal (IEA, Apr 2026).
- July 2026 averaged 76.9°F across the contiguous U.S., the warmest month on record (NOAA, Aug 2026).
- EIA forecasts consumption of 92.37 Bcf/d in 2026 and 93.83 Bcf/d in 2027 (EIA, Oct 2026).
How many homes use natural gas for heating?
Gas is still the most common main heating fuel in American homes, but the map is uneven. Cold states lean on it and the Deep South barely does. For the full fuel mix, see the heating and furnace pages.
Which regions and states heat with gas?
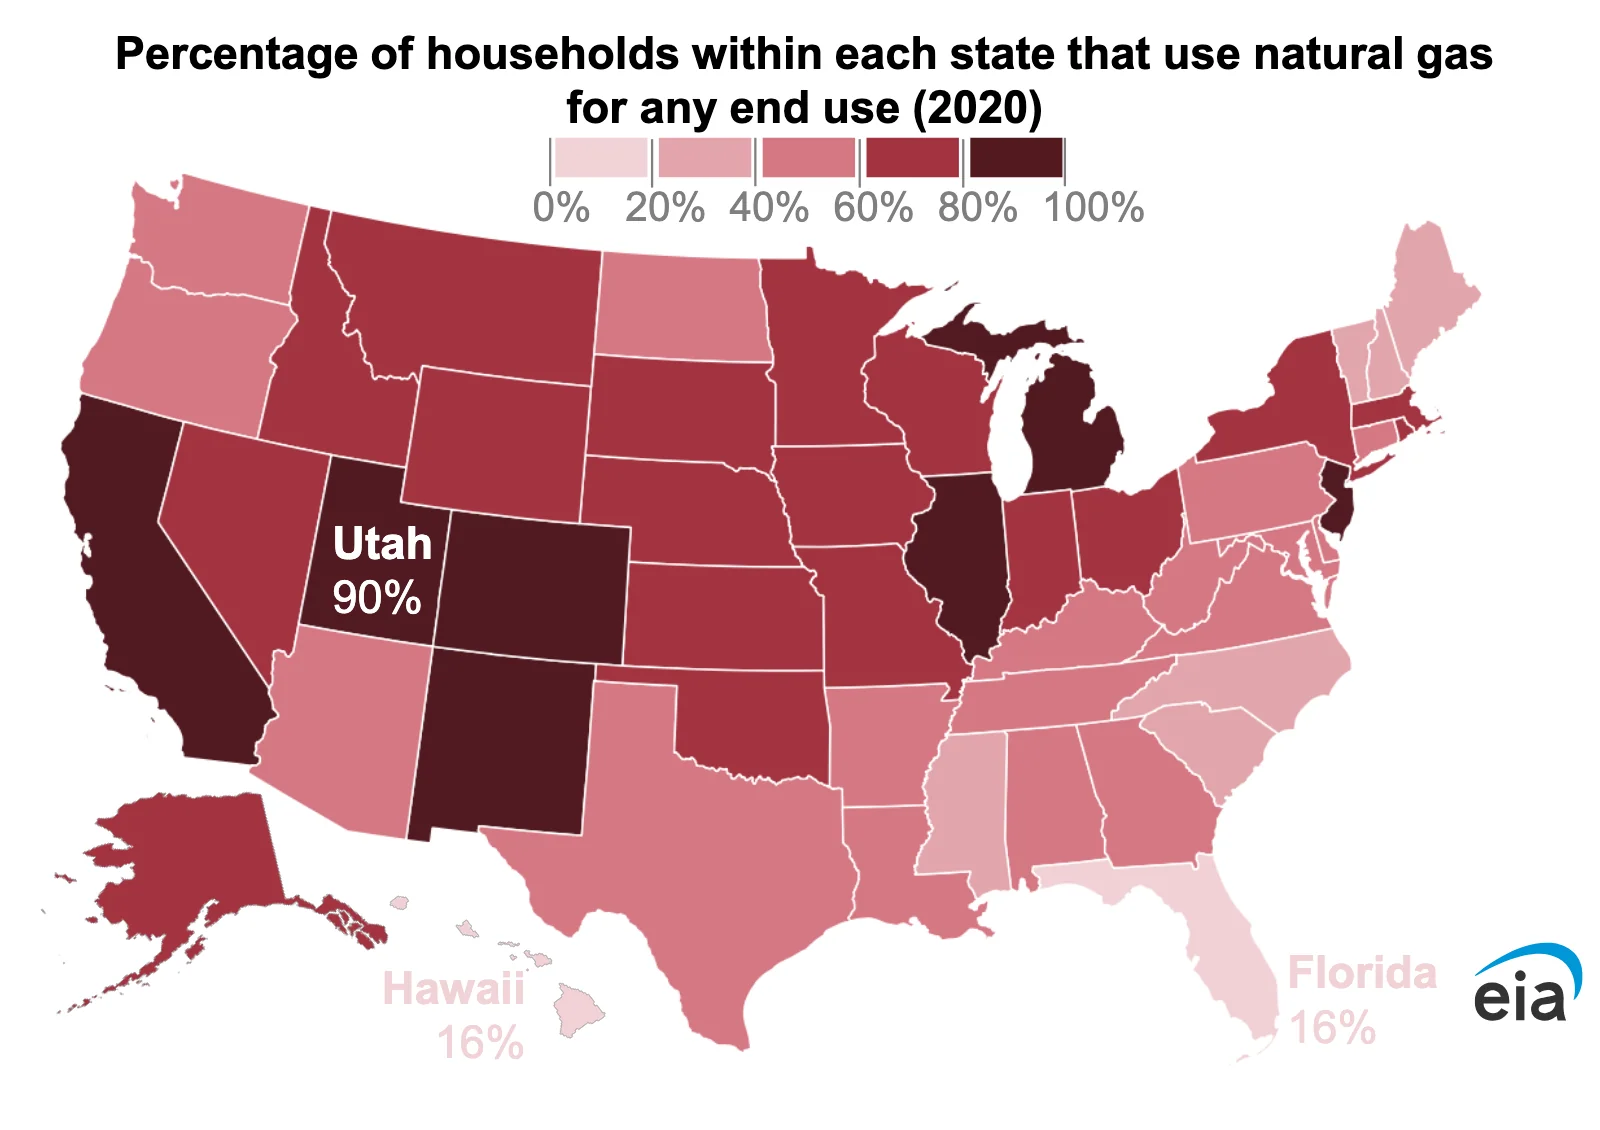
The Midwest and the West each had 74% of households using gas for at least one purpose in 2020, against 43% in the South (EIA, Mar 2023).
- Space heating with gas reached 70% of households in the Midwest and 60% in the West, but only 35% in the South (EIA, Mar 2023).
- Gas use for any purpose ran from 90% of households in Utah to 16% in Florida and Hawaii (EIA, Mar 2023).
- Gas was the main heating fuel in 78% of Illinois homes and 77% of Michigan homes (EIA, Mar 2023).
- It was the main heating fuel in 42% of Texas homes and 5% of Florida homes (EIA, Mar 2023).
What equipment burns the gas?
A central warm-air furnace was the main heating system in 53.26 million gas-heated homes in 2020 (EIA, Mar 2023).
- Another 6.51 million gas-heated homes used a steam or hot water system, and 2.77 million used a built-in room heater (EIA, Mar 2023).
- Gas fueled the main water heater in 59.33 million homes, ahead of electricity at 57.04 million (EIA, Mar 2023).
Sizing a gas furnace to the real heat loss of the house is the step that decides comfort and fuel use, and the furnace sizing calculator gives a first estimate.
How common is gas in homes abroad?
Italian households got 49.2% of their final energy from natural gas in 2024 (Eurostat, Jun 2026).
- Hungary relied on gas for 46.3% of household energy (Eurostat, Jun 2026).
- Luxembourg relied on gas for 46.0% (Eurostat, Jun 2026).
How much natural gas does a home use, and what does it cost?
A gas bill follows the thermostat. The coldest regions burn the most gas, and the price per unit is well above its 2020 level.
How much gas does a household burn each year?
Households in the Midwest that used gas burned an average of 76.1 million Btu in 2020, against 43.4 million Btu in the South (EIA, Mar 2024).
- U.S. homes used 4,241 trillion Btu of natural gas in 2020 and 4,453 trillion Btu of electricity (EIA, Mar 2024).
- Water heating took 1,081 trillion Btu of that gas (EIA, Mar 2024).
- Homes in very cold and cold climates used 2,203 trillion Btu of gas, more than half of the national total (EIA, Mar 2024).
A load calculation turns those averages into the right number for one house, and the BTU calculator is the quick way to start.
What does a household pay?
The average residential gas price rose from $10.78 per thousand cubic feet in 2020 to $15.40 in 2023 (EIA, Sep 2026).
- Homes whose main heating fuel is natural gas spent about $1,950 a year on all household energy in 2020, against $2,670 for propane homes and $2,930 for heating oil homes (EIA, Oct 2025).
- Households were expected to spend an average of $1,011 on heating in the 2025 to 2026 winter, $100 more than the winter before (NEADA, Feb 2026).
- NEADA put the projected rise in winter heating costs at 11.0%, more than four times the rate of inflation (NEADA, Feb 2026).
- The overall energy index in the Consumer Price Index rose 20.4% over the 12 months ending September 2026, mostly because gasoline rose 34.2% (BLS, Oct 2026).
- The natural gas index fell 0.3% in September 2026 alone (BLS, Oct 2026).
- In 2020, 34 million U.S. households, or 27%, reported trouble paying energy bills or keeping the home at a safe temperature (EIA, Apr 2022).
What do natural gas prices look like in 2026?
Wholesale gas had a cold January spike and then a cheap summer. The lesson for a bill is that weather and storage move the price.
What has the Henry Hub price done since 2022?
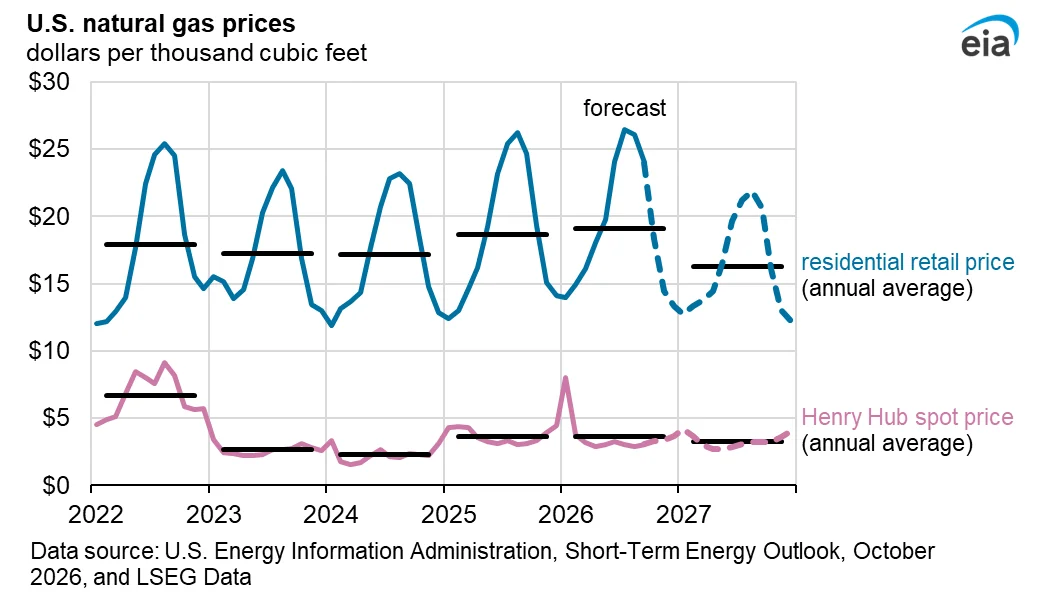
The Henry Hub spot price averaged $6.45 per million Btu in 2022, fell to $2.19 in 2024, and recovered to $3.52 in 2025 (EIA, Oct 2026).
- The 2025 average was 56% above 2024, whose inflation-adjusted average was the lowest on record (EIA, Jan 2026).
How did gas trade in summer 2026?
Henry Hub averaged $2.93 per million Btu from June through August 2026, 6% below the summer before (EIA, Sep 2026).
- Solar generation was about 19.4 billion kWh higher than in summer 2025, which held back gas burn (EIA, Sep 2026).
- Henry Hub averaged $2.95 per million Btu in the second quarter of 2026, down 7.5% from a year earlier (IEA, Jul 2026).
Where are prices headed?
EIA forecasts a Henry Hub average of $3.48 per million Btu for 2026 and $3.16 for 2027 (EIA, Oct 2026).
- The 2027 monthly path runs from a low of $2.60 in April and May to $3.90 in December (EIA, Oct 2026).
- Forward curves in late June pointed to a 2026 Henry Hub average just above $3.5 per million Btu (IEA, Jul 2026).
What do emissions from natural gas look like?
Gas burns cleaner than coal or oil, and it still carries a climate cost at the stove, in the pipe and at the wellhead. Methane leaks are where the debate sits. The health side of gas cooking is covered on the indoor air quality page.
How much carbon dioxide does burning gas release?
Burning one million Btu of natural gas releases 53.06 kilograms of CO2, against 70.22 kilograms for motor gasoline (EPA, Jan 2025).
- The same factor sheet lists 1.0 gram of methane and 0.10 gram of nitrous oxide per million Btu of gas (EPA, Jan 2025).
- Coal produces more than 200 pounds of CO2 per million Btu and fuel oil more than 160 pounds (EIA, Apr 2024).
- Burning gas for energy caused about 35% of U.S. energy-related CO2 emissions in 2022 (EIA, Apr 2024).
How much methane leaks from the gas system?
The energy sector emitted nearly 150 million tonnes of methane in 2025, around 40% of methane from human activity (IEA, May 2026).
- Methane concentrations are 2.7 times higher than before the Industrial Revolution, and methane drove nearly 30% of the rise in global average temperature (IEA, May 2026).
- EPA estimated that methane from natural gas, petroleum and abandoned wells was about 33% of U.S. methane and 4% of U.S. greenhouse gases in 2021 (EIA, Apr 2024).
- Methane reported by U.S. petroleum and natural gas facilities fell from 83.7 million metric tons of CO2 equivalent in 2011 to 60.4 million in 2023 (EPA, Aug 2024).
- The 10 largest emitters produced more than 85 million tonnes of fossil-fuel methane in 2025, led by China, the United States and Russia (IEA, May 2026).
- The best oil and gas producers score more than 100 times better on methane intensity than the worst (IEA, May 2026).
- Average upstream methane intensity of oil and gas production has fallen around 10% since 2019 (IEA, May 2026).
- 159 countries plus the European Union have joined the Global Methane Pledge to cut methane 30% by 2030 (IEA, May 2026).
- Nearly 100 billion cubic metres of gas a year could reach the market if oil and gas methane were cut worldwide (IEA, May 2026).
What do gas stoves add inside the home?
Gas stoves emit up to 1.3% of the gas they use as unburned methane (Stanford University, Jan 2022).
- More than 40 million U.S. homes cook with gas (Stanford University, Jan 2022).
- Over three-quarters of stove methane emissions occur while the stove is off (PSE Healthy Energy, Jan 2022).
- Lighting a burner releases as much methane as about 10 minutes of burner use (PSE Healthy Energy, Jan 2022).
- Home cooks use range hoods only 25% to 40% of the time on average (Stanford University, Jan 2022).
How much LNG does the United States export?
U.S. liquefied natural gas exports have grown fast, and new terminals keep coming online.
Which terminals drove the growth?
Plaquemines LNG is exporting at full capacity and Corpus Christi Stage 3 is running six of its seven trains, which together add 4.0 Bcf/d of nominal export capacity (EIA, Sep 2026).
- Golden Pass LNG began exporting in April 2026 and adds another 0.7 Bcf/d of nominal capacity (EIA, Sep 2026).
- U.S. LNG exports averaged 15.1 Bcf/d in 2025 (EIA, Oct 2026).
- EIA forecasts 17.6 Bcf/d in 2026 and 18.6 Bcf/d in 2027 (EIA, Oct 2026).
What new export capacity is coming?
In March 2026 the U.S. government allowed Plaquemines to raise exports by 13%, or 4.6 billion cubic metres a year (IEA, Jul 2026).
- The CP2 Phase 2 decision lifts that project’s peak capacity to 40 billion cubic metres a year from the second half of 2030 (IEA, Jul 2026).
- Commonwealth LNG is planned at 13 billion cubic metres a year and Delfin’s first floating unit at 6 billion cubic metres a year, both from 2030 (IEA, Jul 2026).
How is natural gas used and traded around the world?
World gas demand stalled in 2025 and is set to fall in 2026, and tighter supply is a main reason. The war in the Middle East cut off a large part of the LNG that Asia and Europe depend on.
How fast is global gas demand growing?
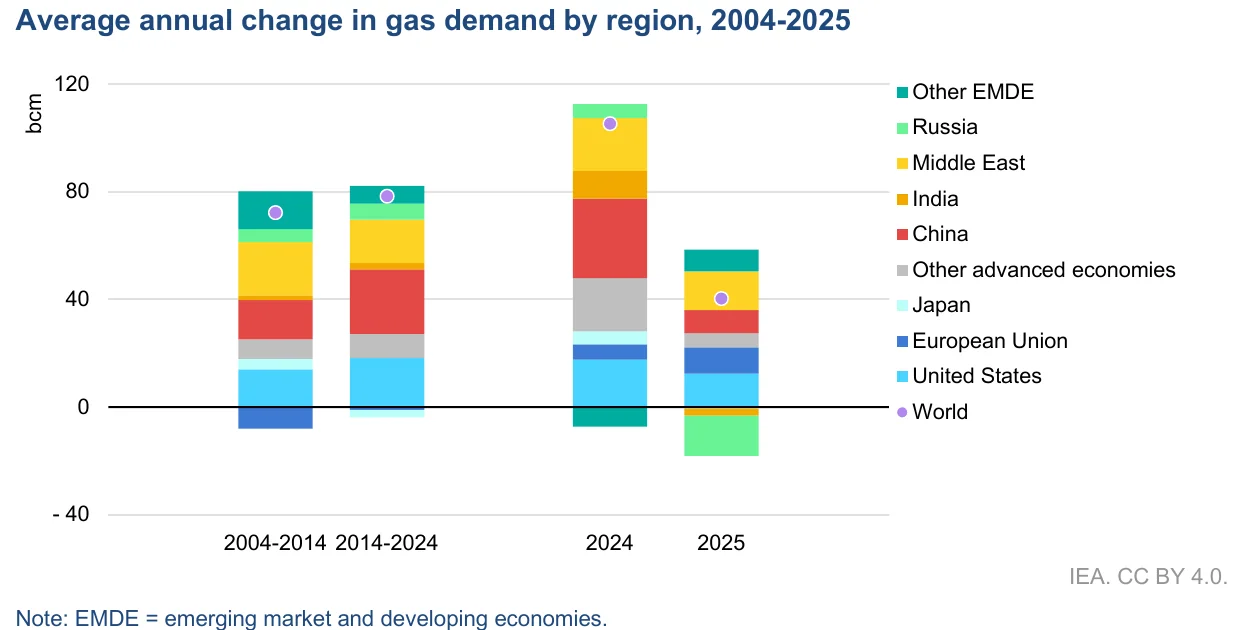
Global gas demand grew 1% in 2025, about 40 billion cubic metres, after a 2.8% rise in 2024 (IEA, Apr 2026).
- Buildings supplied almost 70% of the growth in gas demand in 2025, and gas demand in buildings rose around 3% (IEA, Apr 2026).
- Gas met about 17% of global energy demand growth in 2025, second to solar at more than 25% (IEA, Apr 2026).
- Gas use in the European Union rose around 3%, the biggest increase since 2021 (IEA, Apr 2026).
- China’s gas demand grew about 2% in 2025, against 7% in 2024 (IEA, Apr 2026).
- India’s gas use fell about 3.5% (IEA, Apr 2026).
- Japan’s gas demand fell almost 1% in 2025, partly as nuclear output recovered (IEA, Apr 2026).
- Saudi Arabia’s gas consumption rose about 6%, the largest contribution to Middle East growth (IEA, Apr 2026).
- Middle East gas demand grew an estimated 2.5% in 2025, helped by oil-to-gas switching in power plants (IEA, Apr 2026).
- Brazil’s primary gas supply rose 12% in 2025 as hydropower output fell (IEA, Apr 2026).
- Clean energy deployed since 2019 avoided over 260 billion cubic metres of gas demand in 2025, almost half the global LNG market (IEA, Apr 2026).
- Global gas-fired power generation reached a record 6,919 TWh in 2025, up only 0.5% (Ember, Apr 2026).
- Solar added 636 TWh of generation in 2025, about 18 times the 36 TWh added by gas (Ember, Apr 2026).
- The United States recorded the largest fall in gas-fired generation in 2025, because of high prices (Ember, Apr 2026).
What did the Strait of Hormuz closure do to supply?
Between March and June 2026, LNG loadings from Qatar and the United Arab Emirates fell by 35 billion cubic metres from a year earlier (IEA, Jul 2026).
- About 110 billion cubic metres of gas passed through the Strait in 2025 (IEA, May 2026).
- Non-Gulf LNG production grew almost 18%, or about 27 billion cubic metres, offsetting about three-quarters of the Gulf loss (IEA, Jul 2026).
- Global LNG production still fell 4%, or 8 billion cubic metres, from March to June (IEA, Jul 2026).
- The European TTF price averaged near $16 per million Btu in the second quarter, up 32% from a year earlier (IEA, Jul 2026).
- Asian spot LNG averaged $17.5 per million Btu, up 45% (IEA, Jul 2026).
- The IEA expects global gas demand to fall about 0.5%, or 20 billion cubic metres, in 2026, the third decline this decade (IEA, Jul 2026).
- Middle East demand is projected to fall around 4%, the region’s first annual drop since 1993 (IEA, Jul 2026).
- In Asia, gas demand fell an estimated 0.5%, or almost 5 billion cubic metres, in the first half of 2026 (IEA, Jul 2026).
- China’s gas demand fell about 4% from March to June, and its LNG imports dropped 12%, or 3 billion cubic metres (IEA, Jul 2026).
- OECD Europe’s gas use fell around 0.5% in the first half of 2026, and the IEA expects a drop of more than 2% for the full year (IEA, Jul 2026).
- The gap between Asian and European prices flipped to a $2.1 per million Btu premium in Asia from March to June, which pulled flexible cargoes away from Europe (IEA, Jul 2026).
- Global LNG supply is forecast to stay flat in 2026, and delays in Gulf recovery could cause its first annual decline since 2012 (IEA, Jul 2026).
- The US government allowed the Elba Island plant to raise exports by 22%, or 0.8 billion cubic metres, in April 2026 (IEA, Jul 2026).
- Qatar and UAE LNG supply is set to fall about 45%, or 54 billion cubic metres, in 2026 (IEA, Jul 2026).
- Gas demand in Eurasia is forecast to rise nearly 3% in 2026 after a colder first quarter (IEA, Jul 2026).
- Gas demand in Central and South America is forecast to rise 3% in 2026 as lower hydropower output lifts gas burn in power plants (IEA, Jul 2026).
- Cumulative LNG supply losses from 2026 to 2030 are estimated at 140 billion cubic metres, equal to 15% of the new LNG supply due over those years (IEA, Jul 2026).
Where does Europe get its gas?
LNG made up almost 39% of Europe’s primary gas supply in the first half of 2026, and the United States provided over 60% of LNG deliveries to Europe (IEA, Jul 2026).
- Norway supplied 52.1% of the EU’s pipeline gas in 2025, followed by Algeria at 17.4% (Eurostat, Mar 2026).
- Russia provided 13.9% of EU LNG imports and Qatar 8.9% (Eurostat, Mar 2026).
- EU imports of liquefied gas rose 24.4% in volume in 2025, while imports of gaseous natural gas fell 5.3% (Eurostat, Mar 2026).
- EU gas production rose 3.2% in 2025 to 1,205,229 terajoules (Eurostat, Jun 2026).
- Total EU gas imports rose 8.4% in 2025 (Eurostat, Jun 2026).
- UK household gas consumption rose 10% in the second quarter of 2026 compared with the same quarter of 2025 (UK DESNZ, Sep 2026).
- Total UK gas demand rose 1.0% in the second quarter of 2026 (UK DESNZ, Sep 2026).
How big is the gas delivery system, and how safe is it?
Gas reaches customers through a pipe network that is mostly out of sight. Most of it works quietly, and the rare failure is serious.
How many miles of pipe deliver gas to customers?
U.S. gas distribution systems reported 73,152,736 service lines in 2025 (PHMSA, Oct 2026).
- Distribution main grew from 1,329,841 miles in 2020 (PHMSA, Oct 2026).
- PHMSA logged 1,442 distribution annual reports for 2025 (PHMSA, Oct 2026).
- The full U.S. pipeline network has about 3 million miles of mainline and other pipe (EIA, Mar 2024).
- That network delivered about 29.2 Tcf to about 78.3 million consumers in 2022 (EIA, Mar 2024).
How often does gas cause home fires and deaths?
Home structure fires involving natural gas or LP gas caused 344 civilian injuries and $251 million in property damage in 2022 (NFPA, Oct 2024).
- Those fires caused 114 civilian deaths in 2021 and 39 in 2020, so the toll swings from year to year (NFPA, Oct 2024).
- All flammable gases together were involved in an estimated 11,537 home structure fires and 193 civilian deaths in 2022 (NFPA, Oct 2024).
- Home fires involving natural or LP gas fell to a low of 6,199 in 2009 before climbing back (NFPA, Oct 2024).
Glossary
- Bcf/d: billion cubic feet per day.
- bcm: billion cubic metres.
- Btu: British thermal unit, a unit of heat. MMBtu means one million Btu.
- Henry Hub: the Louisiana pipeline hub whose spot price is the U.S. benchmark for gas.
- LNG: liquefied natural gas, gas cooled to a liquid so it can ship by sea.
- Mt: million tonnes.
- RECS: the Residential Energy Consumption Survey run by EIA.
- STEO: EIA’s Short-Term Energy Outlook, published monthly.
- Tcf: trillion cubic feet.
- TTF and JKM: the European and Asian benchmark prices for gas.
Methodology and Sources
Every figure comes from the agency, regulator, research body or company that produced it, and each link goes to the page or file holding the number. Numbers were checked against the source on 20 October 2026. Where a source gives a range or an estimate, the page says so. EIA is the main source for U.S. supply, consumption and prices, and the IEA is the main source for world markets. The page is reviewed and refreshed every month.
Sources
- BLS, Consumer Price Index Summary, September 2026, Oct 2026
- EIA, 2020 RECS Table CE2.1, annual household site fuel consumption, Mar 2024
- EIA, 2020 RECS Table CE4.1, end-use consumption by fuel, Mar 2024
- EIA, 2020 RECS Table HC6.1, space heating in U.S. homes, Mar 2023
- EIA, 2020 RECS Table HC8.1, water heating in U.S. homes, Mar 2023
- EIA, 2020 RECS, Highlights for space heating fuel in U.S. homes by state, Mar 2023
- EIA, Henry Hub natural gas prices this summer were 6% lower than last summer, Sep 2026
- EIA, Henry Hub Natural Gas Spot Price, annual, Oct 2026
- EIA, In 2020, 27% of U.S. households had difficulty meeting their energy needs, Apr 2022
- EIA, In 2025, U.S. natural gas spot prices increased from 2024’s record low, Jan 2026
- EIA, Natural gas and the environment, Apr 2024
- EIA, Natural gas pipelines, Mar 2024
- EIA, Proved Reserves of Crude Oil and Natural Gas in the United States, Year-End 2024, Apr 2026
- EIA, Short-Term Energy Outlook, natural gas, Oct 2026
- EIA, The majority of U.S. households used natural gas in 2020, Mar 2023
- EIA, U.S. industrial natural gas consumption expected to hit records in 2026 and 2027, May 2026
- EIA, U.S. LNG exports rose 23% in the first half of 2026, Sep 2026
- EIA, U.S. natural gas consumption set a monthly and yearly record in 2025, Mar 2026
- EIA, U.S. natural gas production reached a new record in 2025, Mar 2026
- EIA, U.S. natural gas production reached a record high in July 2026, Oct 2026
- EIA, U.S. Price of Natural Gas Delivered to Residential Consumers, annual, Sep 2026
- EIA, United States on track for record natural gas production in 2026, Aug 2026
- EIA, Use of natural gas, Oct 2024
- EIA, Winter Fuels Outlook 2025-2026, Oct 2025
- Ember, Global Electricity Review 2026, electricity demand and supply trends, Apr 2026
- EPA, GHG Emission Factors Hub 2025, Jan 2025
- EPA, GHGRP Petroleum and Natural Gas Systems, Aug 2024
- Eurostat, Energy consumption in households, Jun 2026
- Eurostat, EU imports of energy products decreased again in 2025, Mar 2026
- Eurostat, Natural gas supply statistics, Jun 2026
- IEA, Gas Market Report, Q3-2026, executive summary, Jul 2026
- IEA, Global Energy Review 2026, key findings, Apr 2026
- IEA, Global Energy Review 2026, natural gas, Apr 2026
- IEA, Global Methane Tracker 2026, May 2026
- IEA, Global Methane Tracker 2026, understanding methane emissions, May 2026
- NEADA, Winter Heating Update, Feb 2026
- NFPA, Structure Fires Involving Flammable Gases: Supporting Tables, Oct 2024
- NOAA, Assessing the U.S. Temperature and Precipitation in July 2026, Aug 2026
- PHMSA, Annual Report Mileage for Gas Distribution Systems, Oct 2026
- PSE Healthy Energy, Measuring Methane and NOx Emissions from Gas Stoves, Jan 2022
- Stanford University, Climate and health impacts of natural gas stoves, Jan 2022
- UK DESNZ, Energy Trends September 2026, Sep 2026