Heat related deaths statistics show a toll that official counts understate. Death certificates record only the cases where a doctor or coroner wrote heat on the form, and many people who die in a hot house or on a hot job are filed under a heart attack, kidney failure or an overdose.
This page collects the most recent figures from the agencies and research teams that produced them: the CDC and its National Center for Health Statistics, the Bureau of Labor Statistics, the National Weather Service, county health departments, the Lancet Countdown and national health agencies abroad. Each number is linked to its source report and dated.
The data points the same way across places and years. Heat kills older adults, men, outdoor workers and people without working cooling at home. The risk sits indoors more often than most people expect. Where a figure is an estimate and not a death certificate count, the text says so.
Key Takeaways
- The US reported 2,391 heat-related deaths in 2024 (CDC NCHS, Sep 2026).
- An NPR and Boston University analysis estimates about 9,000 US deaths a year are influenced by heat, five times the official count (NPR, Aug 2026).
- Heat caused 529 recorded US weather fatalities in 2024, more than flash floods (119), the next highest hazard (National Weather Service, Mar 2026).
- Maricopa County, Arizona counted 645 heat deaths in 2023, its highest year on record (Maricopa County Public Health, Apr 2026).
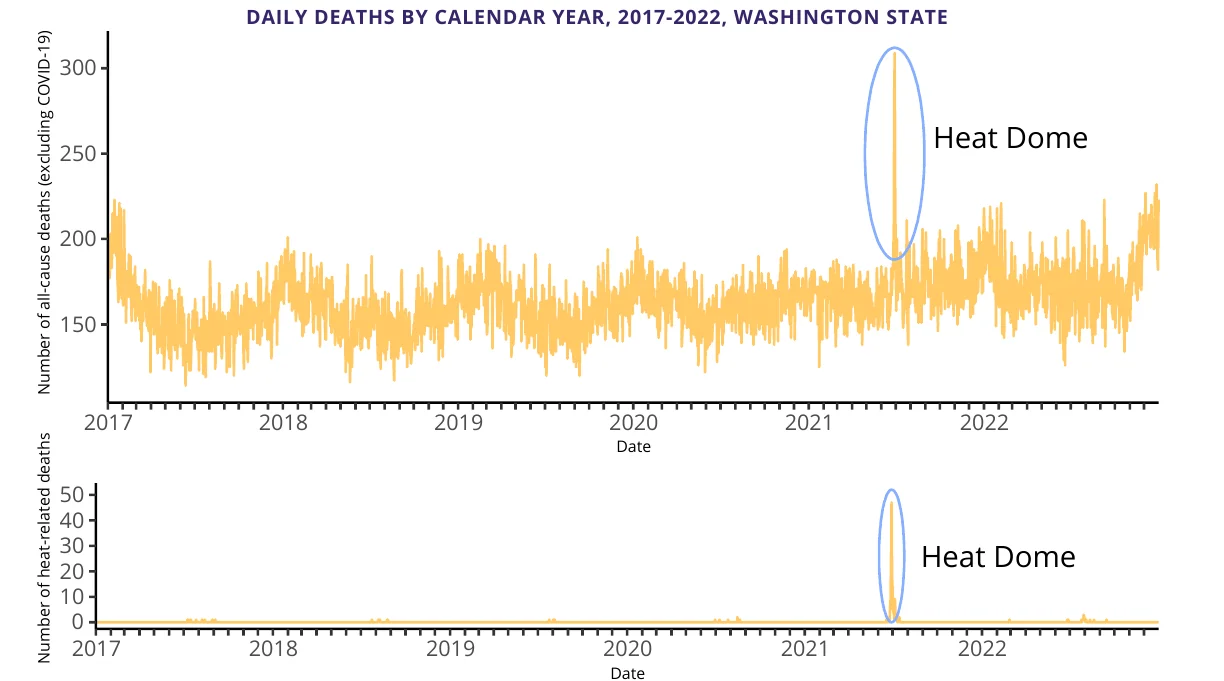
- Heat killed 126 people in Washington state’s 2021 heat dome by the official count, but 441 more people died than expected in the same week (University of Washington Climate Impacts Group, Jun 2023).
- In British Columbia’s 2021 heat dome, 98% of the 619 heat-related deaths happened indoors (BC Coroners Service, Jun 2022).
- Environmental heat killed 48 US workers in 2024 (Bureau of Labor Statistics, Feb 2026).
- 1,070 children have died in hot cars in the US since 1998 (NoHeatStroke.org, Sep 2026).
- Human-caused climate change added an average 27.1% to warm-season heat illness ER visit rates from 2018 to 2025 (Climatic Change, Sep 2026).
- The mortality effect of a day above 80F fell 75% in the US over the 20th century, and home air conditioning explains essentially all of the decline (Journal of Political Economy, Jan 2016).
- Worldwide, heat killed an estimated 546,000 people a year in 2012 to 2021 (Lancet Countdown, Oct 2025).
- Europe lost an estimated 62,775 people to heat in summer 2024 (ISGlobal, Sep 2025).
- At least 1,300 pilgrims died in the 2024 Hajj as temperatures hit 51.8 C in Mecca (npj Natural Hazards, Dec 2025).
How Many People Die From Heat in the US Each Year?
The official US count is smaller than the real toll and has been climbing. Death certificate data from the CDC still gives the cleanest long run, and it shows a sharp break from the early 2000s.
What do US death certificates count?
Death certificates list heat as an underlying or contributing cause. That is a narrow test.
- In 2021 the US recorded 1,600 deaths with heat on the certificate (CDC MMWR, Sep 2023).
- The 2021 age-adjusted rate was 0.4 deaths per 100,000 people (CDC MMWR, Sep 2023).
- From 2004 to 2018 the US averaged 702 heat-related deaths a year (CDC MMWR, Jun 2020).
- Of that 702, 415 had heat as the underlying cause and 287 as a contributing cause (CDC MMWR, Jun 2020).
- CDC counted 10,527 deaths across those 15 years (CDC MMWR, Jun 2020).
- About 90% of them (9,757) fell between May and September (CDC MMWR, Jun 2020).
Which age groups die most often?
Risk climbs with age, but heat also kills working-age adults.
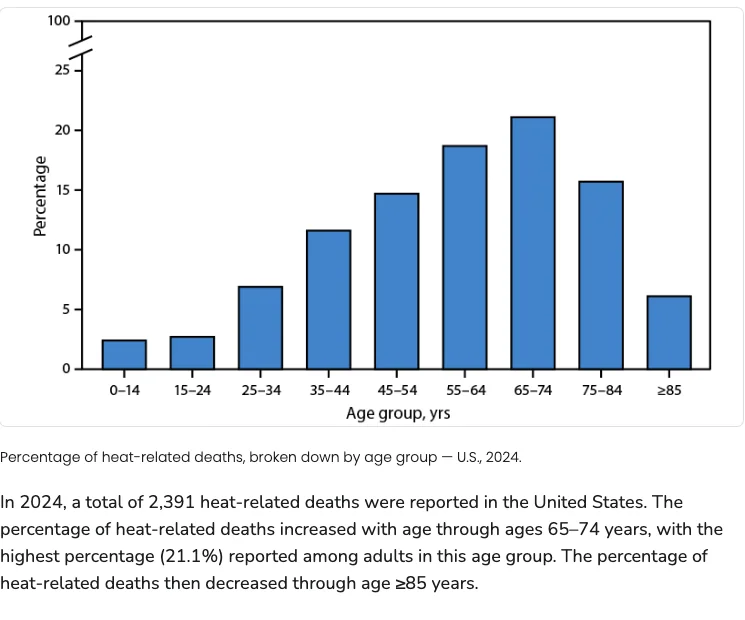
- Adults aged 65 to 74 made up the largest share of 2024 deaths, at 21.1% (CDC NCHS, Sep 2026).
- From 2004 to 2018, 39% of decedents (4,019 of 10,470 with a known age) were 65 or older (CDC MMWR, Jun 2020).
- Their death rate was 0.7 per 100,000, the highest of any age group (CDC MMWR, Jun 2020).
- Adults aged 45 to 64 made up 35% of those deaths (CDC MMWR, Jun 2020).
- Adults aged 15 to 44 made up 19% (CDC MMWR, Jun 2020).
- Children under 15 made up 7% (CDC MMWR, Jun 2020).
How does heat compare with other weather hazards?
In 2024 the National Weather Service recorded more deaths from heat than from any other weather hazard.
- Hurricanes and tropical storms killed 78 people in 2024 (National Weather Service, Mar 2026).
- Tornadoes killed 52 (National Weather Service, Mar 2026).
- Cold killed 46 (National Weather Service, Mar 2026).
- Rip currents killed 74 (National Weather Service, Mar 2026).
- Heat injured 223 people in the same year (National Weather Service, Mar 2026).
How Many Deaths From Heat Are Missed in the Official Count?
Studies that compare total deaths during a heat wave with a normal baseline find a toll well above the certificate count. Two reasons explain the gap. Heat is often not written on the certificate, and heat can push a person with heart or kidney disease over the edge.
How large is the US undercount?
- Federal records show about 1,700 heat deaths a year on average, according to NPR (NPR, Sep 2026).
- NPR estimates Florida has more than 1,900 heat-influenced deaths a year, about 40 times the reported figure (NPR, Aug 2026).
- NPR’s model estimates more than 60 a year in Massachusetts, against about 5 on official records (NPR, Aug 2026).
- A study of 297 US counties estimated 5,608 deaths a year attributable to heat from 1997 to 2006 (Environmental Epidemiology, Apr 2020).
- Chicago’s July 1995 heat wave caused 485 heat-related deaths on certificates and 739 excess deaths (CDC MMWR, Jul 2003).
How big were the gaps in recent heat waves?
- The 2021 heat dome set 128 all-time temperature records in Washington state (University of Washington Climate Impacts Group, Jun 2023).
- Washington averaged 18 heat-related deaths a day during the dome (University of Washington Climate Impacts Group, Jun 2023).
- In each year from 2017 to 2021 the state reported eight or fewer heat-related deaths (University of Washington Climate Impacts Group, Jun 2023).
- Oregon recorded 102 deaths with heat as the sole cause in the June 2021 dome (Oregon Health Authority, Jun 2023).
- It recorded six more in the August 2021 heat wave (Oregon Health Authority, Jun 2023).
- California’s 10-day September 2022 heat wave brought 395 more deaths than expected, a 5% rise (California Department of Public Health, Aug 2023).
- Counting three more days, California’s excess reached 441 (California Department of Public Health, Aug 2023).
- British Columbia investigated more than 800 deaths in the week of its 2021 heat dome (BC Coroners Service, Jun 2022).
Which US Places Have the Highest Heat Mortality?
Heat deaths cluster in the Southwest and the Pacific Northwest, and they swing hard with the weather. County health departments that review every case give the best local numbers.
Which states have the highest rates?
- In 2021 nine states recorded 1,226 heat deaths, more than 75% of the national count (CDC MMWR, Sep 2023).
- Arizona recorded 426 deaths and the top rate, 5.2 per 100,000 (CDC MMWR, Sep 2023).
- Nevada followed at 4.6 per 100,000 (CDC MMWR, Sep 2023).
- Oregon’s rate was 2.4 and Washington’s was 1.9 (CDC MMWR, Sep 2023).
What does Maricopa County, Arizona show?
- Maricopa County counted 608 heat deaths in 2024 (Maricopa County Public Health, Apr 2026).
- It counted 430 in 2025, the second straight yearly drop (Maricopa County Public Health, Apr 2026).
- In 2015 it counted 84 (Maricopa County Public Health, Apr 2026).
- From 13 June to 5 September 2025 a heat death occurred every day, 357 in 85 days (Maricopa County Public Health, Apr 2026).
- Phoenix was the injury city for 233 of the 2025 deaths (Maricopa County Public Health, Apr 2026).
- In 2024 Phoenix endured 113 straight days at or above 100F, from 27 May to 16 September (Maricopa County Public Health, Mar 2025).
- 47% of 2025 heat deaths came on days rated only moderate on the HeatRisk scale (Maricopa County Public Health, Apr 2026).
What does Clark County, Nevada show?
- Clark County recorded 284 heat-associated deaths in 2025 (Southern Nevada Health District, Feb 2026).
- That was a 45% drop from 513 in 2024 (Southern Nevada Health District, Feb 2026).
- 2024 had 36 days at or above 110F, 21 of them in July alone (Southern Nevada Health District, Feb 2026).
- 2025 had nine such days (Southern Nevada Health District, Feb 2026).
- The most deaths (46%) came on days between 105F and 109F (Southern Nevada Health District, Feb 2026).
What does New York City show?
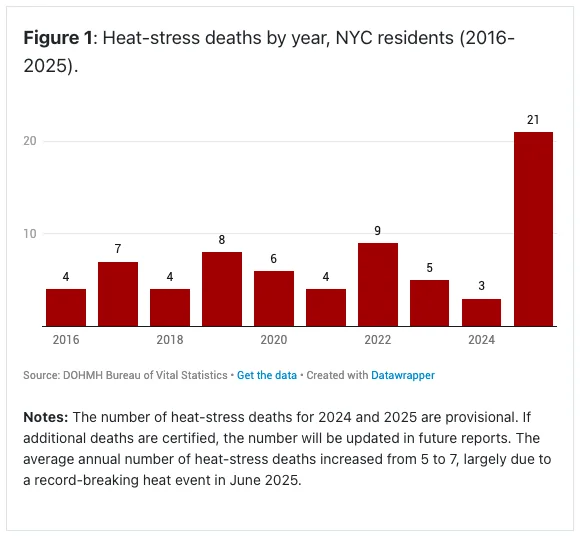
- New York City averages 7 heat-stress deaths a year from 2016 to 2025 (NYC Health Department, Mar 2026).
- It averages about 490 heat-exacerbated deaths a year, roughly 3% of warm-season deaths (NYC Health Department, Mar 2026).
- The city counted 71 heat-stress deaths over the ten years (NYC Health Department, Mar 2026).
- The heat index at LaGuardia Airport peaked at 103F on 25 June 2025, during a four-day heat wave (NYC Health Department, Mar 2026).
Who Is Most at Risk From Heat?
The pattern repeats from Phoenix to Las Vegas to New York: older adults, men, Black residents, people without housing and people with heart disease or substance use. The groups overlap, so one person often carries several risks.
Which sex, age and racial groups die most?
- Men were 74% of Maricopa County’s 2025 heat deaths (Maricopa County Public Health, Apr 2026).
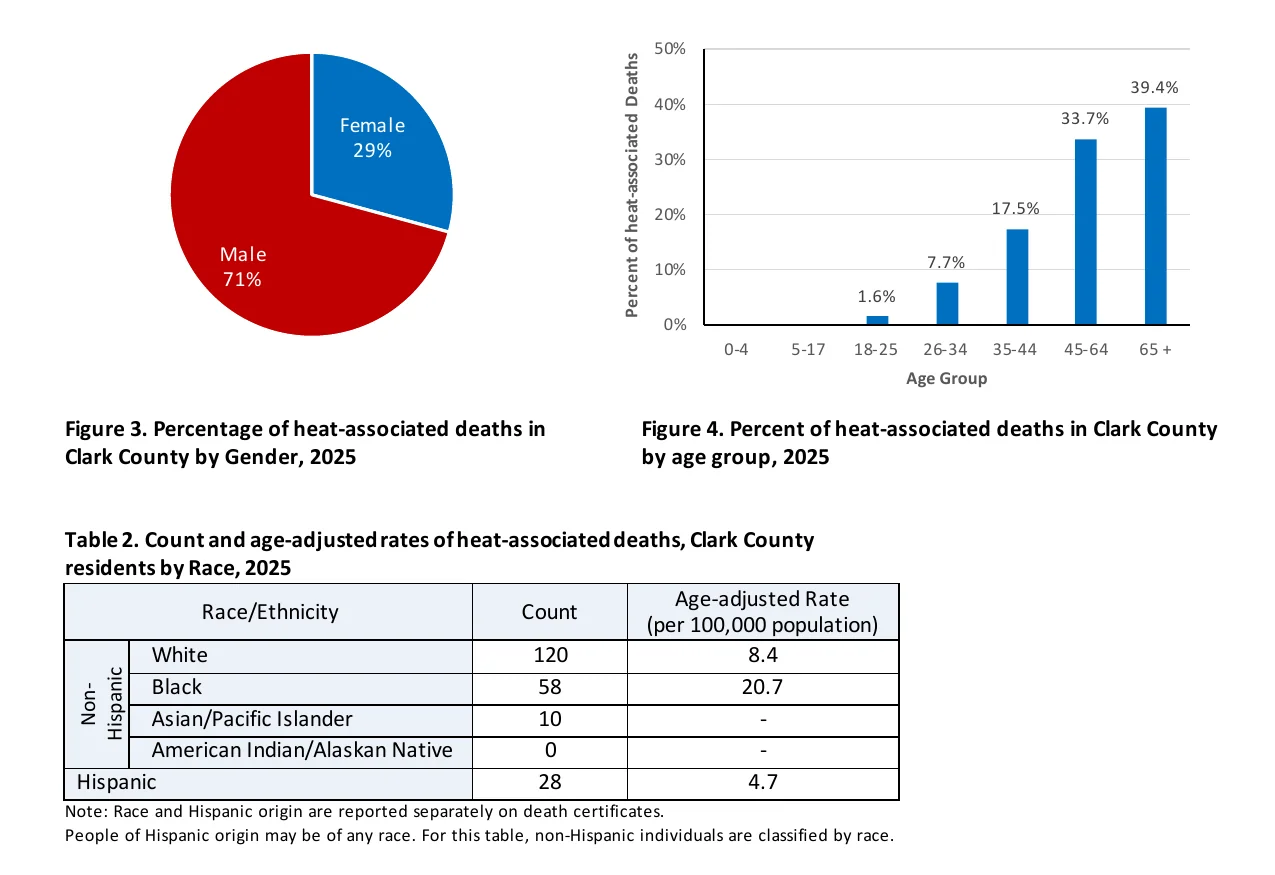
- Men were 71% in Clark County (Southern Nevada Health District, Feb 2026).
- Nationally, men were 70% of deaths from 2004 to 2018 (CDC MMWR, Jun 2020).
- About 60% of Maricopa’s 2025 deaths were people aged 50 or older (Maricopa County Public Health, Apr 2026).
- In Clark County, 39.4% were 65 or older and 33.7% were 45 to 64 (Southern Nevada Health District, Feb 2026).
- American Indian and Alaska Native people had the highest national rate from 2004 to 2018, 0.6 per 100,000 (CDC MMWR, Jun 2020).
- Clark County’s age-adjusted rate was 20.7 per 100,000 for Black residents, 8.4 for White residents and 4.7 for Hispanic residents (Southern Nevada Health District, Feb 2026).
- New York’s heat-stress death rate was three times higher for Black residents and two times higher for Latino residents than for White residents (NYC Health Department, Mar 2026).
- Each additional heat wave was linked to 16.50 extra deaths per 10,000 Black adults aged 65 and over a year, against 5.85 for White adults (Harvard T.H. Chan School of Public Health, Mar 2026).
How do homelessness and substance use change the risk?
- People experiencing homelessness were 49% of Maricopa’s 2025 heat deaths (Maricopa County Public Health, Apr 2026).
- They were 26.4% in Clark County, with another 13.0% of housing status unknown (Southern Nevada Health District, Feb 2026).
- Substances were involved in 55% of Maricopa’s deaths (Maricopa County Public Health, Apr 2026).
- Of those, 82% involved stimulants (Maricopa County Public Health, Apr 2026).
- In Clark County, 50% of deaths involved substance use, and methamphetamine alone accounted for 50% of those (Southern Nevada Health District, Feb 2026).
Which health conditions raise the risk?
- Cardiopulmonary disease contributed to 47% of Maricopa’s 2025 deaths (Maricopa County Public Health, Apr 2026).
- Diabetes contributed to 15% (Maricopa County Public Health, Apr 2026).
- Obesity contributed to 8% (Maricopa County Public Health, Apr 2026).
- Where heat was only a contributing cause nationally, major cardiovascular disease was the underlying cause in 49% of cases (CDC MMWR, Jun 2020).
- A Medicare study of 9,721 older patients found heat waves raised heat-related hospitalizations by 21% to 33% across medication classes (PLoS One, Dec 2020).
- In a study of 73.7 million Medicare beneficiaries, heat waves added about 17,600 deaths from 2000 to 2018 (Harvard T.H. Chan School of Public Health, Mar 2026).
- In ZIP codes with the most green space, heat waves were linked to 13.51 fewer deaths per 10,000 older adults a year (Harvard T.H. Chan School of Public Health, Mar 2026).
How many children die in hot cars?
- 35 children died of pediatric vehicular heatstroke in 2025 (NoHeatStroke.org, Sep 2026).
- The average is 37 a year (NoHeatStroke.org, Sep 2026).
- A caregiver forgot the child in 52.9% of cases (NoHeatStroke.org, Sep 2026).
- The child got into the car alone in 23.8% (NoHeatStroke.org, Sep 2026).
- A caregiver knowingly left the child in 21.9% (NoHeatStroke.org, Sep 2026).
- 54% of the children were under 2 years old (NoHeatStroke.org, Sep 2026).
- Cars were the injury site for 10% of Maricopa’s outdoor heat deaths in 2025, across all ages (Maricopa County Public Health, Apr 2026).
Heat Related Illness Statistics: How Many People Need Emergency Care?
For each death, many more people reach an emergency room. Syndromic surveillance, which reads ER records within days, now shows every major heat wave as a spike in visits.
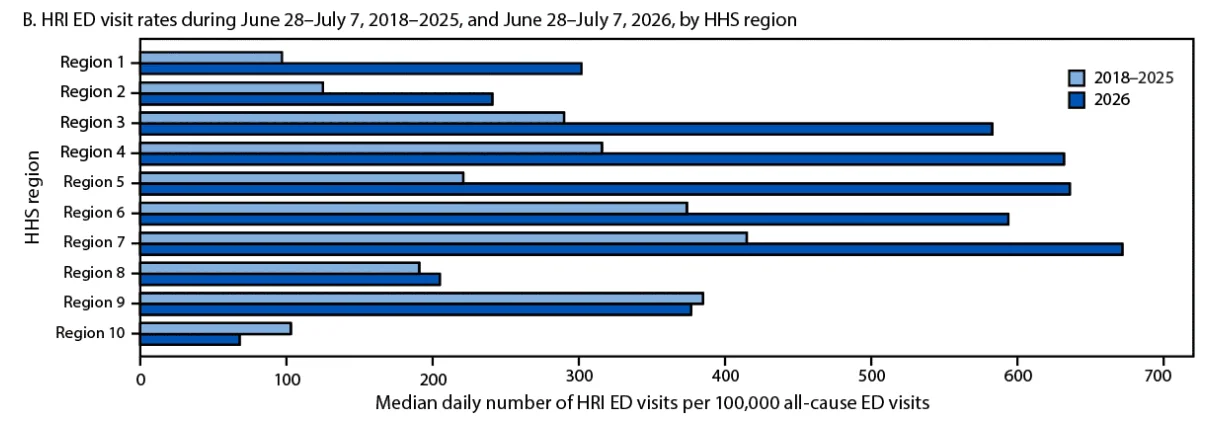
How many ER visits and hospital stays does heat cause?
- In an average year heat causes 67,512 ER visits in the US (CDC, Aug 2022).
- It causes 9,235 hospitalizations in an average year (CDC, Aug 2022).
- The 2023 season logged 119,605 heat-related illness ER visits in CDC’s surveillance system (CDC MMWR, Apr 2024).
- 92% of those visits fell in May through September (CDC MMWR, Apr 2024).
- By 10 September 2026 the system had recorded 145,321 visits for the year (CDC MMWR, Sep 2026).
When and where do visits peak?
- July and August averaged 303 visits per 100,000 ER visits, against 97 in May, June and September (CDC MMWR, Apr 2024).
- The 2023 rate for men was 271 per 100,000 ER visits and for women 104 (CDC MMWR, Apr 2024).
- Adults aged 18 to 25 and 26 to 54 had about 2.5 times the risk of people under 18 (CDC MMWR, Apr 2024).
- HHS Region 6 (Arkansas, Louisiana, New Mexico, Oklahoma, Texas) had the highest warm-season rate in 2023, 483 (CDC MMWR, Apr 2024).
- Region 2 (New Jersey and New York) had the lowest, 51 (CDC MMWR, Apr 2024).
- In Region 6, 37% of warm-season days in 2023 topped the 95th percentile rate (CDC MMWR, Apr 2024).
What did the 2021 and 2026 heat domes do to ER visits?
- The Northwest recorded 1,090 heat illness ER visits on 28 June 2021 alone (CDC MMWR, Jul 2021).
- It recorded 3,504 visits across May and June 2021 (CDC MMWR, Jul 2021).
- The 28 June to 7 July 2026 heat dome accounted for 21,775 visits, about 15% of the year’s total to date (CDC MMWR, Sep 2026).
- About 221 million people, 65% of the population, lived in places with at least one day of major or extreme HeatRisk (CDC MMWR, Sep 2026).
- Visit rates were highest among men aged 26 to 54 in six of the ten regions (CDC MMWR, Sep 2026).
- Clark County alone logged 2,217 heat-related ER visits in 2025 (Southern Nevada Health District, Feb 2026).
How much of the rise comes from climate change?
- In the recent heat waves it studied, a 2026 attribution study estimates ER visit rates would have been 20% to 30% lower without climate change (Climatic Change, Sep 2026).
How Many Workers Die From Heat on the Job?
Work is the heat exposure an employer can change, and the federal count shows how often it still turns fatal.
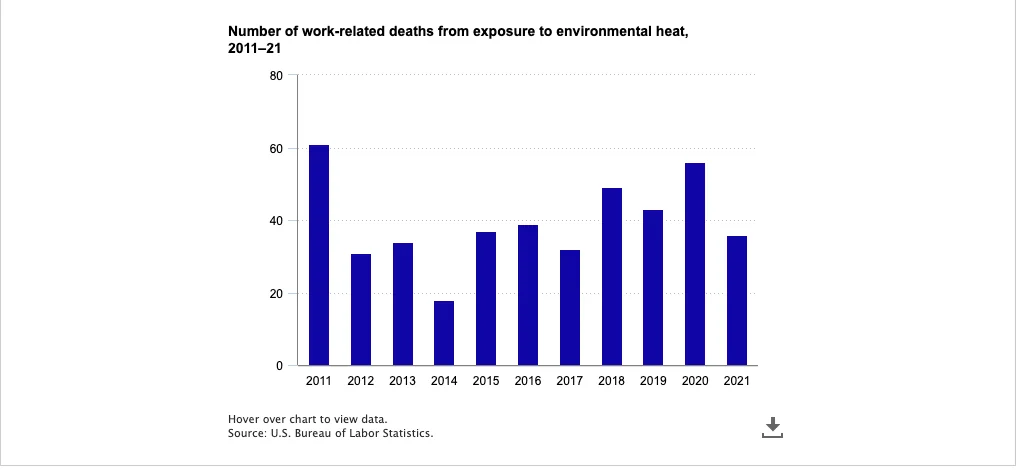
How many US workers die from heat each year?
- 40 of the 48 deaths in 2024 happened outdoors and 6 indoors (Bureau of Labor Statistics, Feb 2026).
- Construction accounted for 24 of the 48 (Bureau of Labor Statistics, Feb 2026).
- 2021 saw 36 heat deaths at work (Bureau of Labor Statistics, Jun 2023).
- 2020 saw 56 (Bureau of Labor Statistics, Jun 2023).
- 2011 saw 61 and 2014 saw 18 (Bureau of Labor Statistics, Jun 2023).
- From 2011 to 2021 there were 436 in total (Bureau of Labor Statistics, Jun 2023).
- Construction workers died of heat-related causes 285 times from 1992 to 2016, more than a third of all US heat deaths at work (CDC NIOSH, May 2020).
Who is exposed?
- 33.0% of US workers had outdoor exposure as a regular part of their job in 2023 (Bureau of Labor Statistics, Jun 2024).
- At least 99.5% of firefighters, landscaping workers and construction laborers worked outdoors (Bureau of Labor Statistics, Jun 2024).
- In California workers’ compensation data, public administration had 35% of heat illness cases, agriculture 13% and construction 8% (CDC NIOSH, May 2021).
- 9% of heat illness cases in that data hit new workers within two weeks of hire (CDC NIOSH, May 2021).
- The 2025 heat stroke rate among active component US service members was 39.4 per 100,000 person-years (Military Health System, May 2026).
- Their heat exhaustion rate was 170.0 per 100,000 person-years (Military Health System, May 2026).
- The heat stroke rate rose 6.9% from 2024 to 2025, the second yearly rise (Military Health System, May 2026).
What are the rules and the cost?
- OSHA published its proposed federal heat standard for indoor and outdoor work on 30 August 2024 (OSHA, Aug 2024).
- Heat exposure cost the world 640 billion potential labour hours in 2024, 98% above the 1990s average (Lancet Countdown, Oct 2025).
- The matching global income loss was US$1.09 trillion, the first time it passed $1 trillion (Lancet Countdown, Oct 2025).
- Australia lost about 175 million potential labour hours to heat in 2024 (Lancet Countdown, Oct 2025).
How Do Homes, Air Conditioning and Blackouts Change the Risk?
Many heat deaths happen at home, and air conditioning is the control that works at scale. The cases that matter most are the homes where cooling exists on paper but fails in practice, and the homes that lose power in a heat wave.
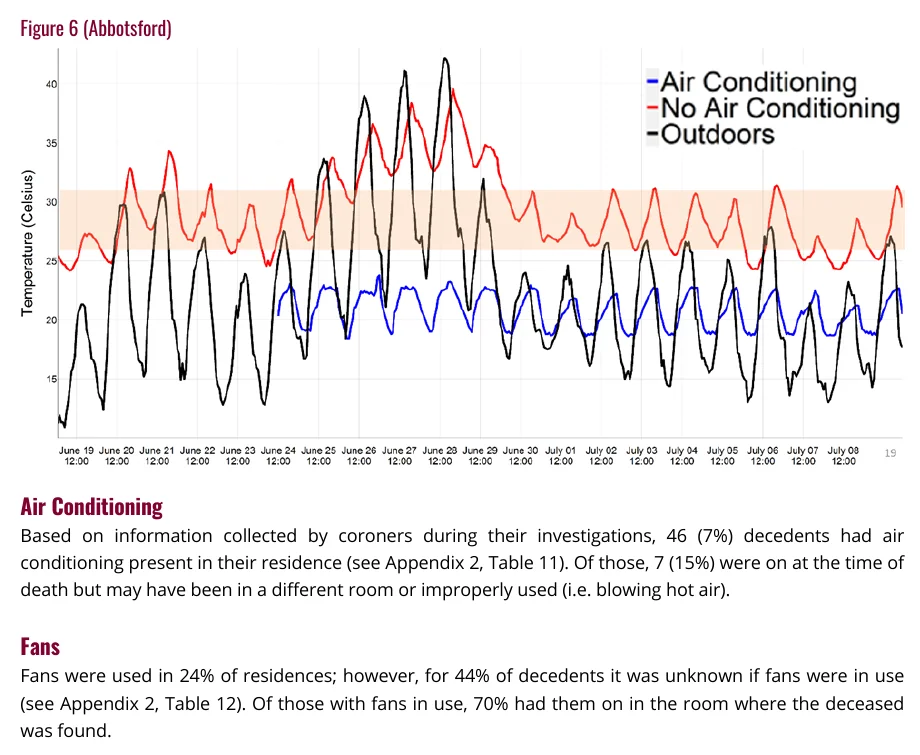
Do indoor deaths happen in homes that have AC?
- AC was present in 94% of Maricopa’s indoor heat deaths in 2025 (Maricopa County Public Health, Apr 2026).
- Among those homes, the unit was not working in 72% of cases (Maricopa County Public Health, Apr 2026).
- 48% of indoor deaths were found during a welfare check (Maricopa County Public Health, Apr 2026).
- 23% of indoor deaths happened in a mobile home or RV, which make up only 5% of local housing (Maricopa County Public Health, Apr 2026).
- 90% of indoor deaths were among people aged 50 or older (Maricopa County Public Health, Apr 2026).
How many homes have no air conditioning at all?
For air conditioning use by country, see air conditioning statistics.
- The US had 123.53 million homes in 2020, and 109.51 million used air conditioning equipment (U.S. Energy Information Administration, Mar 2023).
- 14.02 million homes did not use AC (U.S. Energy Information Administration, Mar 2023).
- 0.76 million of the 6.83 million mobile homes had none (U.S. Energy Information Administration, Mar 2023).
- Only 46 of the 619 BC decedents (7%) had air conditioning in the home (BC Coroners Service, Jun 2022).
- 56% of the BC decedents lived alone (BC Coroners Service, Jun 2022).
- 67% were aged 70 or older (BC Coroners Service, Jun 2022).
- In England in summer 2025, care homes saw 677 heat-associated deaths, hospitals 485 and people’s own homes 326 (UK Health Security Agency, Apr 2026).
How much does air conditioning cut the risk?
If you size or check a cooling system, the AC tonnage calculator and the BTU calculator estimate the load. The studies below show why a working system matters.
- A day above 90F caused about 80% less mortality in 1960 to 2004 than in 1900 to 1959 (National Bureau of Economic Research, Jan 2013).
- That equals about 600 premature deaths a year, against roughly 3,600 under the older relationship (National Bureau of Economic Research, Jan 2013).
What happens when the power fails during a heat wave?
Cooling only works if a household can power it and pay for it. Energy poverty statistics cover the cost side.
- A multiday blackout during a heat wave more than doubles the estimated heat-related death rate in Atlanta, Detroit and Phoenix (Environmental Science & Technology, May 2023).
- In Phoenix more than 50% of residents would need medical attention, against 3% in Atlanta (Environmental Science & Technology, May 2023).
- Major US blackout events rose 151% between 2015 to 2016 and 2020 to 2021 (Environmental Science & Technology, May 2023).
How Many People Die From Heat Around the World?
The global toll is in the hundreds of thousands, and the estimates come from statistical models of excess deaths. Europe’s summers and Japan’s ambulance records give the best national views.
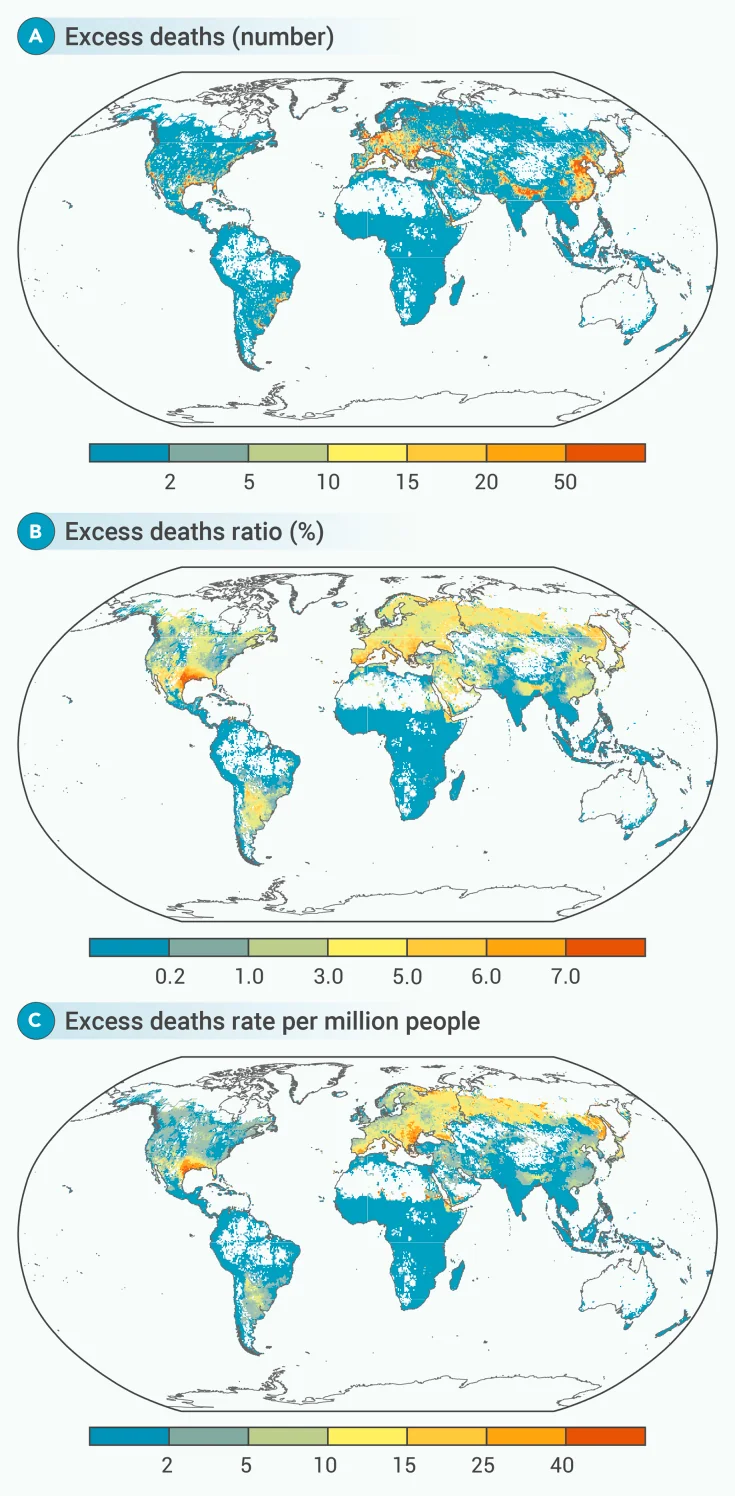
What is the global estimate?
- Global heat-related mortality rose 63.2% from 335,000 a year in 1990 to 1999 (Lancet Countdown, Oct 2025).
- Monetised global losses from heat mortality for people 65 and over averaged US$261 billion a year in 2020 to 2024 (Lancet Countdown, Oct 2025).
- In 2024 people over 65 had 304% more heatwave days than in 1986 to 2005, and infants had 389% more (Lancet Countdown, Oct 2025).
- A study of 2,013 locations in 67 countries estimated 178,486 excess deaths from 2023’s heatwaves (The Innovation, Sep 2025).
- That is 0.73% of global deaths, or 23 deaths per million people (The Innovation, Sep 2025).
- 54.29% of those deaths were attributable to human-caused climate change (The Innovation, Sep 2025).
How many people die from heat in Europe and the UK?
- Summer 2022 brought an estimated 61,672 heat deaths across 35 European countries (Nature Medicine, Jul 2023).
- Italy had the most, at 18,010, followed by Spain at 11,324 and Germany at 8,173 (Nature Medicine, Jul 2023).
- Adjusted for population, women had 56% more heat deaths than men (Nature Medicine, Jul 2023).
- The three summers of 2022, 2023 and 2024 together saw more than 181,000 heat deaths (ISGlobal, Sep 2025).
- Italy led summer 2024 with more than 19,000 deaths (ISGlobal, Sep 2025).
- Spain followed with more than 6,700 and Germany with about 6,300 (ISGlobal, Sep 2025).
- Greece had the highest rate, 574 estimated deaths per million people (ISGlobal, Sep 2025).
- England saw 1,504 heat-associated deaths in summer 2025, 1,535 fewer than the 3,039 modelled (UK Health Security Agency, Apr 2026).
- Earlier summers saw 1,311 in 2024, 2,295 in 2023 and 2,985 in 2022 (UK Health Security Agency, Apr 2026).
- People aged 85 and over had the highest rate, 364 per million (UK Health Security Agency, Apr 2026).
What do Japan, India, Australia and the Hajj show?
- Japan recorded 94,779 heatstroke ambulance transports from June to September 2024, its highest in the 2010 to 2024 series (Scientific Reports, Jun 2026).
- Adults aged 65 and over made up 50.7% of transported cases on average (Scientific Reports, Jun 2026).
- India’s surveillance counted 3,775 heat illness deaths from 2015 to 2019, including 2,040 in 2015 (National Centre for Disease Control, India, Jul 2021).
- Australia averaged an estimated 980 heat-related deaths a year in 2012 to 2021, up 83% on the 1990s (Lancet Countdown, Oct 2025).
How Much Worse Will Heat Get?
The models agree on direction. Extremes that were rare at the turn of the century are becoming routine, and the share of older residents is growing in places such as Washington state.
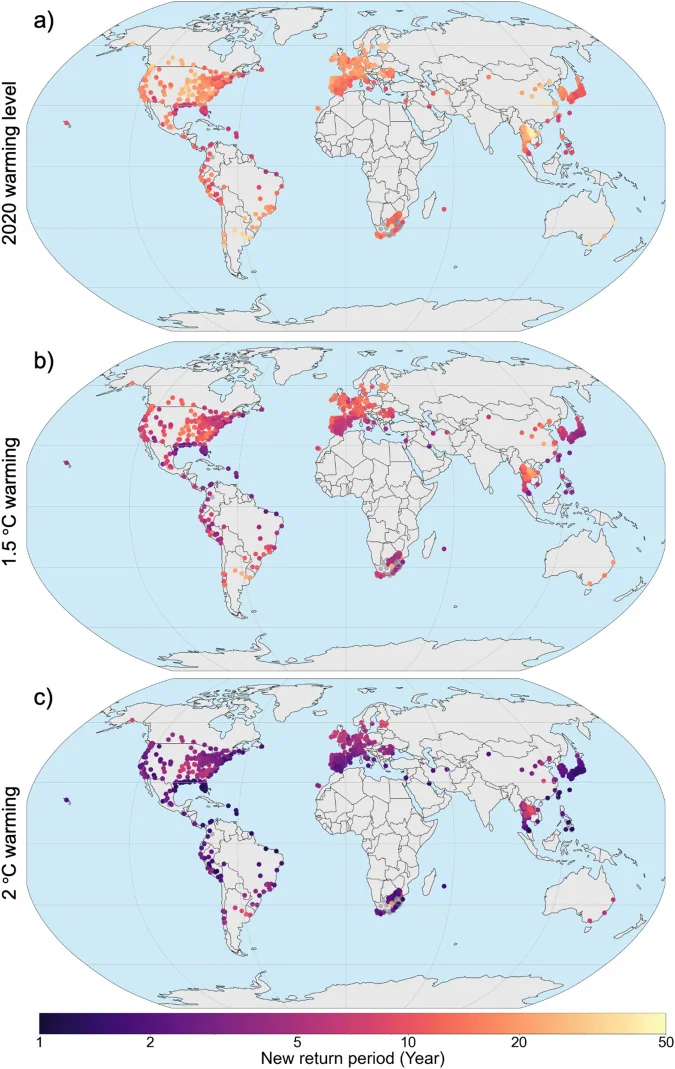
How fast are extreme heat years becoming common?
- The study covered 748 locations in 47 countries (Nature Communications, Aug 2023).
- In São Paulo, the 2014 heat toll of 1,296 deaths would be expected once in 134 years in the 2000 climate (Nature Communications, Aug 2023).
- The same toll is expected every 18 years in the 2020 climate, every 11 years at 1.5C and every 5 years at 2C (Nature Communications, Aug 2023).
What will it mean for US communities?
- One extra heat wave per decade in every ZIP code would cause about 56,800 additional premature deaths among older adults (Harvard T.H. Chan School of Public Health, Mar 2026).
- California’s heat mortality could reach 6,700 to 11,300 deaths a year by 2050 (California Department of Public Health, Aug 2023).
- In Washington, 16.7% of residents were 65 or older in 2020, a share projected to reach 21.7% by 2040 (University of Washington Climate Impacts Group, Jun 2023).
- The same report cites US labor productivity losses from heat of about $100 billion a year (University of Washington Climate Impacts Group, Jun 2023).
Methodology and Sources
Every figure in this page comes from the agency, regulator, county health department or research team that produced it. Roundups, news summaries and republished tables were used only as leads and then traced to the original report. A figure was kept only after its page was opened and the number, its date and its wording were checked. Counts from death certificates, excess death models and ambulance or ER records measure different things, so the page never adds them together. Estimates are labelled as estimates. The page is refreshed monthly. For how much energy cooling uses, see HVAC energy consumption statistics.
Glossary
- ED: emergency department.
- Excess deaths: deaths above the number expected from earlier years on the same dates.
- Heat-stress death: a death caused directly by heat illness such as heat stroke.
- Heat-exacerbated death: a death where heat worsened an existing illness such as heart disease.
- HHS region: one of ten US Department of Health and Human Services regions.
- HeatRisk: a five-level forecast of heat health risk from the National Weather Service and CDC.
- NSSP: the CDC National Syndromic Surveillance Program, which reads ER visit data.
Sources
- CDC NCHS, QuickStats on heat-related deaths by age group, 2024
- CDC MMWR, QuickStats on heat death rates among states, 2021
- CDC MMWR, Heat-Related Deaths, United States, 2004 to 2018
- CDC MMWR, Heat-Related Deaths, Chicago, 1996 to 2001
- CDC MMWR, Heat-Related ER Visits, May to September 2023
- CDC MMWR, Heat-Related ER Visits during the Northwestern Heat Wave, June 2021
- CDC MMWR, Heat-Related ER Visits, June 28 to July 7, 2026
- CDC, Heat and Health Tracker fact sheet
- CDC NIOSH, Heat Stress in Construction
- CDC NIOSH, Take Action Now to Prevent Heat-Related Illness at Work
- National Weather Service, Summary of Natural Hazard Statistics for 2024
- NPR and Boston University, heat death investigation
- Environmental Epidemiology, excess deaths from heat in 297 US counties
- University of Washington Climate Impacts Group, In the Hot Seat
- Oregon Health Authority, Climate and Health in Oregon 2021 to 2022
- California Department of Public Health, Excess Mortality During the September 2022 Heat Wave
- BC Coroners Service, Extreme Heat and Human Mortality
- Maricopa County Public Health, 2025 Heat-Related Deaths Report
- Maricopa County Public Health, 2024 Shows First Decline in Heat Deaths in a Decade
- Southern Nevada Health District, Heat-Associated Deaths and ER Visits, 2025 Report
- NYC Health Department, 2026 NYC Heat-Related Mortality Report
- Harvard T.H. Chan School of Public Health, Heat waves and annual death rates in older adults
- PLoS One, Heatwaves, medications and heat-related hospitalization in older Medicare beneficiaries
- NoHeatStroke.org, Heatstroke deaths of children in vehicles
- Bureau of Labor Statistics, Table A-9, fatal occupational injuries 2024
- Bureau of Labor Statistics, work-related deaths from environmental heat
- Bureau of Labor Statistics, It’s summer and it’s hot on the job
- OSHA, Heat Injury and Illness Prevention rulemaking
- Military Health System, MSMR heat exhaustion and heat stroke update
- U.S. Energy Information Administration, RECS 2020 table HC 7.1
- Journal of Political Economy, Adapting to Climate Change
- National Bureau of Economic Research, Working Paper 18692
- Environmental Science & Technology, How Blackouts during Heat Waves Amplify Mortality and Morbidity Risk
- Climatic Change, Climate change increases ER visits for heat-related illness
- Lancet Countdown, 2025 data explorer
- Lancet Countdown, Australia 2025 data sheet
- The Innovation, Global excess deaths associated with heatwaves in 2023
- Nature Medicine, Heat-related mortality in Europe during the summer of 2022
- ISGlobal, Over 62,700 deaths associated with heat in Europe, summer 2024
- UK Health Security Agency, 1,504 heat-related deaths in summer 2025
- UK Health Security Agency, Heat mortality monitoring report, England 2025
- Scientific Reports, Heatstroke emergency transport in Japan, 2010 to 2024
- npj Natural Hazards, Analysis of the 2024 Hajj heat event
- National Centre for Disease Control India, National Action Plan on Heat-Related Illness
- Nature Communications, Rapid increase in the risk of heat-related mortality