Heat wave statistics for 2026 tell a plain story: hotter days, hotter nights, longer spells and a power grid that is asked to carry more than it was built for. The United States just had its warmest summer on record, and Europe, Asia and the Middle East set their own records in 2025 and 2026.
This page collects dated numbers from the agencies that measure the heat: weather services, climate research groups, grid operators and energy regulators. Each figure is linked to its source, and each figure appears once.
The readers are HVAC techs, homeowners and anyone who plans around peak load. Temperature records come first. Grid strain, power prices and home cooling load follow, because that is where a hot week turns into a service call. For the human toll, see the page on heat-related deaths. For equipment, see the page on air conditioning.
Key Takeaways
- The US summer of 2026 averaged 74.4°F, the warmest June to August in 132 years, beating the records set in 1936 and 2021 by 0.4°F (NOAA NCEI, Sep 2026).
- August 2026 was the warmest August on record worldwide, at 1.32°C above the 20th-century average (NOAA NCEI, Sep 2026).
- Hot extremes have become more frequent and more intense across most land regions since the 1950s, and this is rated virtually certain (IPCC, Aug 2021).
- Climate change roughly tripled the chance of the April 2026 heat wave in South Asia (World Weather Attribution, May 2026).
- Türkiye reached 50.5°C at Silopi on 25 July 2025, the first 50°C reading in the country (WMO, May 2026).
- Japan’s summer of 2025 ran 2.36°C above the 1991 to 2020 average, 0.60°C above the old record (WMO, May 2026).
- Sub-Arctic Fennoscandia had a 21-day heat wave in July 2025, almost double the previous worst of 11 days in 1972 (Copernicus, Apr 2026).
- Days over 30°C and nights over 18°C more than quadrupled in Greater London between 1961 to 1990 and 2016 to 2025 (Met Office, Jul 2026).
- Lower 48 electricity demand hit a record 759,180 MW on 29 July 2025, 1.9% above the 2024 peak (EIA, Aug 2025).
- PJM’s real-time price peaked at $1,334 per MWh on 23 June 2025, against $52 a week earlier (EIA, Jun 2025).
- The hot third quarter of 2026 lifted US residential electricity sales by 6% over the same quarter of 2025 (EIA, Oct 2026).
- NOAA’s billion-dollar disaster list names 18 drought and heat wave events from 1980 to 2024, worth $273 billion in inflation-adjusted cost (NOAA NCEI, Dec 2024).
Extreme Heat Statistics: How Hot Has the Planet Become?
The planet is not having one hot year. It is on a run of hot years, and the 2026 readings are close to the top of that run.
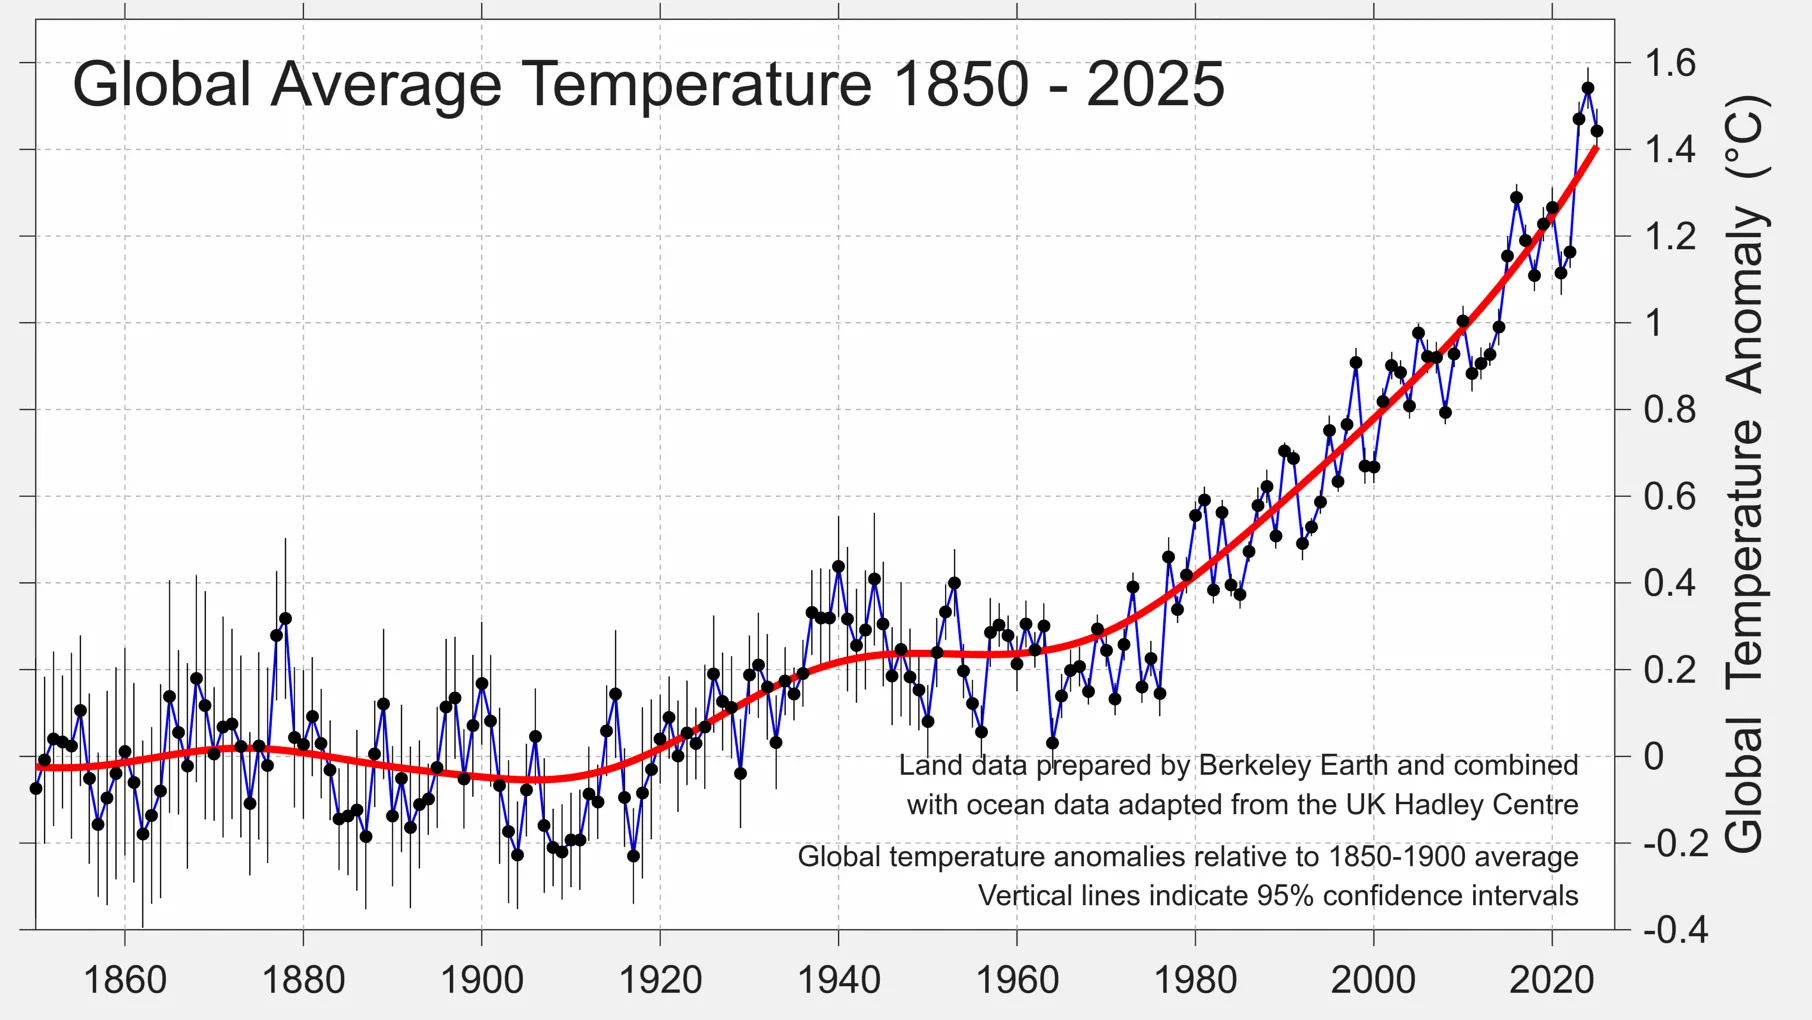
Where does 2025 rank among the hottest years?
Second or third, depending on the dataset, and always within a fraction of a degree of the record set in 2024.
- NOAA ranks 2025 as the third-warmest year in its global record, which dates back to 1850 (NOAA NCEI, Jan 2026).
- NOAA puts the 2025 surface temperature 1.17°C above the 20th-century average and 1.34°C above the 1850 to 1900 average (NOAA NCEI, Jan 2026).
- All 10 of the warmest years in the NOAA record have occurred since 2015 (NOAA NCEI, Jan 2026).
- NASA puts 2025 at 1.19°C above the 1951 to 1980 average, effectively tied with 2023 (NASA, Jan 2026).
- NASA’s analysis draws on more than 25,000 meteorological stations plus ship, buoy and Antarctic data (NASA, Jan 2026).
- Berkeley Earth estimates 2025 at 1.44°C above 1850 to 1900, with an uncertainty of 0.09°C (Berkeley Earth, Jan 2026).
- The WMO gives 1.43°C above 1850 to 1900 and calls 2025 the second or third warmest year (WMO, Mar 2026).
Which regions ran hottest in 2025?
Land ran hotter than the global average, and every continent finished in its top 10.
- Berkeley Earth puts the 2025 land average at 2.03°C above 1850 to 1900, the third year above 2.0°C (Berkeley Earth, Jan 2026).
- Every continent ranked in its top 10 warmest years in 2025, and Europe, Oceania and the Arctic each had their second warmest (NOAA NCEI, Jan 2026).
- Europe is warming at around twice the global average, the fastest of any WMO region (Copernicus, Apr 2026).
- Five of Europe’s warmest years have come since 2019, and ten since 2014 (Copernicus, Apr 2026).
- The UK’s 2025 was its warmest year in a series that starts in 1884 (Met Office, Jul 2026).
- The UK decade 2016 to 2025 ran 0.51°C warmer than 1991 to 2020 (Met Office, Jul 2026).
How warm was 2026 through September?
Close to a record again. NOAA expects 2026 to finish among the five warmest years.
- January to September 2026 ranked second warmest on record, behind 2024 (NOAA NCEI, Oct 2026).
- June to August 2026 was 1.21°C above average, the highest in NOAA’s 177-year record (NOAA NCEI, Sep 2026).
- The Northern Hemisphere had its warmest meteorological summer on record in 2026 (NOAA NCEI, Sep 2026).
- North America and Africa each had their warmest August on record (NOAA NCEI, Sep 2026).
- September 2026 was the second-warmest September, and the 51st in a row above the 20th-century average (NOAA NCEI, Oct 2026).
- The Arctic, North America and Asia each had their warmest September on record (NOAA NCEI, Oct 2026).
- About 770 million people, 8.5% of the world, lived somewhere that set a local annual heat record in 2025 (Berkeley Earth, Jan 2026).
How Often Do Heat Waves Happen and How Long Do They Last?
Frequency is the headline, and length is catching up. The long records show more hot days every decade almost everywhere on land.
How much more often do hot extremes strike?
More often in nearly every region. Frequency shows the clearest change of any heat wave measure.
- Some hot extremes of the past decade would have been extremely unlikely without human influence on the climate (IPCC, Aug 2021).
- Every extra 0.5°C of warming causes clearly discernible increases in the intensity and frequency of hot extremes (IPCC, Aug 2021).
- Heat wave frequency showed the most rapid and significant change in almost all regions, and no region showed a significant decrease (Nature Communications, Jul 2020).
- Most regions gained at least one extra heat wave day per decade from 1950 to 2017, and low latitudes gained as many as 3 to 5 (Nature Communications, Jul 2020).
- Cities intensify warming locally, so more frequent hot extremes will make city heat waves more severe, a finding the IPCC rates very high confidence (IPCC, Aug 2021).
How has the length of heat waves changed?
Slowly but steadily. A day or less per decade adds up over a lifetime, and the Mediterranean shows the faster end.
- Heat waves grew longer by 0.2 to over 1 day per decade in the regions studied from 1950 to 2017 (Nature Communications, Jul 2020).
- In the Mediterranean, heat wave frequency rose by over 2 days per decade for trends starting in 1950, and by 6.4 days per decade for trends starting in the early 1980s (Nature Communications, Jul 2020).
- The authors advise judging regional heat wave trends over at least 3 to 4 decades (Nature Communications, Jul 2020).
- Marine heat waves have about doubled in frequency since the 1980s (IPCC, Aug 2021).
- Northwest European seas had 297 marine heat wave days in 2025, the most since 1982 and well above the previous high of 178 in 2023 (Met Office, Jul 2026).
What do hot days and nights look like in one place?
Local numbers move faster than global ones. Southern Europe and southern England show it clearly.
- The average hottest day of the year has warmed by more than 4.5°C in a band from Kent to Lincolnshire, comparing 2016 to 2025 with 1961 to 1990 (Met Office, Jul 2026).
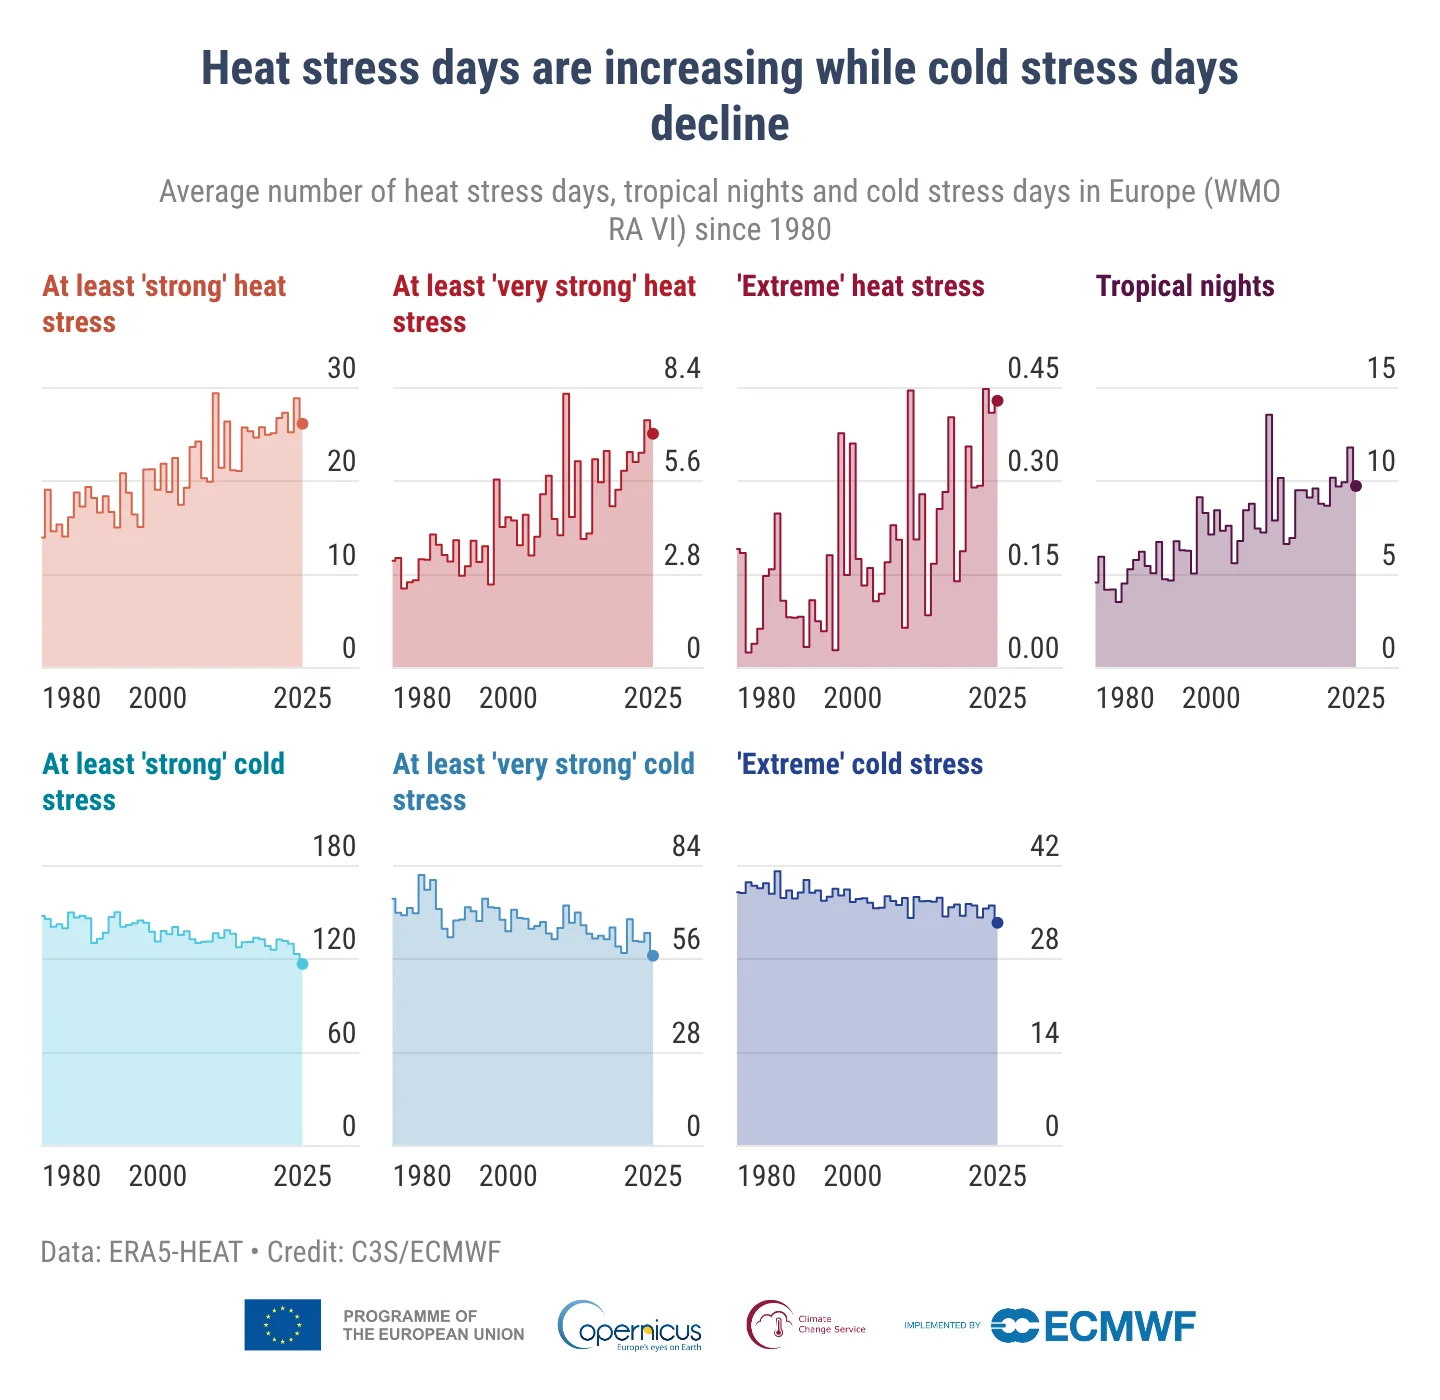
- In 2025, 41% of Europe had more days than average with at least strong heat stress, a feels-like temperature of 32°C or higher, and 19% had fewer (Copernicus, Apr 2026).
- Southern and eastern Spain saw up to 50 more strong heat stress days than average (Copernicus, Apr 2026).
- The Iberian Peninsula and Mediterranean coasts had up to 30 more tropical nights than average, and up to 40 more in some places (Copernicus, Apr 2026).
- Europe as a whole saw a record low number of cold stress days in 2025 (Copernicus, Apr 2026).
How Hot Was the US Summer of 2026?
The summer of 2026 did not come out of nowhere. The country has been running hot since early 2025, and the nights did as much of the work as the days.
How did 2025 set the stage?
It was the fourth-warmest year on record, with the heat concentrated in the West.
- The contiguous US averaged 54.6°F in 2025, 2.6°F above the 20th-century average and fourth warmest in 131 years (NOAA NCEI, Jan 2026).
- Utah and Nevada set annual records at 4.3°F and 3.7°F above their 20th-century averages (NOAA NCEI, Jan 2026).
- Sixty-two counties in 10 states, home to more than eight million people, had their warmest year on record (NOAA NCEI, Jan 2026).
- Extremes in overnight minimum temperatures covered more than 85% of the West, Northwest and Southwest, and over half of the contiguous US (NOAA NCEI, Jan 2026).
How warm was spring 2026?
Warm enough to set a monthly record in March, months before summer began.
- March 2026 ran 9.4°F above the 20th-century average, the warmest March in 132 years (NOAA NCEI, Apr 2026).
- A total of 1,432 counties, over half the country’s area and one third of its people, saw their single warmest March day on record (NOAA NCEI, Apr 2026).
- April 2025 to March 2026 was the warmest 12-month span ever recorded for the contiguous US (NOAA NCEI, Apr 2026).
- Arizona, New Mexico, Colorado and Texas each had their warmest spring on record (NOAA NCEI, Jun 2026).
What happened in July and August 2026?
The heat was wide and it held at night. Every state ran warm in July, and overnight lows set the record.
- All contiguous states ran at least 1°F above their 20th-century July average, and 13 ranked among their five warmest Julys (NOAA NCEI, Aug 2026).
- July overnight lows averaged 64.2°F, 3.7°F above average, the warmest month on record for average lows and 0.7°F above July 2022 (NOAA NCEI, Aug 2026).
- July daytime highs averaged 89.5°F, only the sixth-warmest month for highs, which shows the nights led the record (NOAA NCEI, Aug 2026).
- Wyoming had its warmest July and warmest month on record, 6.3°F above average (NOAA NCEI, Aug 2026).
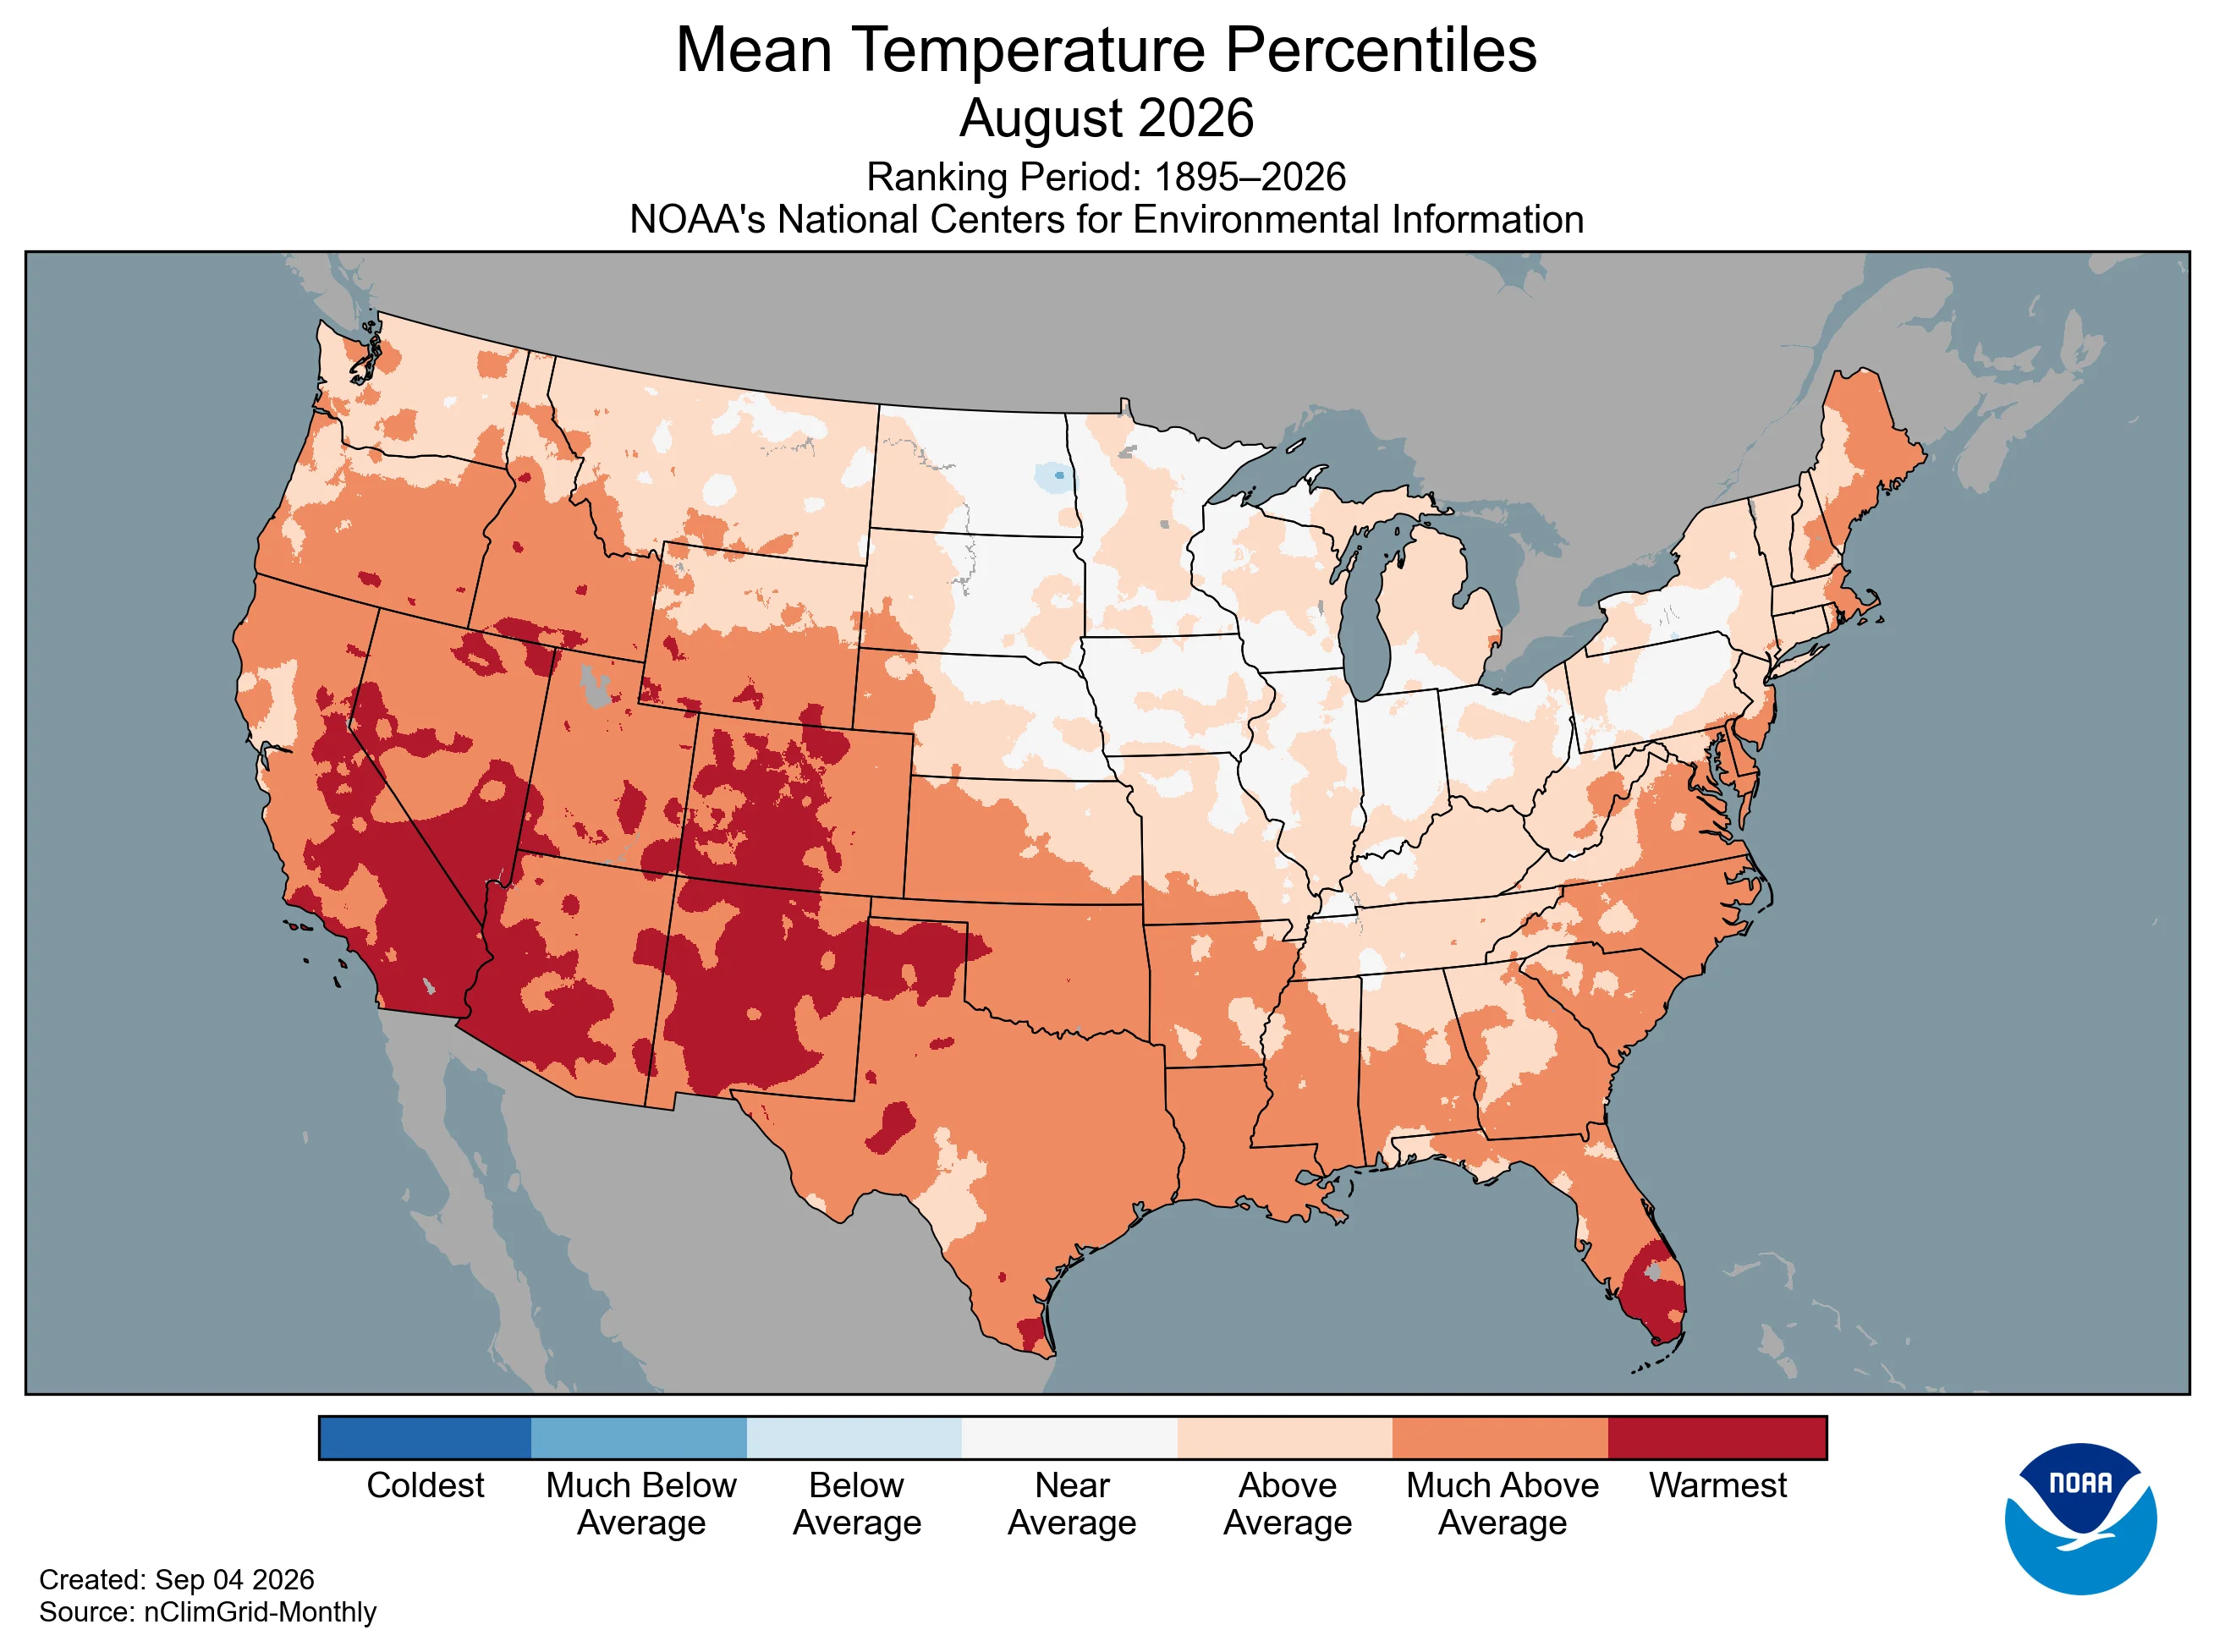
- August 2026 averaged 75.6°F, 3.5°F above the 20th-century average and the warmest August on record (NOAA NCEI, Sep 2026).
- August daytime highs averaged 88.6°F, also the warmest on record (NOAA NCEI, Sep 2026).
- California, Nevada, New Mexico and Colorado each had their warmest August on record (NOAA NCEI, Sep 2026).
- Overnight lows in August were record warm in six states: California, Nevada, Arizona, Utah, New Mexico and Colorado (NOAA NCEI, Sep 2026).
- Arizona (tied), New Mexico, Utah and Colorado each had their warmest summer on record (NOAA NCEI, Sep 2026).
How long did the streak run?
Into the fall. The streak has no end date yet, and drought followed it.
- September 2026 averaged 69.4°F, the warmest September on record (NOAA NCEI, Oct 2026).
- The contiguous US has run above its 20th-century monthly average for 20 straight months, from February 2025 to September 2026 (NOAA NCEI, Oct 2026).
- Four months of 2026 ranked warmest on record: March, July, August and September (NOAA NCEI, Oct 2026).
- Drought covered 59.1% of the contiguous US on 1 September 2026 (NOAA NCEI, Sep 2026).
- Drought covered 89% of the South region on 29 September, the most since October 2000 (NOAA NCEI, Oct 2026).
Which Temperature Records Fell Around the World?
Records are no longer rare events. In 2025 they fell in Europe, Asia, the Middle East and North America within the same summer.
What happened in Europe in 2025?
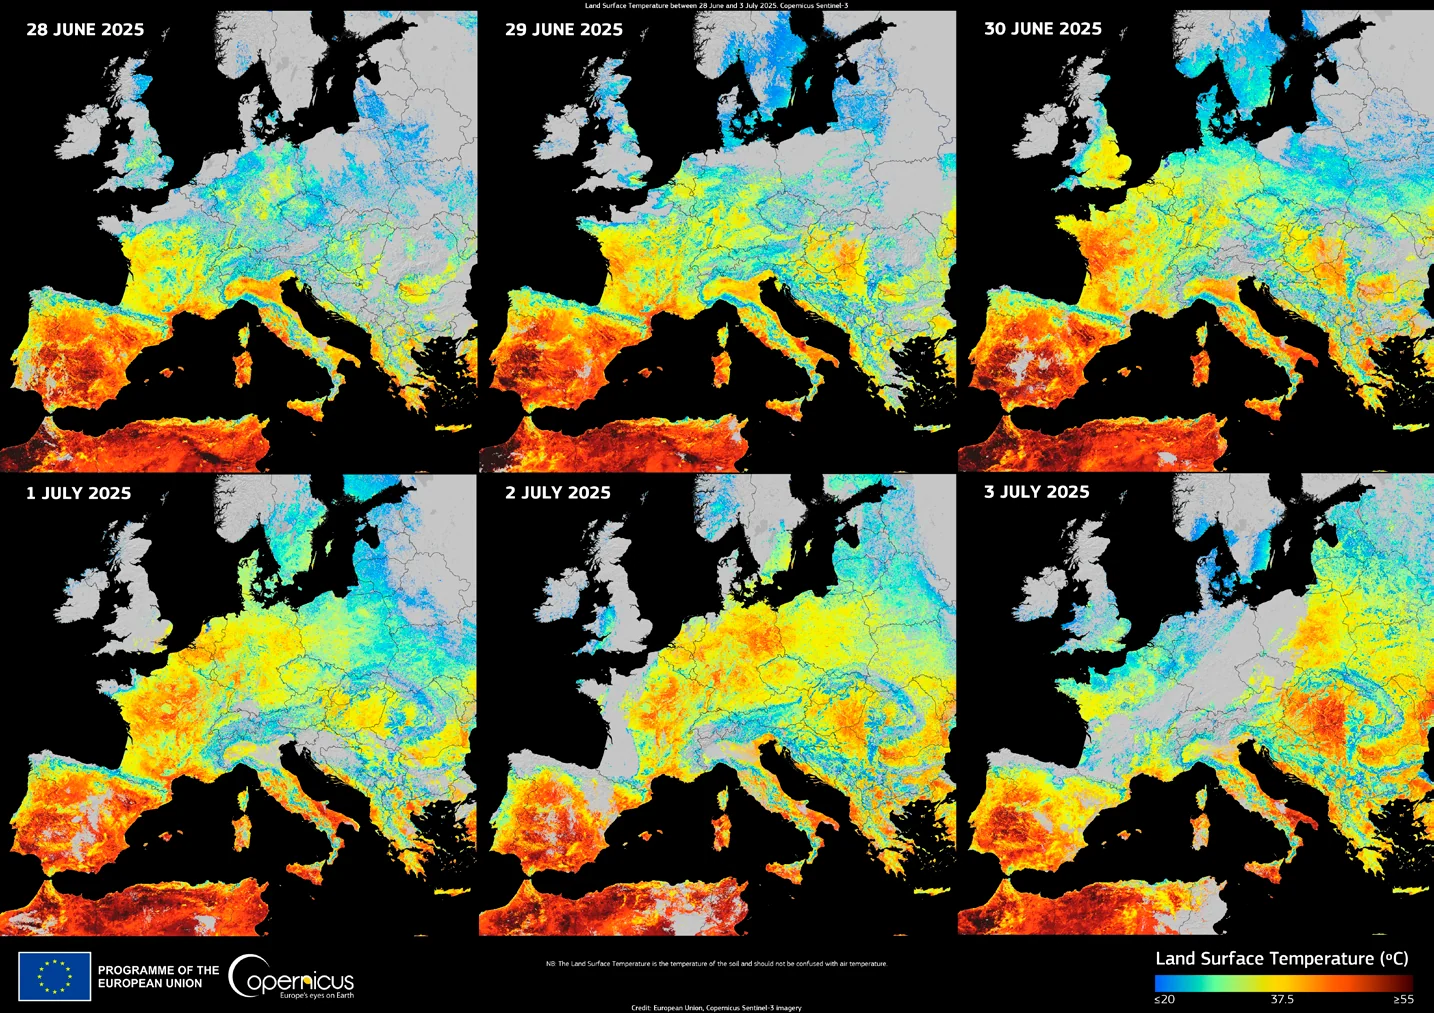
A string of national and monthly records, from Portugal to the Arctic Circle.
- Norway’s Namsskogan and Gartland stations logged 13 straight days at or above 30°C, a national record (WMO, May 2026).
- Finland saw 30°C somewhere in the country every day from 12 July to 2 August (WMO, May 2026).
- The highest Fennoscandian reading in July was 34.9°C at Frosta, Norway on 17 July (Copernicus, Apr 2026).
- Central Fennoscandia had up to 12 days of strong heat stress, a record, in a region that usually sees up to two (Copernicus, Apr 2026).
- France’s heat wave ran from 19 June to 4 July, and only the 2003 event matched it for intensity over such a length (WMO, May 2026).
- Portugal’s Mora reached 46.6°C on 27 June, a national June record (WMO, May 2026).
- Spain ran 4.6°C above normal over the 16 days from 3 to 18 August, more intense than any earlier heat wave of that length (WMO, May 2026).
- Serbia had its hottest June on record, and Switzerland its second hottest (WMO, May 2026).
What happened in Asia and the Middle East?
The heat was extreme in both daytime highs and in how long it lasted.
- Japan set a national record of 41.8°C at Isesaki on 5 August (WMO, May 2026).
- Japan, China and the Republic of Korea all had their hottest summers on record, the third year in a row for eastern Asia (WMO, May 2026).
- China had its third-longest heat wave on record, and 56 stations set all-time highs, including 48.7°C at Turpan (WMO, May 2026).
- Shymkent, Kazakhstan hit 43.7°C on 22 July during six days in a row above 40°C (WMO, May 2026).
- Sixty-six stations in Türkiye had their hottest day on record in the July heat (WMO, May 2026).
- Israel’s Gilgal reached 49.7°C on 14 August, the second highest reading in the country since 1948 (WMO, May 2026).
- Aqaba airport in Jordan hit 49.6°C, and Bahrain had 10 days in a row above 40°C (WMO, May 2026).
What happened in North America in 2025?
The Southwest and northern Mexico took the extremes in August.
- Mexicali, Mexico reported 52.7°C on 12 August, the highest temperature on record for Mexico (WMO, May 2026).
- Phoenix reached 47.8°C on 7 August, its highest August temperature on record (WMO, May 2026).
How Much Worse Did Climate Change Make Recent Heat Waves?
Attribution science now puts a number on single events, and the numbers are large. Each of the three 2026 studies below finds that the heat was far more likely, and far hotter, than it would have been in a cooler climate.
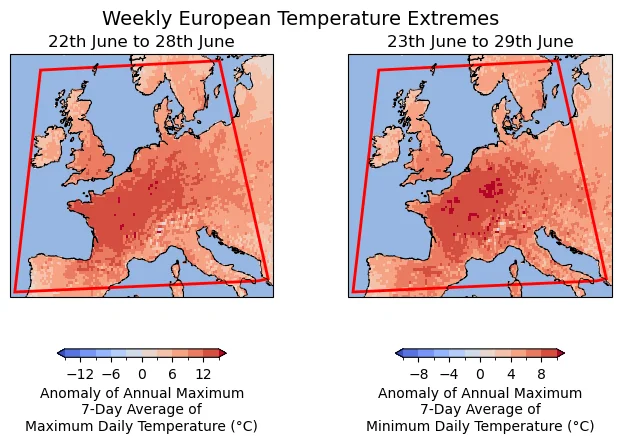
What did the June 2026 European heat wave show?
It was the most severe on record for the region studied, and the nights showed the biggest shift.
- Temperatures reached 5 to 12°C above seasonal averages across France, Germany, Italy, Spain and southern England (World Weather Attribution, Jun 2026).
- The hottest daily temperatures in Western Europe are warming at about triple the rate of global warming, and night temperatures at about twice the rate (World Weather Attribution, Jun 2026).
- A similar June heat wave would have been about 3.5°C cooler by day in 1976 and about 2°C cooler in 2003 (World Weather Attribution, Jun 2026).
- It would have been about 2.4°C cooler by night in 1976 and about 1.3°C cooler in 2003 (World Weather Attribution, Jun 2026).
- Daytime heat like this was about 10 times less likely in 2003, and nighttime heat more than 100 times less likely (World Weather Attribution, Jun 2026).
- During the 18 to 29 June event, 45% of European cities passed indoor wet bulb globe temperature thresholds (World Weather Attribution, Jun 2026).
What did the South Asia and US events show?
The same pattern held in both: more likely, hotter and, in the US case, more humid.
- Without climate change, the April 2026 South Asia heat wave would have been about 1°C cooler (World Weather Attribution, May 2026).
- Hot April days like the hottest of 2026 are now about 20 times more likely and about 1°C hotter (World Weather Attribution, May 2026).
- Another 1.3°C of warming would make such an event more than twice as likely again, and another 1.2°C hotter (World Weather Attribution, May 2026).
- Earlier studies found the 2022 India and Pakistan heat about 30 times more likely, and the 2024 India to Vietnam heat about 45 times more likely (World Weather Attribution, May 2026).
- The July 2026 US heat dome set the highest wet bulb globe temperatures on record across the study region, in a climate that has warmed 1.4°C (World Weather Attribution, Jul 2026).
- A heat index of 105°F is roughly equal to 28 to 30°C wet bulb globe temperature, the level where sport turns dangerous even for the young and fit (World Weather Attribution, Jul 2026).
- Historically redlined districts in US cities run up to 7°C hotter than their non-redlined neighbours (World Weather Attribution, Jul 2026).
How Do Heat Waves Strain the Power Grid?
Cooling is the swing load of the summer grid, and heat waves are when the swing is largest. Records keep falling, and reserve margins are healthy in some regions and thin in others.
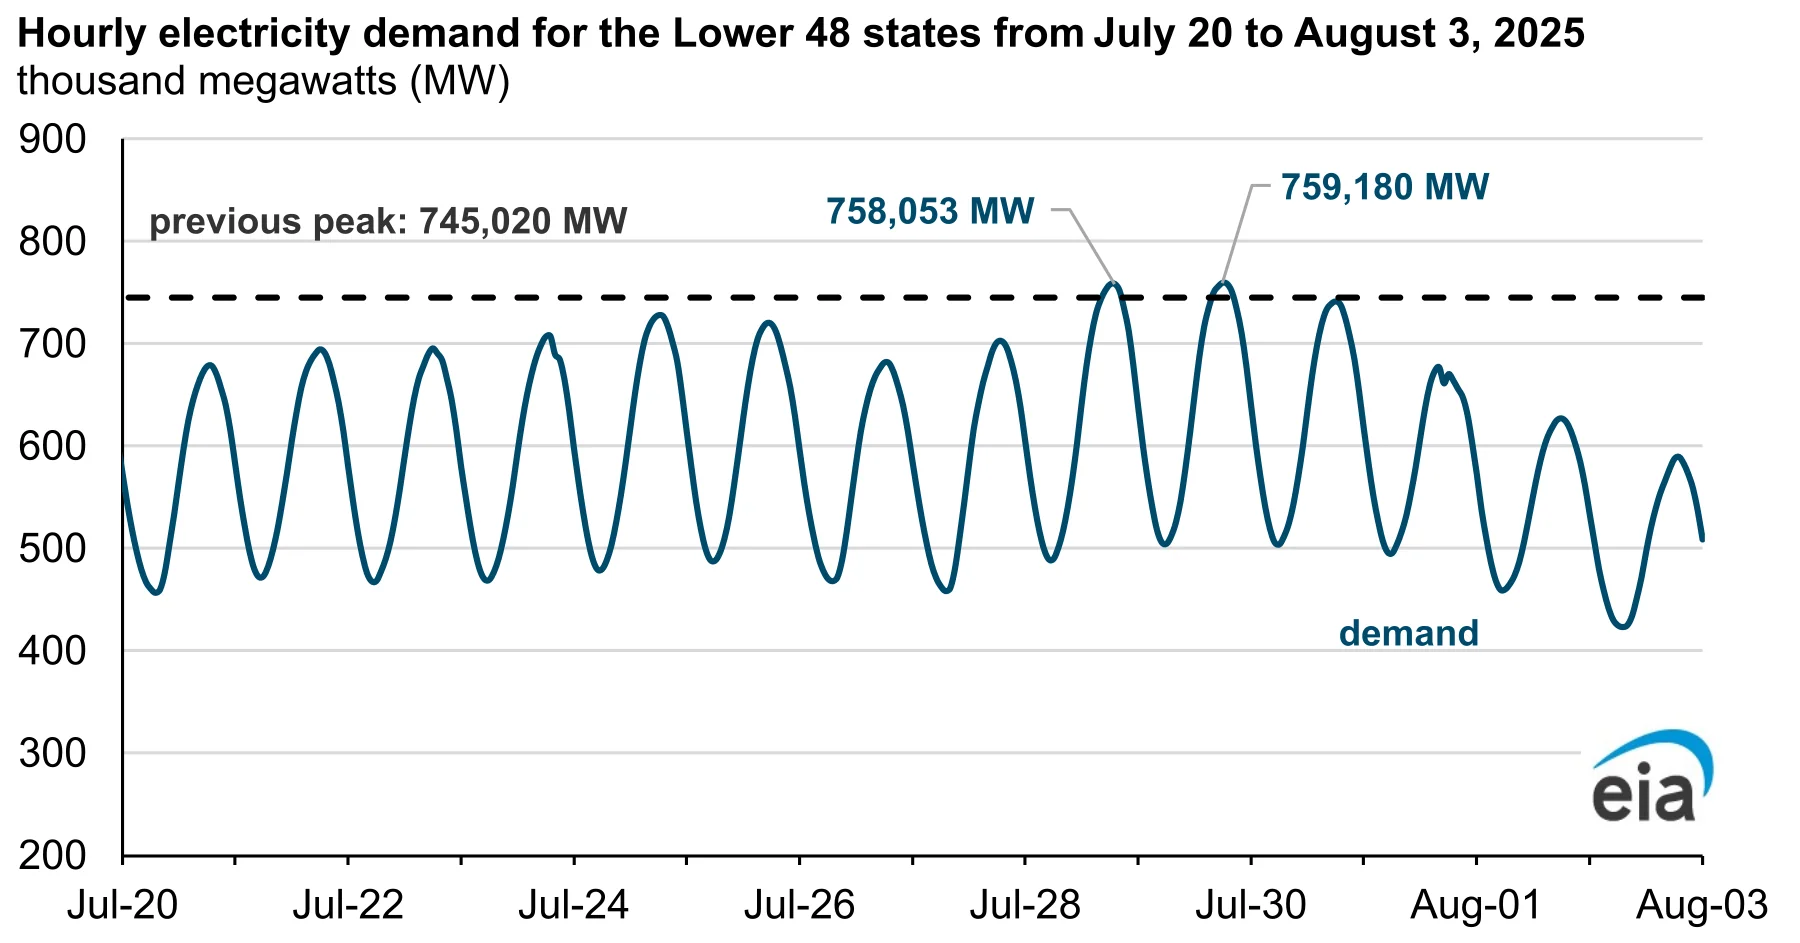
How high did national demand climb?
Higher than ever, two years running in the summer peaks.
- Lower 48 demand reached 758,053 MW on 28 July 2025, above the earlier record of 745,020 MW set on 15 July 2024 (EIA, Aug 2025).
- Lower 48 summer hourly peaks in 2022 and 2023 were 743 and 742 gigawatthours, almost identical, which makes the 2025 jump stand out (EIA, Oct 2024).
- Demand across the Eastern Interconnection peaked at 502,670 MW on 21 June 2024, against 467,609 MW for the June peak in 2023 (EIA, Jul 2024).
- Bangor, Maine reached 96°F on 20 June 2024, a temperature not seen there since 1931 (EIA, Jul 2024).
How did PJM and New England respond?
With records, alerts and imports. New England shows how a single evening can set the year’s peak.
- PJM load passed its seasonal forecast of 154,000 MW on 23 June 2025 but stayed below its 2006 record of 165,563 MW (EIA, Jun 2025).
- ISO New England’s evening peak of 26,024 MW on 24 June 2025 was the highest in the region since 2013 (ISO New England, Jun 2025).
- A typical New England summer day peaks near 18,000 MW (ISO New England, Jul 2026).
- The July 2026 peak was 25,832 MW on 2 July, at 96°F with a dew point of 70°F (ISO New England, Aug 2026).
- The July 2025 peak came at 93°F with a dew point of 65°F (ISO New England, Aug 2026).
- Total July 2026 demand was 11,436 GWh, down 6.1% on July 2025, as the monthly average temperature fell 2°F (ISO New England, Aug 2026).
- One megawatt can serve about 750 to 1,000 average New England homes (ISO New England, Jul 2026).
How tight are summer reserves?
Adequate on a normal day, and tighter when the weather turns extreme. NERC also warns that early heat can collide with spring maintenance.
- NERC found adequate anticipated resources in every assessment area for normal summer peak load in 2026 (NERC, May 2026).
- The North American bulk power system added slightly more than 58 GW of new resources year on year heading into summer 2026 (NERC, May 2026).
- New England’s anticipated reserve margin is 14%, just above its 13% reference level (NERC, May 2026).
- The Northwest’s anticipated reserve margin fell from 32% to 27% as demand rose and drought threatened hydropower (NERC, May 2026).
- PJM forecasts about 26% installed reserves against a requirement of 18.6%, and expects to call on demand response in extreme heat (NERC, May 2026).
What Do Heat Waves Cost in Power Prices, Fuel and Output?
A heat wave is expensive in three places at once: the wholesale market, the fuel bill for the plants that run, and the work that does not get done.
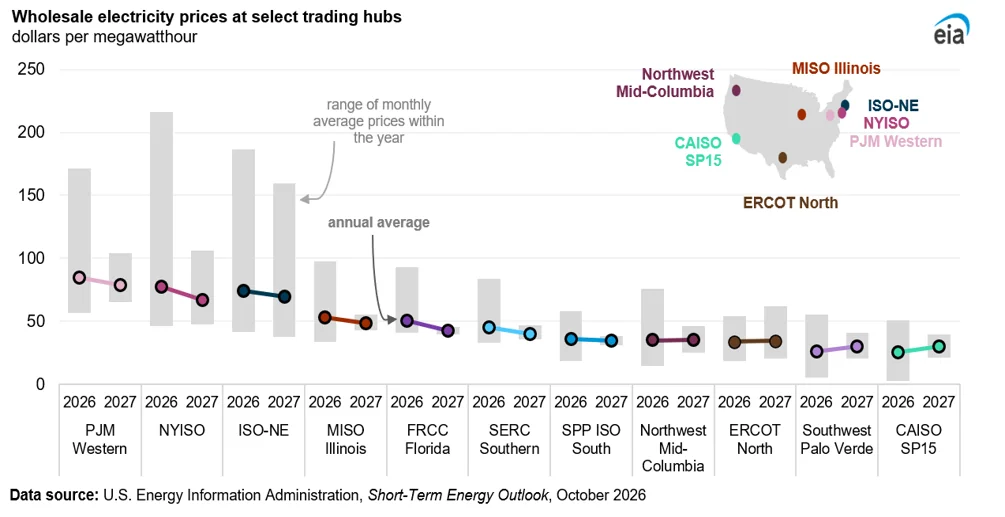
How far do wholesale prices jump?
By more than an order of magnitude in a single evening, when the last and costliest units are called on.
- New England’s real-time price peaked at $1,110 per MWh on 24 June 2025, against $65 the week before (EIA, Jun 2025).
- Petroleum generation in PJM, the costliest kind, ran at three times its level of the day before at the 23 June 2025 peak (EIA, Jun 2025).
- At the New England peak, 47% of power came from gas, 12% from imports and 12% from petroleum (EIA, Jun 2025).
- The wholesale price across 11 US hubs is forecast at $52 per MWh in 2026, 11% above 2025, partly because of high summer temperatures (EIA, Oct 2026).
- PJM wholesale prices are forecast to rise 41% in 2026 (EIA, Oct 2026).
Which fuels fill the gap?
Gas first, then oil and imports. On the hottest day of July 2024, wind output also fell.
- Gas supplied 56% of New England’s power in the week of the June 2024 heat wave and peaked at 61%, against a five-year average of 48% (EIA, Aug 2024).
- New England generated 468,403 MWh on 10 July 2024, 31% above its five-year average (EIA, Aug 2024).
- US gas-fired plants generated 6.9 million MWh on 9 July 2024, probably the most in history, as wind fell to 0.3 million MWh from a June average of 1.3 million (EIA, Jul 2024).
- On 2 August 2024 gas plants produced 7.1 million MWh, 6.8% above the old record, and nine of the ten biggest gas days were in summer 2024 (EIA, Oct 2024).
What do heat waves cost the wider economy?
Billions in the large events, and measurable output loss on ordinary hot days.
- Productivity on a day falls about 1.7% for each 1°C that the daily average rises above 15°C, net of adaptation (NBER, Dec 2014).
- A weekday above 30°C costs the average US county $20 per person (NBER, Dec 2014).
- Five of those NOAA events began in 2020 to 2024, against three in the whole of the 2010s (NOAA NCEI, Dec 2024).
- The 1988 US drought and heat wave is the costliest on the list at $54.6 billion, inflation adjusted (NOAA NCEI, Dec 2024).
- The 2012 event cost $41.7 billion and the 2022 event $23.5 billion, on the same basis (NOAA NCEI, Dec 2024).
- A typical US residential customer was expected to pay $178 a month for electricity in the summer of 2025, against $173 the summer before (EIA, Jun 2025).
How Do Hot Spells Change the Cooling Load of a Home?
A home does not feel the national average. It feels the local peak, the length of the spell and how warm the night stays. Summer 2026 raised all three in much of the country.
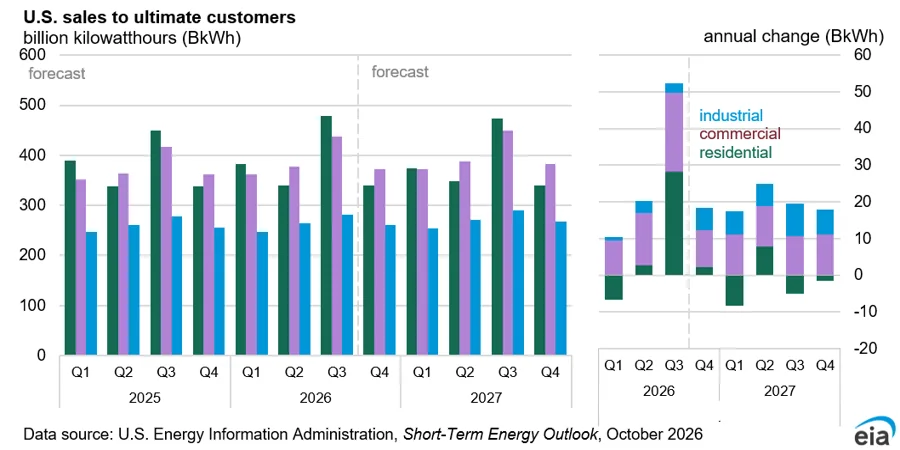
How much more cooling did summer 2026 need?
About 14% more than the third quarter of 2025, and well above the 10-year norm.
- US population-weighted cooling degree days reached 1,027 in the third quarter of 2026, against 902 a year earlier and a 10-year average of 929 (EIA, Oct 2026).
- The full-year 2026 total is forecast at 1,663 cooling degree days, against a 10-year average of 1,527 (EIA, Oct 2026).
- The West North Central states logged 881 cooling degree days in the third quarter, against a 10-year average of 699 (EIA, Oct 2026).
- The West South Central states logged 1,829, against a 10-year average of 1,597 (EIA, Oct 2026).
- Total US electricity use rose 4% in the third quarter, and commercial use rose 5% (EIA, Oct 2026).
Why do hot nights and long spells matter for equipment?
Because a system that runs through the night gets no rest. The July record for overnight lows, covered above, is the number to keep in mind.
- European homes, schools and transport were not designed for prolonged extreme heat, and city risk is higher because of aging building stock (World Weather Attribution, Jun 2026).
- ISO New England asked customers to pre-cool homes and shift appliance use away from the 4 to 8 p.m. window, when demand is typically highest (ISO New England, Jul 2026).
What should a load check use?
The local design conditions and the real home, not a national figure. Duct size, glass area, insulation and attic heat all change the answer for the same town.
Two free tools help with a first pass: the BTU calculator for load and the AC tonnage calculator for equipment size.
Methodology and Sources
Every figure comes from the agency, regulator, research body or grid operator that produced it. Aggregators, roundups and competitor pages are not used. Each URL was opened and the number was read on the page or in the downloaded file before it went in. Wording follows the source: “heat wave” and “heatwave” mean the same here, and dates are the source’s publication or data date.
The NOAA billion-dollar counts and decade splits in this page are a tally of the event file NOAA published for 1980 to 2024, counting events with “heat” in the event name. They are our arithmetic on NOAA data, not a NOAA statement. Cooling degree day values are EIA’s population-weighted estimates, and third quarter 2026 values are estimates in the October 2026 outlook.
This page is refreshed monthly. Next refresh: NOAA’s October 2026 climate reports, EIA’s November 2026 outlook and the fall grid and weather notes.
Glossary
- Anomaly: the difference between a measured temperature and a chosen baseline average.
- CONUS: the contiguous United States, the lower 48 states.
- Cooling degree days: a measure of cooling need, counting how far each day’s average temperature sits above 65°F.
- EIA: the US Energy Information Administration.
- GW, MW, GWh, MWh: gigawatt, megawatt, gigawatt-hour, megawatt-hour. Power and energy units for grid demand and output.
- Heat stress (UTCI): a feels-like temperature index from the Universal Thermal Climate Index. Strong is 32°C, very strong 38°C and extreme 46°C.
- ISO and RTO: independent system operator and regional transmission organization. Examples here are PJM and ISO New England.
- NCEI: NOAA’s National Centers for Environmental Information.
- NERC: the North American Electric Reliability Corporation.
- Tropical night: a night when the temperature does not fall below 20°C.
- WBGT: wet bulb globe temperature, a heat stress measure that combines heat, humidity, sun and wind.
- WMO: the World Meteorological Organization.
Sources
- Berkeley Earth, Global Temperature Report for 2025
- Copernicus Climate Change Service and WMO, European State of the Climate 2025: Temperature
- Copernicus Climate Change Service and WMO, European State of the Climate 2025: Thermal stress
- Copernicus Climate Change Service and WMO, European State of the Climate 2025: Long heatwave in sub-Arctic Fennoscandia
- EIA, Electricity demand in the Eastern United States surged from heat wave
- EIA, U.S. electricity peak demand set new records twice in July
- EIA, U.S. hourly electricity demand peaked in July with widespread heatwaves
- EIA, June heat wave increased electricity demand in the eastern and midwestern United States
- EIA, Natural gas-fired electricity generation increased during heat waves in New England
- EIA, Natural gas electricity generation in the United States spiked with July heatwave
- EIA, U.S. natural gas-fired electricity generation set new daily records in summer 2024
- EIA, Residential electricity bills could increase slightly this summer
- EIA, Short-Term Energy Outlook
- EIA, Short-Term Energy Outlook: Electricity, Coal and Renewables
- EIA, Short-Term Energy Outlook Table 9c: U.S. Regional Weather Data
- IPCC, Climate Change 2021: Summary for Policymakers
- ISO New England, Hot weather updates: Week of June 23, 2025
- ISO New England, Hot weather updates: Week of June 29, 2026
- ISO New England, Monthly wholesale electricity prices and demand in New England, July 2026
- Met Office, State of the UK Climate 2025
- NASA, Global Temperature
- Nature Communications, Increasing trends in regional heatwaves
- NBER, Does the Environment Still Matter? Daily Temperature and Income in the United States
- NERC, 2026 Summer Reliability Assessment
- NOAA NCEI, Assessing the Global Temperature and Precipitation Analysis in 2025
- NOAA NCEI, Monitoring Global Temperature and Precipitation in August 2026
- NOAA NCEI, Monitoring Global Temperature and Precipitation in September 2026
- NOAA NCEI, Assessing the U.S. Temperature and Precipitation Analysis in 2025
- NOAA NCEI, U.S. Temperature and Precipitation in March 2026
- NOAA NCEI, U.S. Temperature and Precipitation in May 2026
- NOAA NCEI, Assessing the U.S. Temperature and Precipitation in July 2026
- NOAA NCEI, Monitoring the U.S. Temperature and Precipitation in August 2026
- NOAA NCEI, Monitoring the U.S. Temperature and Precipitation in September 2026
- NOAA NCEI, U.S. Billion-Dollar Weather and Climate Disasters events file, 1980 to 2024
- WMO, State of the Global Climate 2025 summary
- WMO, Supplement to the State of the Climate 2025: Significant Weather and Climate Events 2025
- World Weather Attribution, Fossil fuel emissions have rapidly worsened European heatwaves in just a few decades
- World Weather Attribution, Climate change exposes hundreds of millions to longer and deadlier pre-monsoon heat in South Asia
- World Weather Attribution, Fossil fuels are heating America’s 250th birthday