Energy consumption statistics show a world that keeps using more energy, and more of it as electricity. This page collects the latest figures from the agencies that count it: the IEA, the U.S. Energy Information Administration (EIA), the Energy Institute, Eurostat and national bodies. It covers the world, the biggest users, U.S. homes, electricity and data centers.
Every number links to the group that first published it and carries a date. When two agencies measure the same thing in different ways, both figures are shown and named. Updated October 2026.
For HVAC work, the useful point is scale and direction. Homes are a small slice of national energy use, but electricity demand is rising again, and that changes peak load and equipment choices. How much of home energy goes to heating and cooling is covered on the HVAC energy page.
Key Takeaways
- World energy supply passed 600 exajoules (EJ) in 2025, up 1.7% on 2024 (Energy Institute, Jun 2026)
- Fossil fuels still supplied 86% of that energy (Energy Institute, Jun 2026)
- Solar PV met more than one quarter of global energy demand growth in 2025, the first time a modern renewable led (IEA, Apr 2026)
- The United States used 96.2 quadrillion Btu (quads) of energy in 2025 (EIA, Apr 2026)
- U.S. residential use was 11.8 quads, 15% of the national total (EIA, Apr 2026)
- Each person in the U.S. used 265.85 gigajoules of energy in 2024, against a world average of 72.56 (Energy Institute, Jun 2025)
- Global electricity demand grew about 3% in 2025, 2.3 times faster than total energy demand (IEA, Apr 2026)
- The IEA expects world electricity demand to grow 3.6% in 2026 and 3.8% in 2027 (IEA, Jul 2026)
- U.S. electricity consumption reached about 4.20 trillion kWh in 2025, the highest on record (EIA, Apr 2026)
- China used 10.4 trillion kWh of electricity in 2025, the first country above 10 trillion (National Energy Administration, Jan 2026)
- U.S. data centers used 176 TWh in 2023, or 4.4% of all U.S. electricity (Lawrence Berkeley National Laboratory, Dec 2024)
- Data centers could use 6.7% to 12% of U.S. electricity by 2028 (U.S. DOE, Dec 2024)
- Households were 26.0% of final energy use in the EU in 2024 (Eurostat, Jun 2026)
- NERC expects U.S. summer peak demand to rise by more than 224 GW over ten years (NERC, Jan 2026)
How Much Energy Does the World Use Each Year?
World energy use is still rising, but what feeds it is changing faster than the total. Solar now supplies a large part of each year’s growth, while fossil fuels still carry most of the base.
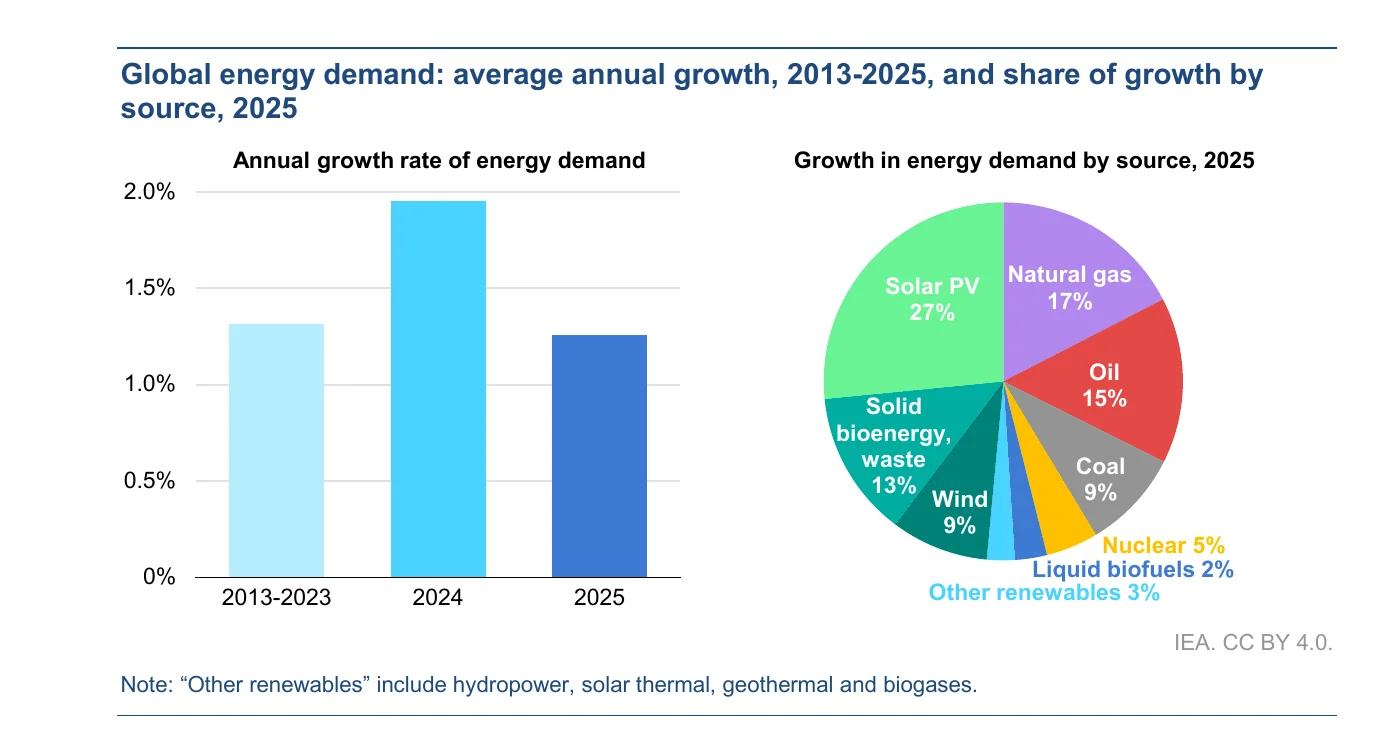
How fast did global energy demand grow in 2025?
Demand grew 1.3% on the IEA’s count and 1.7% on the Energy Institute’s count. The two agencies use different accounting methods, so their totals do not match.
- Global energy demand grew 1.3%, or 8 EJ, in 2025, after 2% growth in 2024 (IEA, Apr 2026).
- Natural gas met 17% of the growth and oil met 15% (IEA, Apr 2026).
- Low-emissions sources together met nearly 60% of the growth (IEA, Apr 2026).
- Global coal demand rose 0.4% in 2025 on the IEA’s count (IEA, Apr 2026).
- Global coal consumption rose 0.7% on the Energy Institute’s count (Energy Institute, Jun 2026).
- Cooling degree days were 6% lower than the record set in 2024, which eased power demand (IEA, Apr 2026).
How much oil and gas does the world burn?
Oil use is near 103 million barrels a day, and gas use is growing more slowly than its recent average.
- Global oil consumption grew 1.3% in 2025 to 103 million barrels a day (Energy Institute, Jun 2026).
- Oil demand rose by about 0.65 million barrels a day on the IEA’s count, down from 0.75 in 2024 (IEA, Apr 2026).
- Global gas demand grew 1.6% in 2025, below the ten-year average of 1.9% (Energy Institute, Jun 2026).
- The IEA puts gas demand growth at about 1%, down from 2.8% in 2024 (IEA, Apr 2026).
How much energy is wasted, and who relies on imports?
Most of the energy the world supplies never does useful work, and three big economies buy most of their oil abroad.
- Two thirds of global energy supply is wasted as heat (Energy Institute, Jun 2026).
- Global energy demand has risen six-fold in 75 years (Energy Institute, Jun 2026).
- Solar supplied 71% of the renewable growth in 2025 (Energy Institute, Jun 2026).
- India imported 86% of the oil it used in 2025, Europe 75% and China 73% (Energy Institute, Jun 2026).
- Global CO2 emissions from energy rose 1.1% to 35,806 million tonnes on the Energy Institute’s count (Energy Institute, Jun 2026).
- The IEA puts the rise in energy-related CO2 at about 0.4% (IEA, Apr 2026).
Which Countries Use the Most Energy, and How Much Per Person?
A few big economies set the world total, while a few small, rich or hot-and-cold places use many times more per person. Per-person use tells you more about lifestyle and climate than the national total does.
Which countries use the most energy?
China, the United States and India use almost half of the world’s energy between them. Figures here are total energy supply for 2024.
- China supplied 158.88 EJ in 2024, 26.8% of the world total (Energy Institute, Jun 2025).
- The United States supplied 91.83 EJ, 15.5% of the world total (Energy Institute, Jun 2025).
- India supplied 38.76 EJ, 6.5% of the world total (Energy Institute, Jun 2025).
- Asia Pacific as a whole supplied 47.2% of world energy (Energy Institute, Jun 2025).
How much energy does each person use?
Per-person use ranges from under 15 gigajoules (GJ) a year in Africa as a whole to hundreds of GJ in oil-rich and cold countries.
- Qatar used 768.50 GJ per person in 2024 and the United Arab Emirates 496.51 (Energy Institute, Jun 2025).
- Canada used 298.64 GJ per person (Energy Institute, Jun 2025).
- South Korea used 254.21 GJ per person (Energy Institute, Jun 2025).
- Japan used 132.81 GJ per person and Germany 119.88 (Energy Institute, Jun 2025).
- China used 111.94 GJ per person (Energy Institute, Jun 2025).
- India used 26.72 GJ per person (Energy Institute, Jun 2025).
- Africa as a whole used 13.88 GJ per person (Energy Institute, Jun 2025).
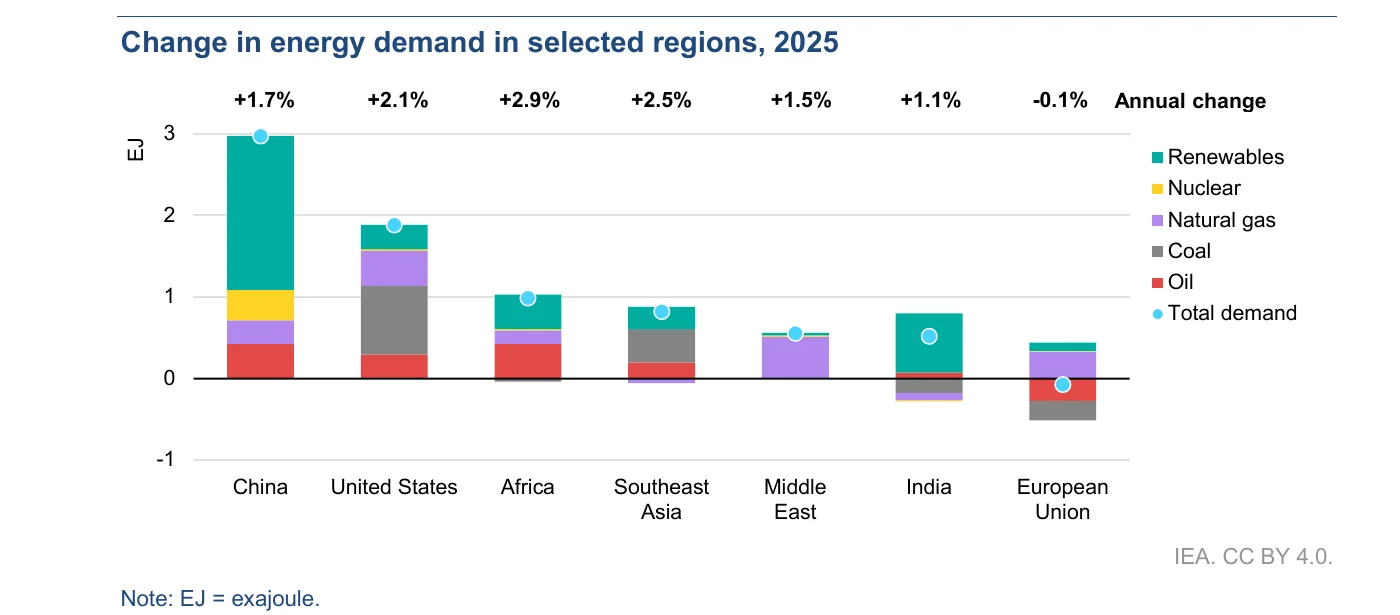
Which regions grew fastest in 2025?
Demand grew in most regions, with the biggest percent gains outside the largest economies.
- China’s demand grew 1.7% in 2025, down from 2.7% a year earlier (IEA, Apr 2026).
- U.S. demand grew more than 2%, the second fastest rise since 2000 outside recession rebounds (IEA, Apr 2026).
- The United States supplied nearly one quarter of global demand growth (IEA, Apr 2026).
- Africa’s demand grew 2.9% and Southeast Asia’s 2.5% (IEA, Apr 2026).
- India’s demand grew about 1% and the European Union’s fell 0.1% (IEA, Apr 2026).
How Much Energy Does the United States Use, and From What?
The United States is the world’s second largest energy user, and its total is still below the 2007 peak. Oil and gas supply nearly three quarters of it.
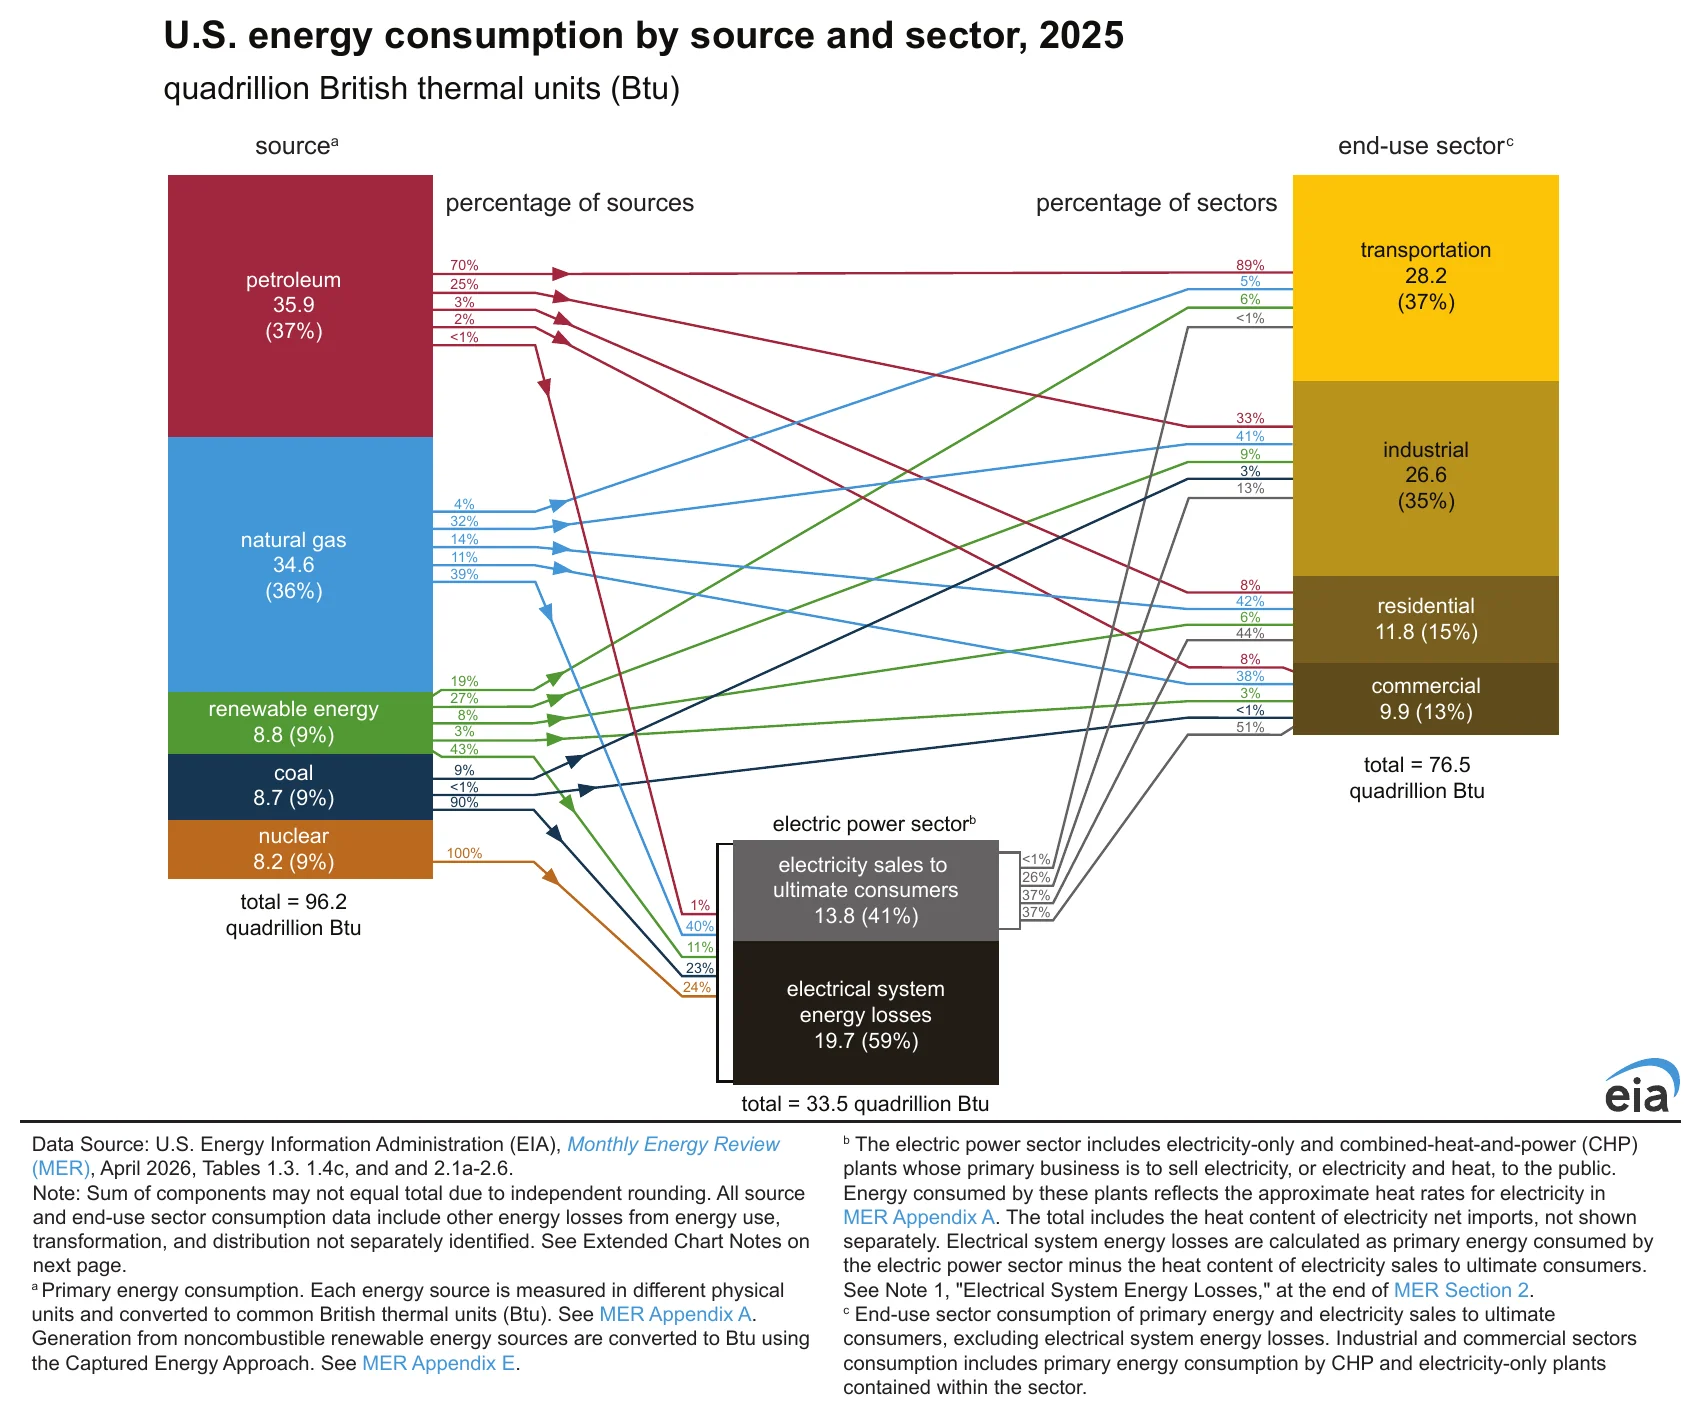
Which fuels does the U.S. use?
Fossil fuels supplied 82% of U.S. energy in 2025, and renewables were level with coal and nuclear.
- U.S. energy use rose 2% in 2025 but stayed below the record of 99 quads set in 2007 (EIA, Jun 2026).
- Fossil fuels supplied 82% of the energy used in 2025 (EIA, Jun 2026).
- Petroleum supplied 35.9 quads, 37% of the total (EIA, Apr 2026).
- Natural gas supplied 34.6 quads, 36% of the total (EIA, Apr 2026).
- Renewable energy supplied 8.8 quads, coal 8.7 and nuclear 8.2, each 9% of the total (EIA, Apr 2026).
- Wind and solar together supplied more energy than hydropower in 2025 (EIA, Jun 2026).
Which sectors use the most?
Transportation and industry use almost three quarters of the energy delivered to end users.
- Transportation used 28.2 quads, 37% of end-use energy (EIA, Apr 2026).
- Industry used 26.6 quads, 35% of end-use energy (EIA, Apr 2026).
- Commercial buildings used 9.9 quads, 13% of end-use energy (EIA, Apr 2026).
- Petroleum supplied 89% of transportation energy (EIA, Apr 2026).
- Electricity supplied 44% of residential energy and 51% of commercial energy (EIA, Apr 2026).
- Natural gas supplied 41% of industrial energy (EIA, Apr 2026).
Is U.S. energy use still growing?
Total use is close to flat, but the mix is shifting toward electricity and coal use rose last year.
- EIA expects energy use to stay flat or edge down through 2050 in most cases, even as the economy grows 1.2% to 2.2% a year (EIA, Apr 2026).
- U.S. coal consumption rose 10% in 2025 after a 50% jump in U.S. gas prices (Energy Institute, Jun 2026).
- U.S. oil production reached 21.1 million barrels a day, close to Saudi Arabia and Russia combined (Energy Institute, Jun 2026).
- U.S. liquefied natural gas exports rose 27% in 2025 (Energy Institute, Jun 2026).
How Much Energy Does a Typical Home Use?
Where a home sits and what kind of home it is matter more than who lives in it. A detached house in a cold state can use several times what an apartment in a mild state does.
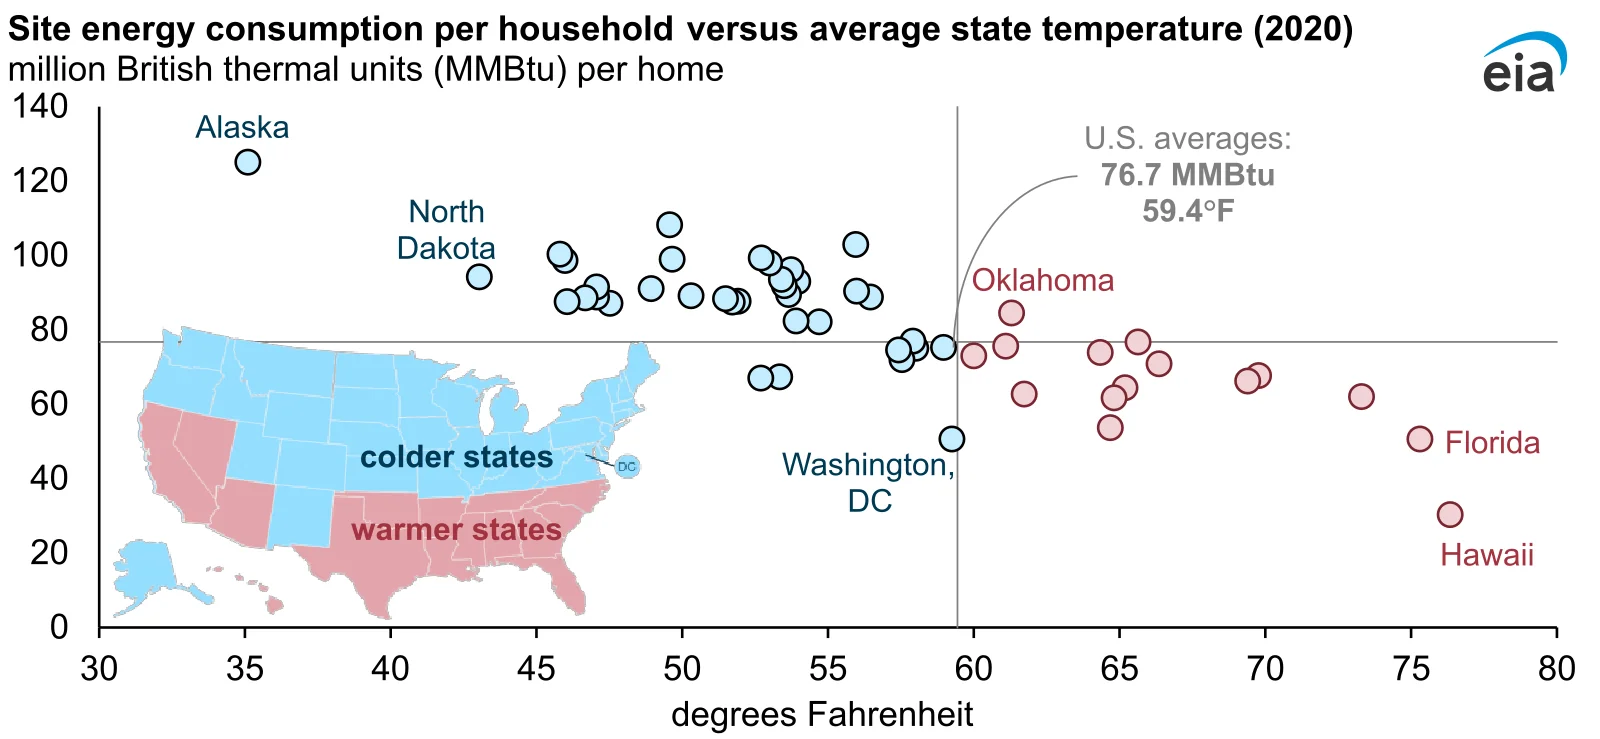
How much energy do U.S. homes use in total?
The latest full survey of home energy use is for 2020, and it is the base for most home figures below.
- The 2020 survey counted 123.53 million U.S. homes (EIA, Mar 2024).
- Those homes spent $232.76 billion on energy (EIA, Mar 2024).
- Homes used 42.2 thousand Btu per square foot (EIA, Mar 2024).
- Electricity made up 47% of household energy use and natural gas 45% (EIA, Mar 2023).
- Three quarters of U.S. homes use two or more energy sources (EIA, Dec 2023).
- Electricity supplied 94% of household energy in Florida and 29% in Illinois (EIA, Mar 2023).
How do home type and region change energy use?
Home type and region each move the total by a factor of two or three.
- A detached single-family home used 94.6 million Btu in 2020 (EIA, Mar 2024).
- A home in a building with five or more apartments used 33.7 million Btu (EIA, Mar 2024).
- Midwest households used 96.9 million Btu, against 57.4 million Btu for Pacific households (EIA, Mar 2024).
- Rural households used 85.4 million Btu, against 74.8 million Btu for urban households (EIA, Mar 2024).
- Alaska households used 125.1 million Btu and Hawaii households 30.3 million Btu (EIA, Mar 2023).
- Homes built before 1950 used 51.3 thousand Btu per square foot, against 31.2 for homes built in 2016 or later (EIA, Mar 2023).
How much electricity does a home buy from the grid?
The average U.S. home buys about 10,800 kilowatt-hours (kWh) a year, with large swings by state.
- The average residential customer bought 10,791 kWh in 2022, about 899 kWh a month (EIA, Jan 2024).
- Louisiana customers bought 14,774 kWh and Hawaii customers 6,178 kWh (EIA, Jan 2024).
- Households used 10,566 kWh of electricity in 2020, against 10,720 kWh in 2015 (EIA, Mar 2023).
- Households in the South used 13,376 kWh, the most of any region (EIA, Mar 2023).
- Average monthly use per residential customer was 865 kWh in 2024 (EIA, May 2025).
A home’s load follows its size, age and climate. A free BTU calculator gives a first estimate for a single room or house.
How Much Electricity Does the World Use?
Electricity is the fast lane of energy use. It grows faster than energy overall, and the gap is widening.
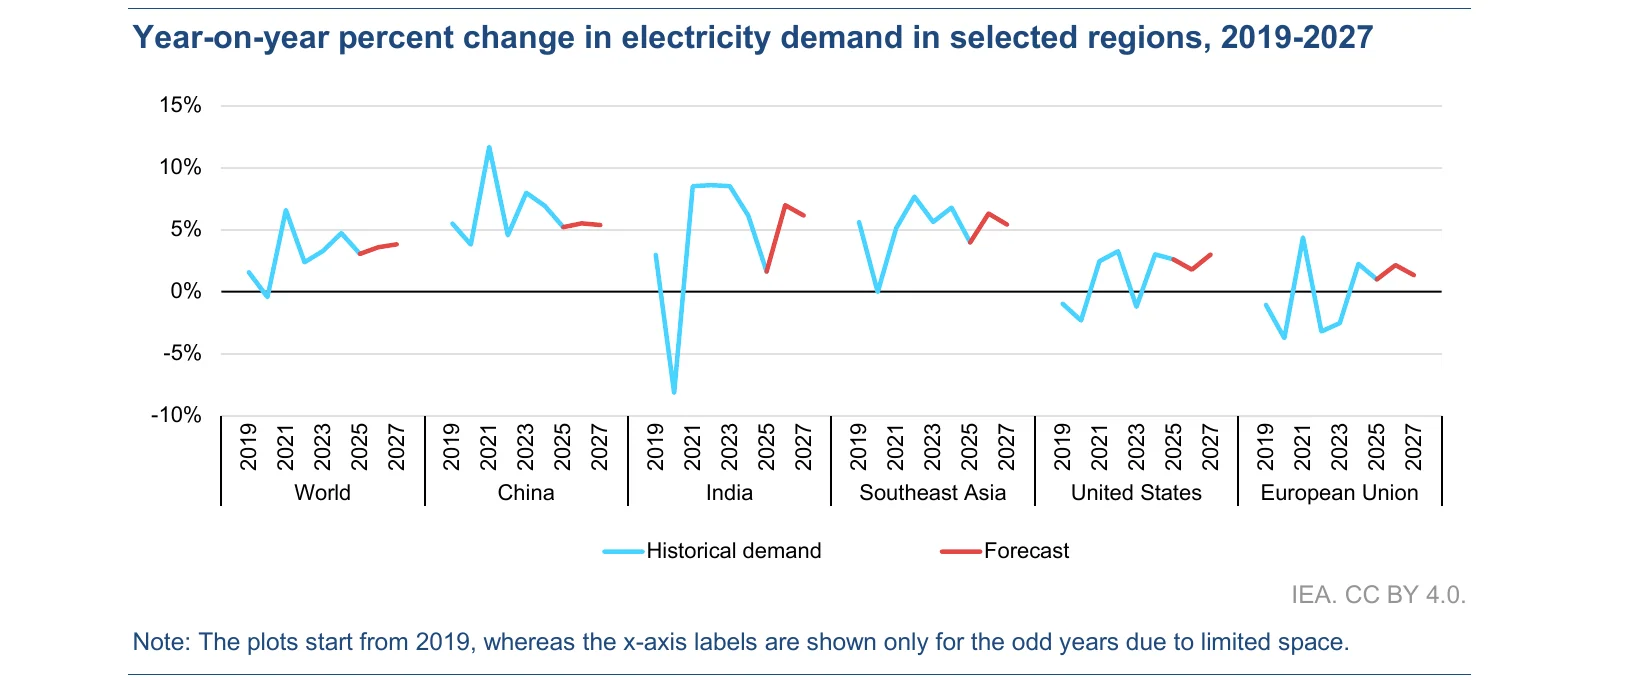
How big is global electricity demand?
The world used about 28,600 terawatt-hours (TWh) of electricity in 2025.
- Global electricity consumption was 28,600 TWh in 2025 and is forecast to reach 30,700 TWh in 2027 (IEA, Jul 2026).
- Demand grew 4.4% in 2024, when heat waves lifted use, before easing in 2025 (IEA, Apr 2026).
- The average yearly growth rate from 2014 to 2024 was 2.8% (IEA, Apr 2026).
- Ember counts a rise in demand of 849 TWh in 2025 (Ember, Apr 2026).
- The Energy Institute counts electricity demand growth of 3.0%, against 1.7% for energy as a whole (Energy Institute, Jun 2026).
- Electric vehicle demand rose 38% and data center demand 17%, though both are small shares of the total (IEA, Apr 2026).
Which countries drive electricity demand?
Emerging economies supply most of the growth, and China alone supplies more than half.
- Emerging and developing economies supplied 80% of the growth in 2025 (IEA, Apr 2026).
- China supplied 58% of the global rise in electricity demand (IEA, Apr 2026).
- China’s net electricity demand passed 9,500 TWh on the IEA’s count, up 5.1% (IEA, Apr 2026).
- India’s demand grew 1.6% in 2025 and is forecast to grow 7% in 2026 (IEA, Jul 2026).
- Southeast Asia’s demand grew about 3%, down from 8.6% in 2024 (IEA, Apr 2026).
- Advanced economies grew 1.6% in 2025 (IEA, Apr 2026).
What supplied the extra electricity?
Clean sources grew fast enough to meet all of the new demand in 2025.
- Low-carbon generation rose 887 TWh, more than the 849 TWh rise in demand (Ember, Apr 2026).
- Solar met 75% of the net rise in demand (Ember, Apr 2026).
- Renewables supplied 33.8% of world generation, ahead of coal at 33.0% (Ember, Apr 2026).
- Solar PV output rose about 600 TWh to nearly 2,700 TWh on the IEA’s count (IEA, Apr 2026).
- Fossil fuels still supplied more than half of world generation (IEA, Apr 2026).
How Much Electricity Does the United States Use?
After nearly two decades of flat demand, U.S. electricity use is climbing again. Data centers and factories drive much of it, and weather decides the rest.
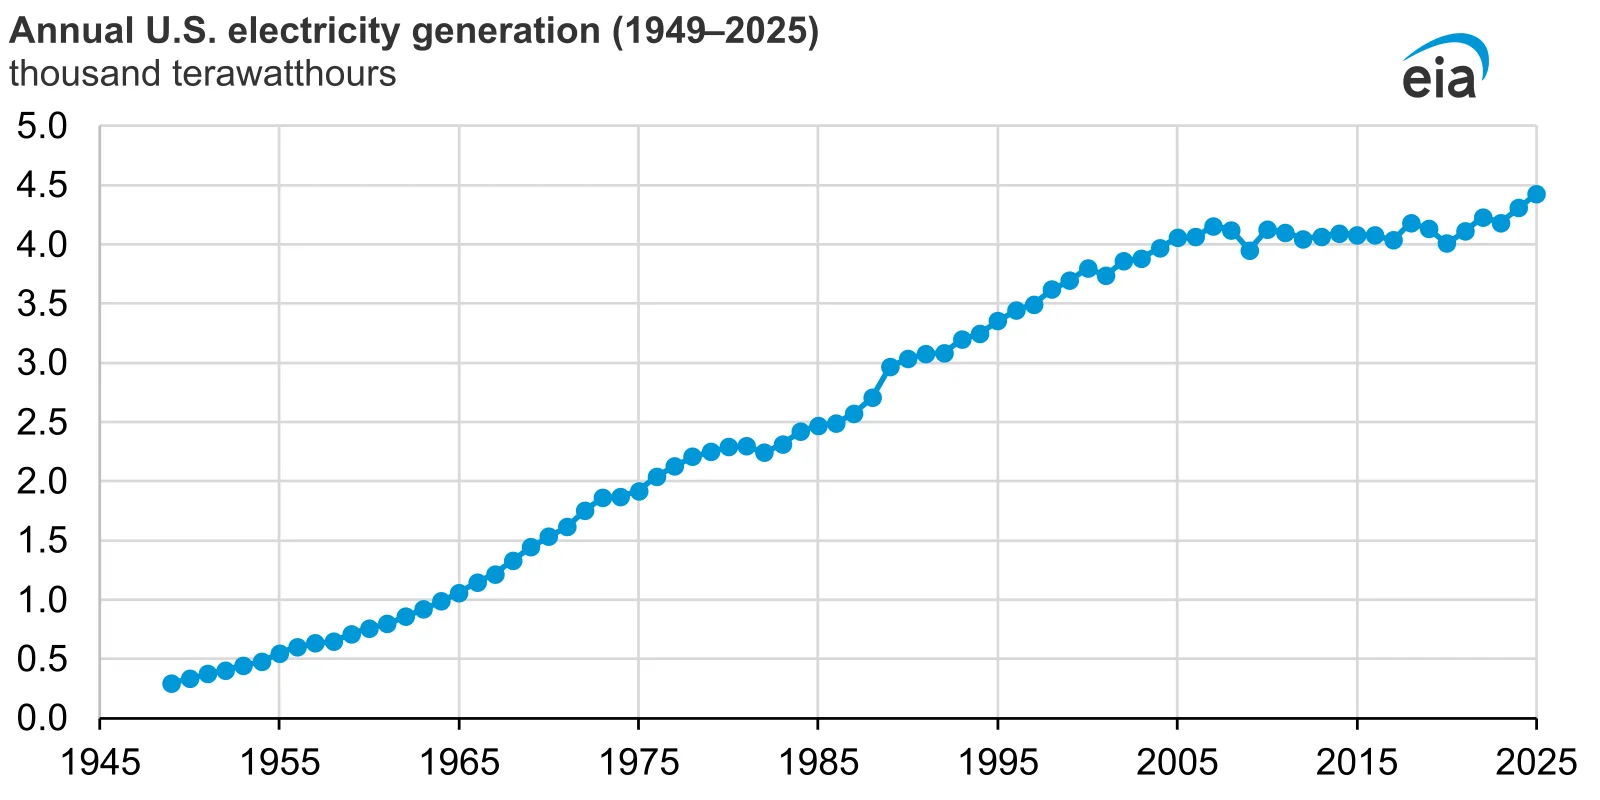
How much electricity does the U.S. use?
The U.S. used just over 4 trillion kWh in 2025. Two agencies count it slightly differently.
- Electricity use in 2025 was 14 times the 1950 level (EIA, Apr 2026).
- FERC puts 2025 consumption at 4,227 TWh, up 2.3% from 4,130 TWh in 2024 (FERC, Mar 2026).
- U.S. net generation reached 4.43 thousand TWh in 2025, up 2.8% (EIA, Mar 2026).
- Retail sales rose 2.2% for homes, 2.9% for commercial customers and 0.7% for industry (EIA, Mar 2026).
- Direct use at industrial and commercial sites was 3.3% of end-use electricity (EIA, Apr 2026).
- Nine of the 12 years of falling use since 1950 came after 2007 (EIA, Apr 2026).
Which customers buy the most?
Homes, commercial buildings and industry each buy a similar share.
- Residential customers bought 1,515 TWh in 2025 (EIA, Sep 2026).
- Commercial customers bought 1,493 TWh (EIA, Sep 2026).
- Industrial customers bought 1,042 TWh (EIA, Sep 2026).
- Manufacturers made up 71% of industrial electricity purchases (EIA, Apr 2026).
Is U.S. demand still rising in 2026?
Yes. A hot summer pushed use higher, and EIA expects commercial and industrial demand to keep growing in 2027.
- Electricity use in the third quarter of 2026 was 4% above the same quarter a year earlier (EIA, Oct 2026).
- Residential use rose 6% and commercial use 5% in that quarter (EIA, Oct 2026).
- EIA forecasts commercial demand to grow 2.8% in 2027 and industrial demand 2.7% (EIA, Oct 2026).
- U.S. electricity demand grew 2% in 2025, and buildings made up 80% of the growth (IEA, Apr 2026).
- ERCOT’s consumption grew 24% over five years, the fastest of any major U.S. grid operator (FERC, Mar 2026).
How Much Electricity Do Data Centers Use?
Data centers are the first large new load in a generation, and they are packed into a few grids. They are a small share of the world total, but a big share of the new demand in the United States.
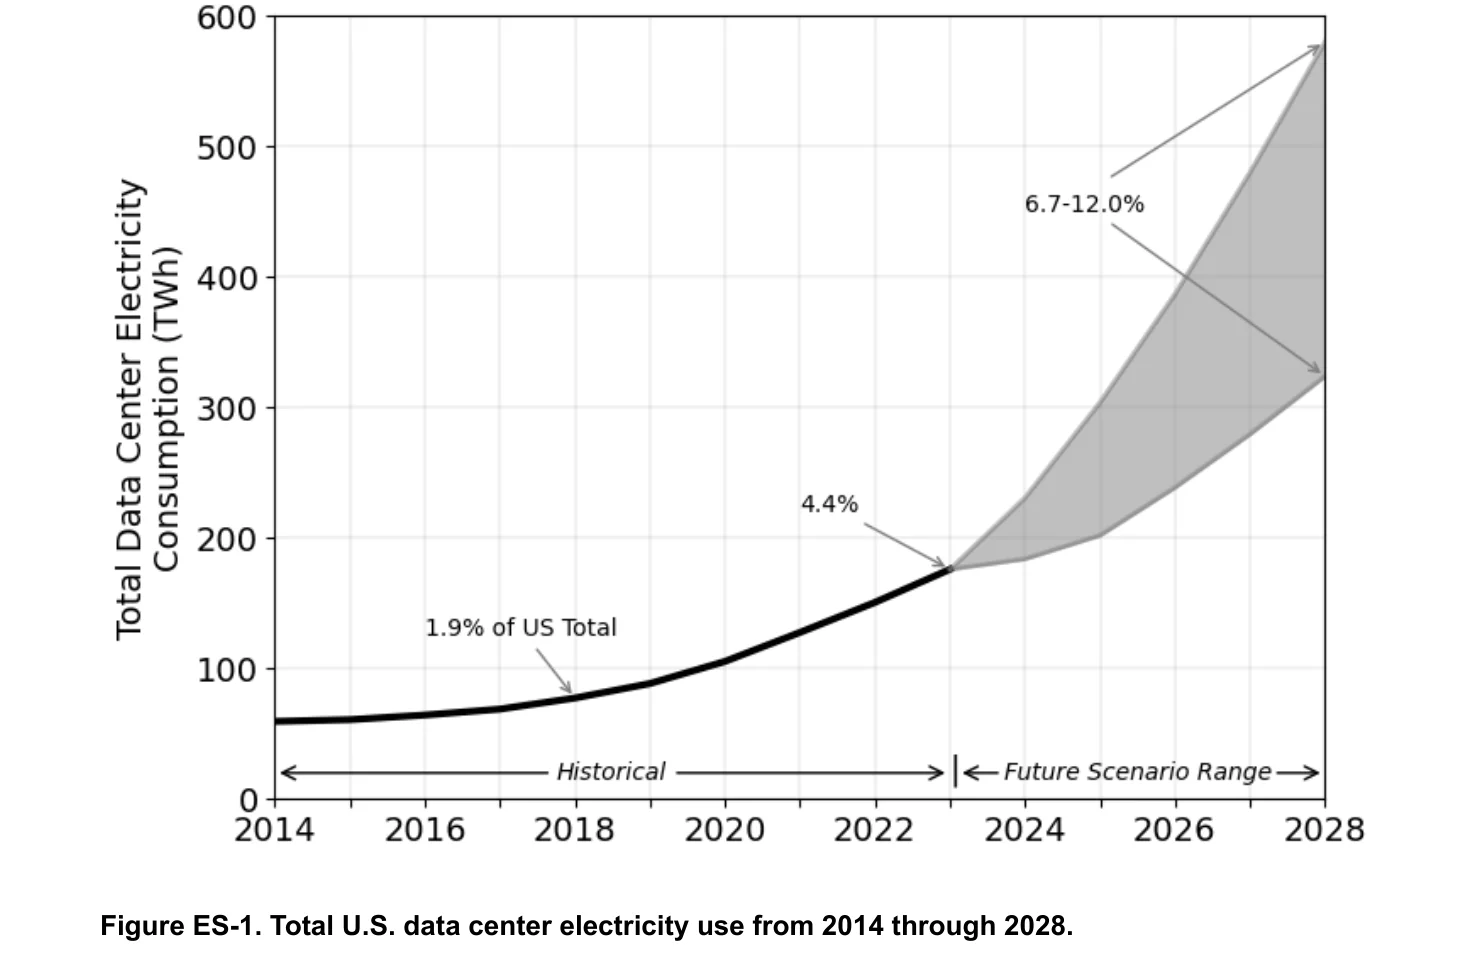
How much do U.S. data centers use?
Use has more than doubled since 2018 and could double or triple again by 2028.
- Data centers used 76 TWh in 2018, 1.9% of U.S. electricity (Lawrence Berkeley National Laboratory, Dec 2024).
- Use rose from 58 TWh in 2014 to 176 TWh in 2023 (U.S. DOE, Dec 2024).
- The 2028 range is 325 to 580 TWh (U.S. DOE, Dec 2024).
- More than 50 GW of data center capacity was in service at the end of 2025, growing 24% a year since 2020 (FERC, Mar 2026).
- Data centers made up about half of U.S. electricity demand growth in 2025 (IEA, Apr 2026).
How do data centers shape grid plans?
Grid planners now build data centers into their ten-year forecasts, and some are cutting back inflated requests.
- MISO expects 18 GW of data center load by 2035 (NERC, Jan 2026).
- Planned data centers average 10% of demand in WECC regions, and up to 40% in some areas (NERC, Jan 2026).
- Texas cut its data center demand projections by almost 50% after seeing how early sites actually behave (NERC, Jan 2026).
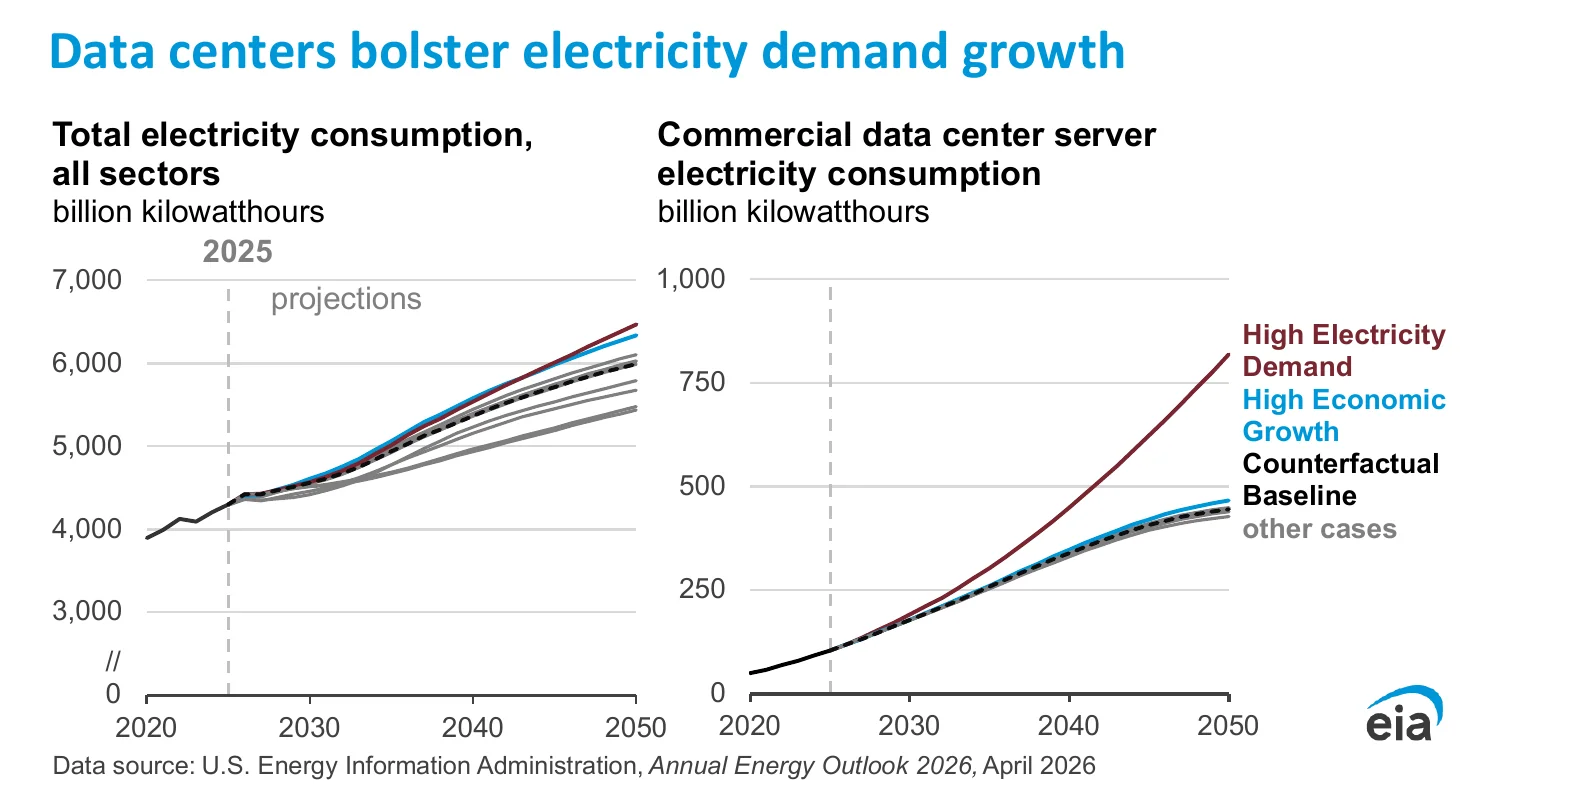
- EIA expects data center servers alone to use between 446 and 818 billion kWh by 2050 (EIA, May 2026).
How big are data centers worldwide?
Globally they are still about 1.5% of electricity use, with growth many times faster than the rest of the grid.
- Data centers used about 415 TWh in 2024, 1.5% of world electricity (IEA, Apr 2025).
- Use has grown 12% a year over the last five years (IEA, Apr 2025).
- The IEA’s base case reaches 945 TWh by 2030, just under 3% of world electricity (IEA, Apr 2025).
- That growth is about 15% a year, more than four times faster than all other sectors (IEA, Apr 2025).
- U.S. data center use is about 540 kWh per person, the highest of any region (IEA, Apr 2025).
- The U.S. adds about 240 TWh by 2030 and China about 175 TWh (IEA, Apr 2025).
- Investment in data centers is expected to reach USD 580 billion in 2025, above the USD 540 billion spent on oil supply (IEA, Nov 2025).
- More than 85% of new data center capacity over ten years is expected in the U.S., China and the EU (IEA, Nov 2025).
How Much Energy Do Europe, the UK, China and India Use?
Europe is using less energy than it did a generation ago, while China and India are still adding demand. The picture changes fast once you look past the big two.
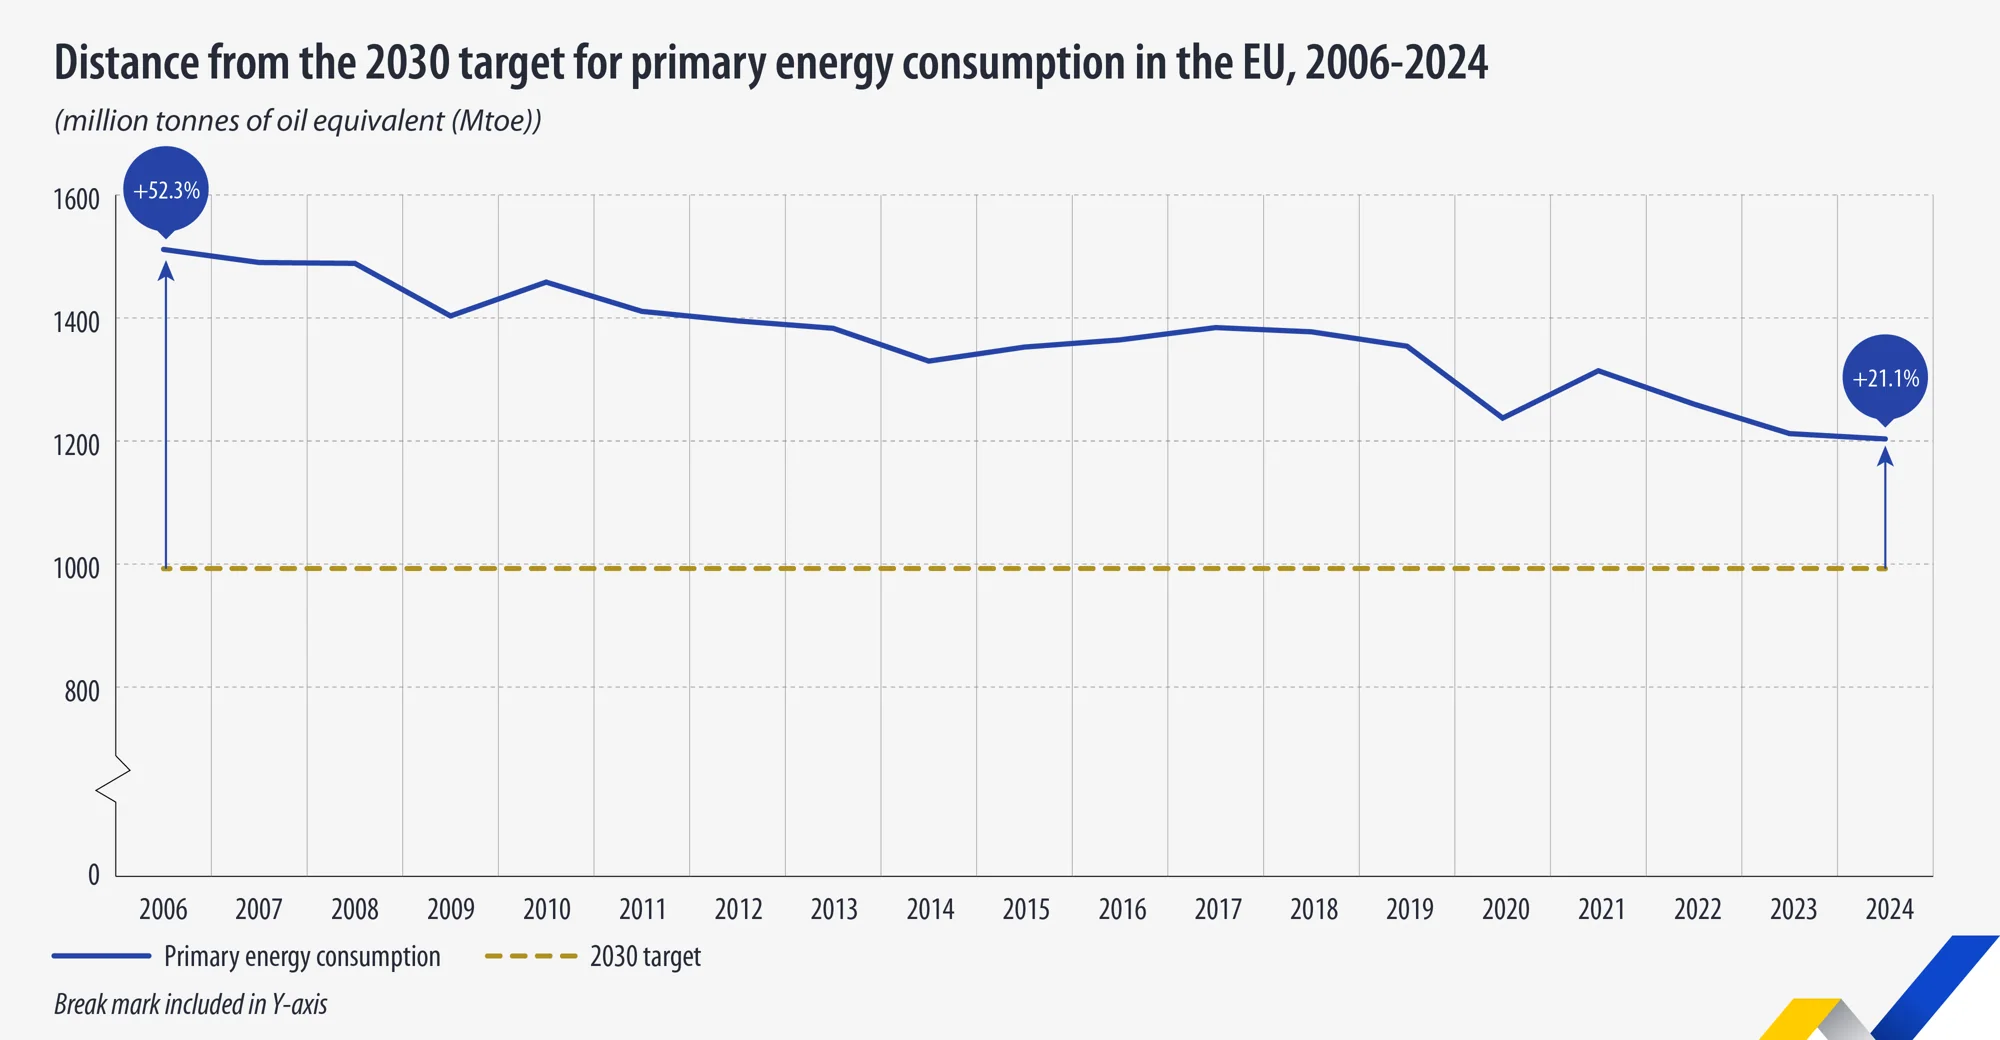
How much energy does the EU use?
The EU used 1,202 million tonnes of oil equivalent (Mtoe) of primary energy in 2024, its lowest level on record.
- EU primary energy use fell 0.8% in 2024 and was the lowest since 1990 (Eurostat, Dec 2025).
- It peaked at 1,511 Mtoe in 2006 (Eurostat, Dec 2025).
- Final energy use was 900 Mtoe in 2024, up 0.7% and 18.0% above the 2030 target (Eurostat, Dec 2025).
- Oil made up 37.8% of EU gross available energy and natural gas 20.6% (Eurostat, Sep 2026).
- The EU’s import dependency was 57.3% in 2024 (Eurostat, Sep 2026).
How much do EU households use?
EU homes used 9.54 million terajoules in 2024, and demand has fallen three years in a row.
- Household energy use fell 0.2% in 2024 from 9.57 million terajoules in 2023 (Eurostat, Jun 2026).
- It peaked at 10.98 million terajoules in 2021 (Eurostat, Jun 2026).
- Natural gas supplied 29.4% of household energy, electricity 26.9% and renewables 22.8% (Eurostat, Jun 2026).
- Dutch households got 61.0% of their energy from gas, and Maltese households got 78.8% from electricity (Eurostat, Jun 2026).
And what about the UK, China and India?
The UK is using less, China has passed 10 trillion kWh of electricity, and India’s total energy supply grew nearly 3% in its latest year.
- UK final energy use fell 0.3% in 2025 to 127.7 Mtoe (DESNZ, Sep 2026).
- UK household energy use rose 0.2% to 34.0 Mtoe (DESNZ, Sep 2026).
- UK household gas use fell 32% since 2000, from 31.8 Mtoe to 21.5 Mtoe (DESNZ, Sep 2026).
- China’s electricity use is more than twice the U.S. level and above the EU, Russia, India and Japan combined (National Energy Administration, Jan 2026).
- India’s total primary energy supply grew 2.95% in 2024-25 to 932,816 kilotonnes of oil equivalent (MoSPI, Mar 2026).
- India’s electricity use reached 1,460 kWh per person in 2024-25, up from 957 kWh in 2013-14 (PIB, Mar 2026).
How Much Energy Is Lost, and Is Efficiency Improving?
Losses before the meter are larger than most people expect. Efficiency gains are real, but they are not keeping pace with the target the world set for itself.
How much energy is lost making electricity?
Making and moving electricity wastes more energy than any end user consumes.
- U.S. electrical system losses were 19.7 quads in 2025, 59% of the energy used by the electric power sector (EIA, Apr 2026).
- Electricity sales to final users were 13.8 quads, 41% of that sector’s energy (EIA, Apr 2026).
Is energy efficiency improving fast enough?
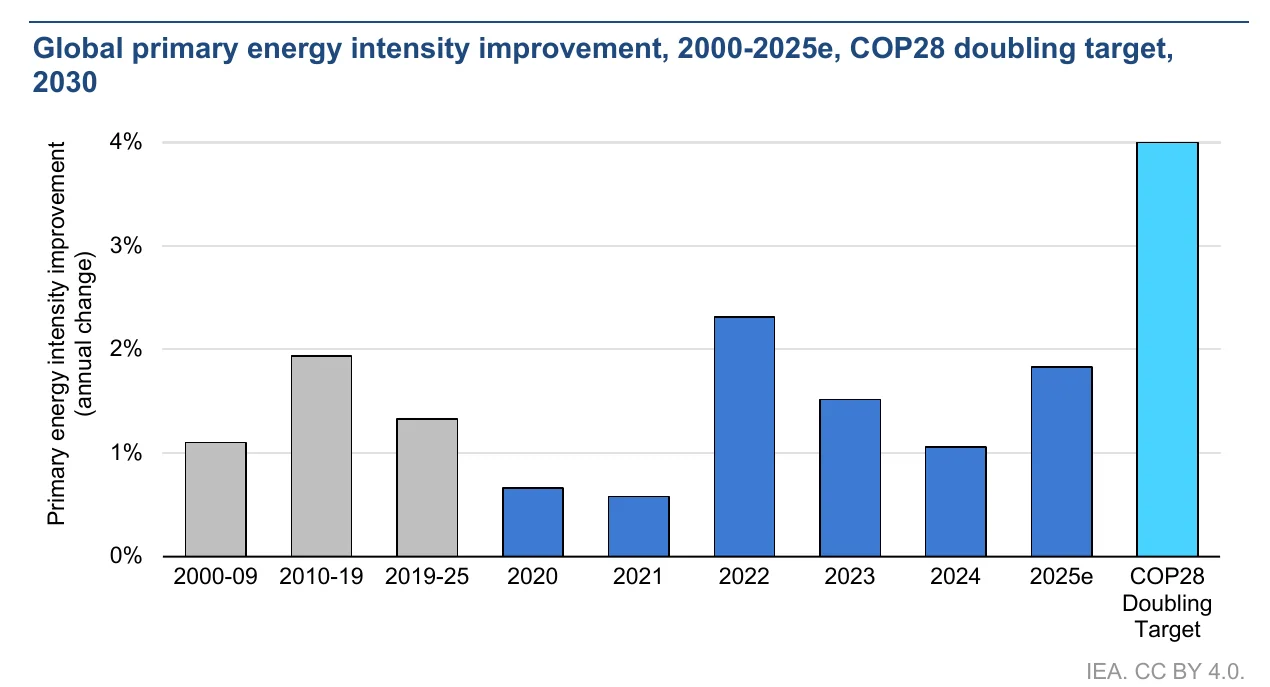
No. Progress improved in 2025, but it is under half the pace needed to meet the 2030 goal.
- Global energy intensity improved 1.8% in 2025, up from about 1% in 2024 (IEA, Nov 2025).
- The yearly average since 2019 is 1.3%, against about 2% from 2010 to 2019 (IEA, Nov 2025).
- The COP28 target is a 4% improvement a year by 2030 (IEA, Nov 2025).
- Intensity improved over 3% in China and over 4% in India in 2025, and under 1% in the U.S. and EU (IEA, Nov 2025).
- The IEA’s final 2025 estimate is nearly 2%, in line with the 2010 to 2019 average (IEA, Apr 2026).
Where does the efficiency gap sit?
Industry and appliance rules hold progress back more than technology does.
- Industry accounts for about two thirds of final energy demand growth since 2019 (IEA, Nov 2025).
- Industrial intensity gains fell below 0.5% a year, against almost 2% in the last decade (IEA, Nov 2025).
- Many appliances sold today are about half as efficient as the best models (IEA, Nov 2025).
- The best light bulbs doubled in efficiency in 15 years, while minimum standards rose only 30% (IEA, Nov 2025).
- Clean energy installed since 2019 avoided more than 35 EJ of fossil fuel demand in 2025, about 7% of fossil use (IEA, Apr 2026).
What Do Households Pay for Energy?
Price matters as much as use. Two homes with the same bill can use very different amounts of energy, and a cheap-power state can use twice the electricity of an expensive one.
What do U.S. households spend on energy?
Home energy bills run to a couple of thousand dollars a year, and the dollar cost can be the same in very different climates.
- The average U.S. household spent $1,884 on energy in 2020 (EIA, Mar 2024).
- North Dakota households spent $1,648 and Florida households $1,654, though the North Dakota home used nearly twice the energy (EIA, May 2023).
- Utilities, fuels and public services took $4,736 per household (consumer unit) in 2024, up 2.4% (BLS, Dec 2025).
- Housing made up 33.4% of household spending in 2024 (BLS, Dec 2025).
What does electricity cost per kWh?
Power got more expensive again in 2025, and the gap between states is very large.
- The average residential price was 17.30 cents per kWh in 2025, up from 16.48 in 2024 (EIA, Sep 2026).
- The average commercial price was 13.41 cents per kWh and the industrial price 8.62 (EIA, Sep 2026).
- Hawaii homes paid 48.00 cents per kWh in July 2026, against 12.72 cents in Louisiana (EIA, Sep 2026).
How big are monthly electric bills?
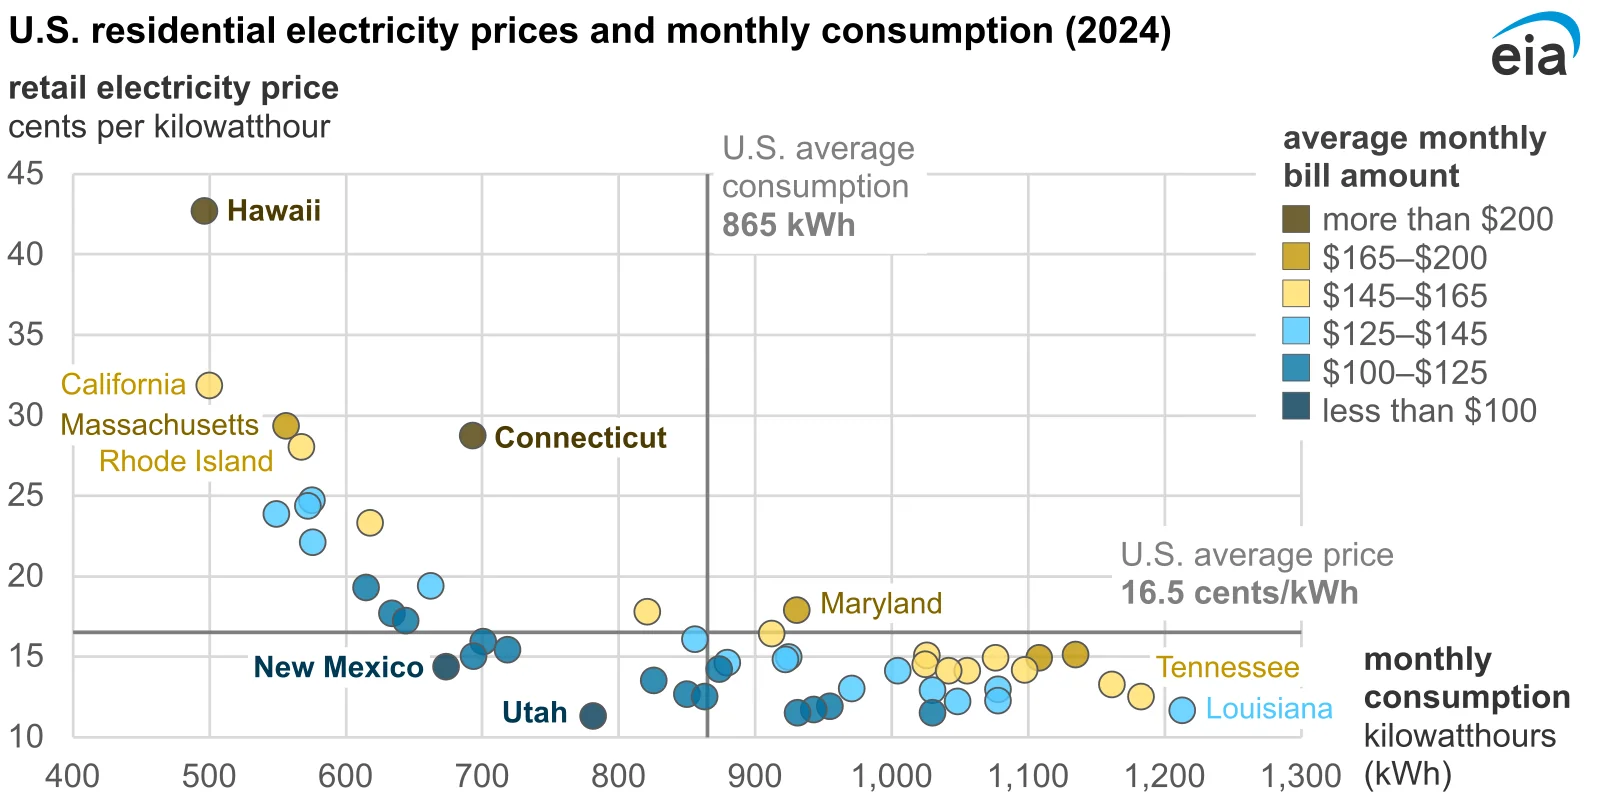
The typical monthly bill was $144 in 2024, but state averages ran from under $100 to over $200.
- The average monthly residential bill was $144 in 2024 (EIA, May 2025).
- Hawaii customers paid $213 a month and Utah customers $89 (EIA, May 2025).
- Louisiana customers paid $142 a month, near the national average, despite using more than twice the grid power of Hawaii or California (EIA, May 2025).
When you size equipment for a home, the load of the building matters more than the bill.
How Much Will Energy and Electricity Demand Grow by 2030 and 2050?
Forecasters agree that electricity demand will grow faster than it has in decades, but they disagree on by how much. The range is wide because it depends on data centers, electrification and weather.
What does the IEA expect for world electricity?
The IEA expects the fastest demand growth in years, with buildings leading the increase.
- World electricity demand grows 3.6% a year from 2026 to 2030, against 2.8% over the past decade (IEA, Feb 2026).
- The world adds about 1,100 TWh a year, against 700 TWh a year from 2015 to 2025 (IEA, Feb 2026).
- Electricity demand grows at least 2.5 times as fast as overall energy demand through 2030 (IEA, Feb 2026).
- Buildings supply 49% of the extra demand between 2025 and 2030 (IEA, Feb 2026).
- China alone adds demand equal to the EU’s current electricity use (IEA, Feb 2026).
- The EU grows 2.3% a year but does not return to its 2021 level before 2028 (IEA, Feb 2026).
- U.S. electricity use adds more than 420 TWh over five years, with data centers about half of it (IEA, Feb 2026).
- Space cooling, data centers and heat pumps make up almost half of the growth in building electricity use worldwide (IEA, Feb 2026). A heat pump sizing calculator helps check the load of an electrified home.
- Electricity rises about 40% by 2035 in both the IEA’s Current Policies and Stated Policies scenarios (IEA, Nov 2025).
- Grids are the weak point: generation spending has risen almost 70% since 2015 to USD 1 trillion a year, while grid spending stands at USD 400 billion (IEA, Nov 2025).
- More than 2,500 GW of projects wait in grid connection queues worldwide (IEA, Feb 2026).
What does EIA expect for the United States?
EIA expects growth well below the recent pace, but with a wide band between cases.
- U.S. demand rose 2.1% a year over the last five years (EIA, Apr 2026).
- EIA projects 0.9% to 1.6% a year through 2050 across its cases (EIA, Apr 2026).
- Installed generating capacity rises 50% to 90% by 2050 (EIA, Apr 2026).
- The highest data center case has servers using more than 16 times the 2020 level in 2050 (EIA, Apr 2026).
- Commercial computing grows from 8% of commercial electricity in 2024 to 20% in 2050 (EIA, Jun 2025).
How much peak demand do grid planners expect?
Peak demand is rising faster than at any point since the 1990s.
- NERC expects winter peak demand to grow by more than 245 GW over ten years (NERC, Jan 2026).
- The new ten-year summer peak growth forecast is 69% above last year’s projection of 132 GW (NERC, Jan 2026).
Methodology and Sources
Each figure comes from the agency, regulator or research body that produced it, and each link goes to the report, table or release itself. No statistics roundup or third-party blog is used as a source. Where two agencies report the same quantity differently, such as world energy demand growth or U.S. electricity use, both are shown with their names. The latest national totals for homes come from the 2020 Residential Energy Consumption Survey, because the 2024 survey had not published energy use tables when this page was last updated. Figures are checked each month against new releases, and the date shown is the release or data date of the cited source.
Glossary
- Btu: British thermal unit, a small unit of heat energy. A quad is one quadrillion Btu.
- EJ: exajoule, a unit of energy equal to about 0.95 quads.
- GJ: gigajoule, used for per-person energy use.
- kWh, TWh: kilowatt-hour and terawatt-hour (one billion kWh), units of electricity.
- GW: gigawatt, a unit of power used for grid capacity and peak demand.
- Mtoe: million tonnes of oil equivalent, used by Eurostat and the UK.
- Primary energy: energy in fuels and sources before conversion, such as coal burned at a power plant.
- Site energy: energy used at the home, as shown on the meter.
- Energy intensity: energy used per unit of economic output.
- RECS: the EIA Residential Energy Consumption Survey.
- STEO, AEO: EIA’s Short-Term Energy Outlook and Annual Energy Outlook.
- NERC, FERC: the North American Electric Reliability Corporation and the Federal Energy Regulatory Commission.
Sources
- BLS, Consumer Expenditures, 2024 news release, Dec 2025
- BLS, Consumer expenditures in 2024, Dec 2025
- DESNZ, Energy Consumption in the UK (ECUK) 2026, Sep 2026
- EIA, 2020 RECS Table CE1.1, Mar 2024
- EIA, 2020 RECS consumption and expenditures release, Mar 2023
- EIA, Annual Energy Outlook 2026 Narrative, Apr 2026
- EIA, Annual Energy Outlook 2026 release, Apr 2026
- EIA, Data center server energy use grows across the commercial building stock, May 2026
- EIA, Electric Power Monthly, Table 5.1, Sep 2026
- EIA, Electric Power Monthly, Table 5.3, Sep 2026
- EIA, Electric Power Monthly, Table 5.6.a, Sep 2026
- EIA, Electricity use for commercial computing could surpass space cooling, ventilation, Jun 2025
- EIA, How much electricity does an American home use?, Jan 2024
- EIA, Monthly Energy Review, U.S. energy consumption by source and sector, 2025, Apr 2026
- EIA, Residential electric bills in Hawaii and Connecticut are twice those in New Mexico, Utah, May 2025
- EIA, Short-Term Energy Outlook, October 2026, Oct 2026
- EIA, The 250-year history of U.S. energy consumption, Jun 2026
- EIA, U.S. electricity generation in 2025 hit a record, again, Mar 2026
- EIA, U.S. households in warmer states consume less site energy than households in colder states, May 2023
- EIA, Use of electricity, Apr 2026
- EIA, Use of energy in homes, Dec 2023
- Ember, Global Electricity Review 2026, Apr 2026
- Energy Institute, Statistical Review of World Energy 2025, Jun 2025
- Energy Institute, Statistical Review of World Energy 2026 (summary), Jun 2026
- Eurostat, EU primary energy consumption decreased by 1% in 2024, Dec 2025
- Eurostat, Energy consumption in households, Jun 2026
- Eurostat, Energy statistics, an overview, Sep 2026
- Eurostat, Energy use in EU households drops for 3 years in a row, Jun 2026
- FERC, 2025 State of the Markets, Mar 2026
- IEA, Electricity 2026, Demand, Feb 2026
- IEA, Electricity 2026, Executive summary, Feb 2026
- IEA, Electricity Mid-Year Update 2026, Jul 2026
- IEA, Energy Efficiency 2025, Executive summary, Nov 2025
- IEA, Energy and AI, Energy demand from AI, Apr 2025
- IEA, Global Energy Review 2026, Electricity demand, Apr 2026
- IEA, Global Energy Review 2026, Global trends, Apr 2026
- IEA, Global Energy Review 2026, Key findings, Apr 2026
- IEA, World Energy Outlook 2025, Executive summary, Nov 2025
- Lawrence Berkeley National Laboratory, 2024 United States Data Center Energy Usage Report, Dec 2024
- MoSPI, Energy Statistics India 2026 press release, Mar 2026
- NERC, 2025 Long-Term Reliability Assessment, Jan 2026
- National Energy Administration, China’s power consumption hits 10-trillion-kWh milestone in 2025, Jan 2026
- PIB, Press release on power sector reform and progress, Mar 2026
- U.S. DOE, DOE releases new report on data center electricity demand, Dec 2024