Residential HVAC replacement statistics describe a market that runs on breakdowns, deadlines and rules more than on choice. Most owners replace a system because it failed or because a contractor said it was near the end. This page collects the primary data on how old the equipment is, how many units ship, what a new system costs, and what the refrigerant and efficiency rules mean for the next install.
Every number comes from the agency, regulator, association or research body that published it, and every one carries its report date. Where a newer release exists, it replaces the older one. Where the newest release has no data yet, the page says so.
The page is for HVAC techs who size and install changeouts, and for owners who have to decide whether to repair or replace. Facts are grouped by the question each one answers.
Key Takeaways
- Central air conditioner and air-source heat pump shipments fell 20.0 percent in 2025, to 7,749,529 units from 9,681,770 in 2024 ((AHRI, Feb 2026)).
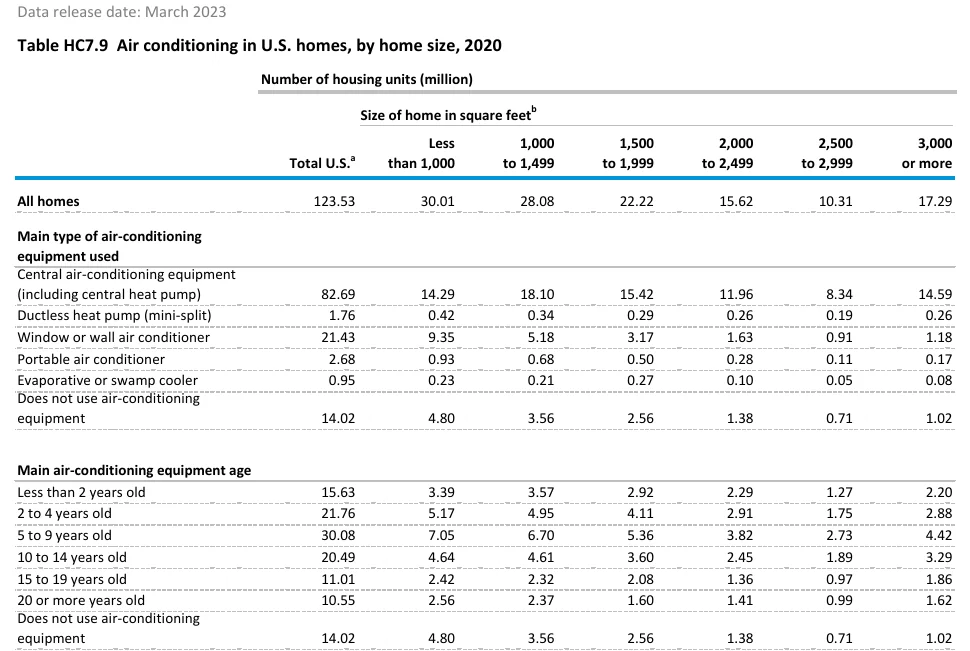
- 10.55 million US homes run a main air conditioner that is 20 or more years old ((EIA, Mar 2023)).
- 23.54 million homes have main heating equipment that is 20 or more years old ((EIA, Mar 2023)).
- DOE puts the average lifetime of a central air conditioner at 21.2 years and of a heat pump at 15.3 years ((DOE, Jan 2017)).
- EIA’s planning figure for a 3-ton central air conditioner that just meets the federal standard is $5,250 installed, in 2022 dollars ((EIA, Mar 2026)).
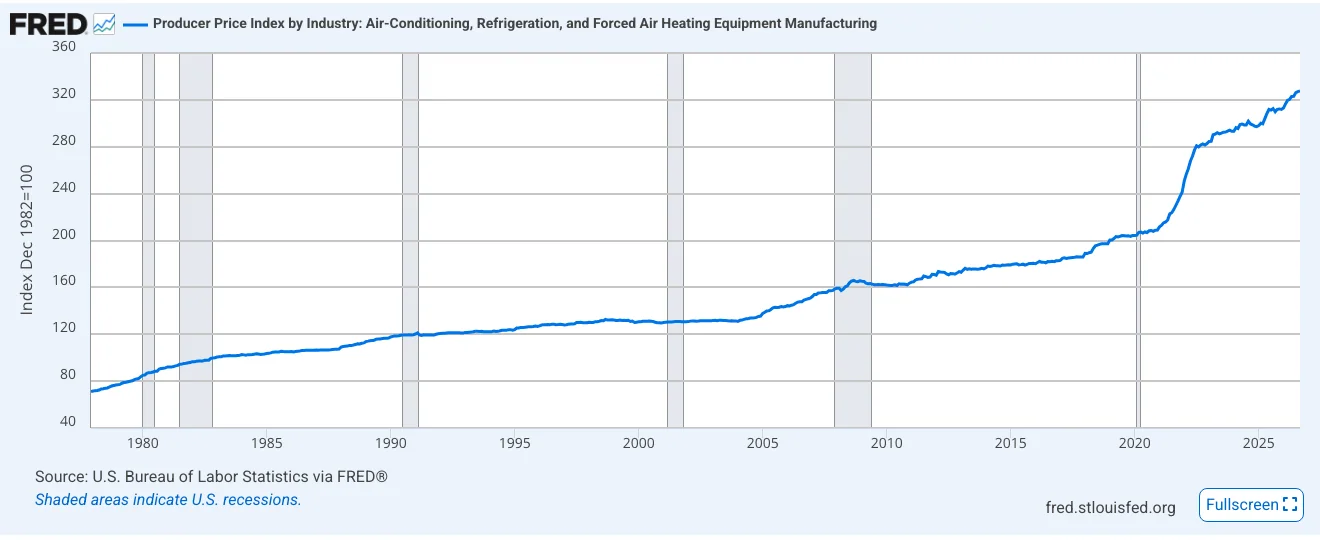
- Producer prices for air-conditioning, refrigeration and forced air heating equipment rose from an index of 204.2 in January 2020 to 327.608 in September 2026, a 60 percent increase ((BLS, Sep 2026)).
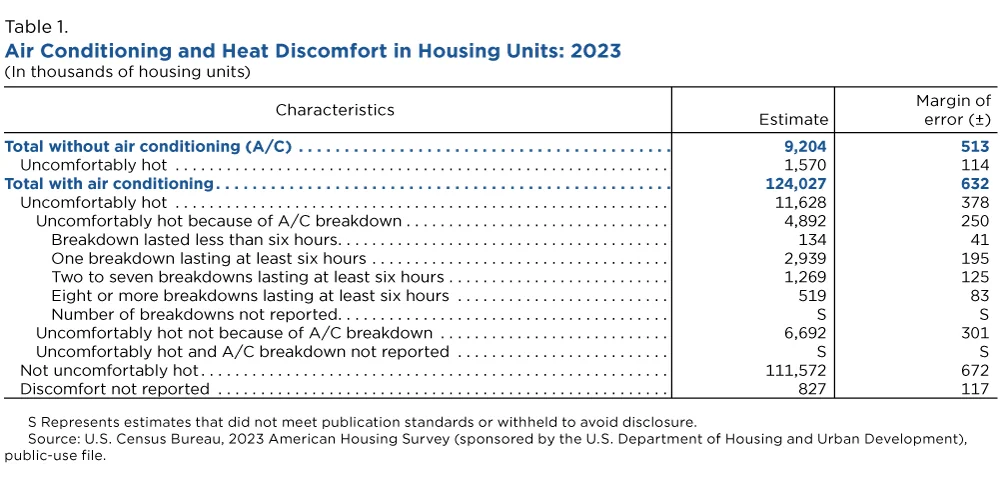
- 4.9 million homes with air conditioning were uncomfortably hot for 24 hours or more because the main cooling equipment broke down ((Census Bureau, Sep 2025)).
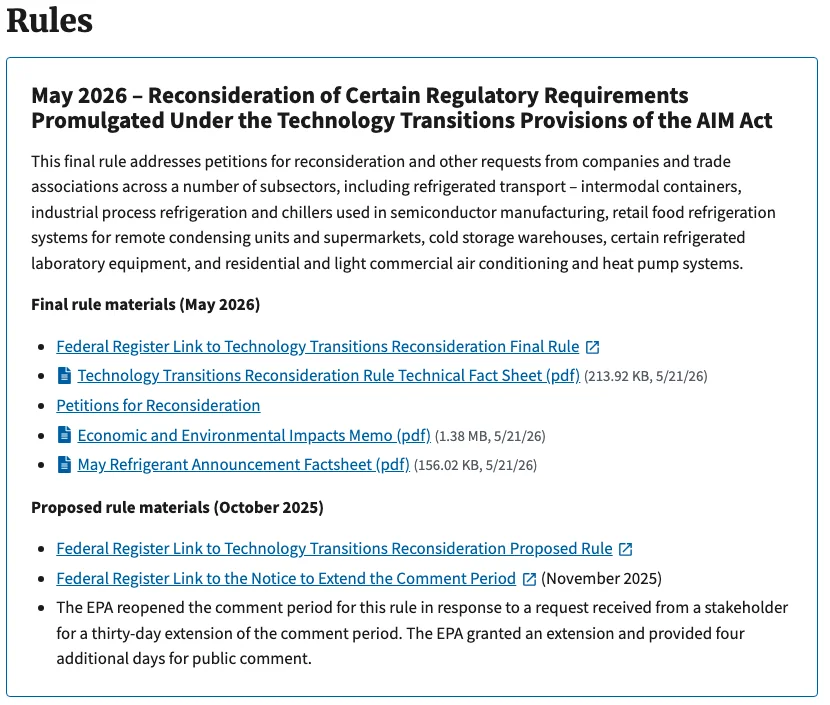
- EPA’s May 2026 rule lets residential air conditioning and heat pump equipment made before 2025 keep being installed, with the old installation deadline removed ((EPA, May 2026)).
- The AIM Act cuts US HFC production and consumption 85 percent from the baseline by 2036 ((EPA, Sep 2026)).
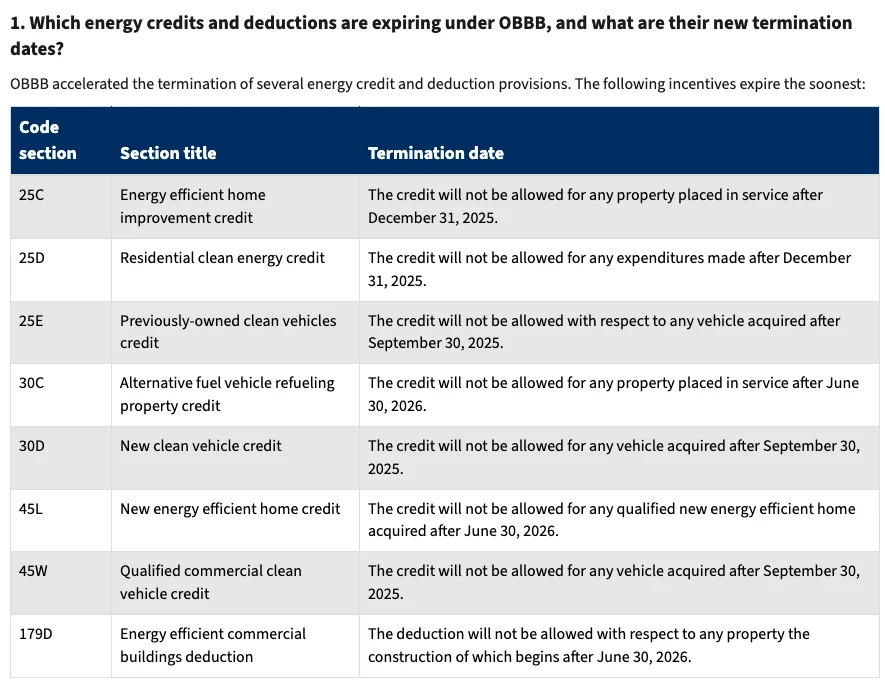
- The federal tax credit for heat pumps and central air conditioners ended for equipment placed in service after December 31, 2025 ((IRS, Aug 2025)).
- In a federal field study of 311 systems, 23 percent had a serious refrigerant charge fault, off by 20 percent or more ((DOE and University of Nebraska-Lincoln, Jun 2026)).
- In a California study of 52 residential changeouts, 38 percent had a mechanical permit on record ((DNV GL for PG&E, Oct 2014)).
- BLS projects 40,600 openings a year for heating, air conditioning and refrigeration mechanics and installers from 2025 to 2035 ((BLS, Aug 2026)).
How Old Is the Cooling and Heating Equipment in US Homes?
Old equipment is the rule, not the exception. A large block of homes already runs systems past the age at which most techs start quoting a changeout, and the 2020 survey is still the latest national count of equipment age.
How many homes use air conditioning, and what kind?
Most homes cool with central equipment, but a large group depends on window units that follow different replacement rules.
- 109.51 million of 123.53 million occupied homes used air-conditioning equipment in 2020 ((EIA, Mar 2023)).
- 82.69 million homes used central air conditioning, including central heat pumps, as their main type ((EIA, Mar 2023)).
- 21.43 million homes used a window or wall air conditioner as their main type ((EIA, Mar 2023)).
- 1.76 million homes used a ductless heat pump (mini-split) as their main type ((EIA, Mar 2023)).
- 83 percent of homes built before 1950 used air conditioning, against 93 percent of homes built from 2010 to 2020 ((EIA, May 2022)).
- 9.2 million occupied homes, 6.9 percent, had no air conditioning in 2023 ((Census Bureau, Sep 2025)).
How old is the main air conditioner?
About six in ten main air conditioners are under ten years old, and about one in five is fifteen or older, by the counts below plus the 20-year group above.
- 15.63 million homes had a main air conditioner under 2 years old ((EIA, Mar 2023)).
- 21.76 million homes had one that was 2 to 4 years old ((EIA, Mar 2023)).
- 30.08 million homes had one that was 5 to 9 years old, the largest age group ((EIA, Mar 2023)).
- 20.49 million homes had one that was 10 to 14 years old ((EIA, Mar 2023)).
- 11.01 million homes had one that was 15 to 19 years old ((EIA, Mar 2023)).
How old is the main heating equipment?
Heating equipment skews older than cooling equipment, and a long-lived group sits at the top of the age range.
- 13.29 million homes had main heating equipment under 2 years old ((EIA, Mar 2023)).
- 17.19 million homes had heating equipment 2 to 4 years old ((EIA, Mar 2023)).
- 26.77 million homes had heating equipment 5 to 9 years old ((EIA, Mar 2023)).
- 22.29 million homes had heating equipment 10 to 14 years old ((EIA, Mar 2023)).
- 14.66 million homes had heating equipment 15 to 19 years old ((EIA, Mar 2023)).
- 16.13 million homes used a heat pump as their main heating equipment ((EIA, Mar 2023)).
How old is the housing stock, and when does newer equipment data arrive?
The buildings are old too, which matters for ducts, panels and sizing at changeout.
- The median age of US homes was 44 years in 2023 ((Harvard JCHS, Mar 2025)).
- The 2024 RECS covers 132.5 million occupied homes ((EIA, Sep 2026)).
- EIA will publish the 2024 space heating and air conditioning tables in spring 2027 ((EIA, Sep 2026)).
How Many Systems Ship Each Year and How Long Do They Last?
Shipments swing with rules and pre-buying, so one year is a poor guide. Regulators also assume lifetimes well past the age at which breakdowns start to rise.
How many central air conditioners and heat pumps ship each year?
Shipments fell hard in 2025 and are recovering in 2026.
- Central air conditioner shipments were 4,104,933 units in 2025, down 26.2 percent from 5,559,766 in 2024 ((AHRI, Feb 2026)).
- Air-source heat pump shipments were 3,644,596 units in 2025, down 11.6 percent from 4,122,004 in 2024 ((AHRI, Feb 2026)).
- Combined shipments were 8,656,674 units in 2023 ((AHRI, Feb 2026)).
- December 2025 shipments were 408,244 units, down 21.4 percent on December 2024 ((AHRI, Feb 2026)).
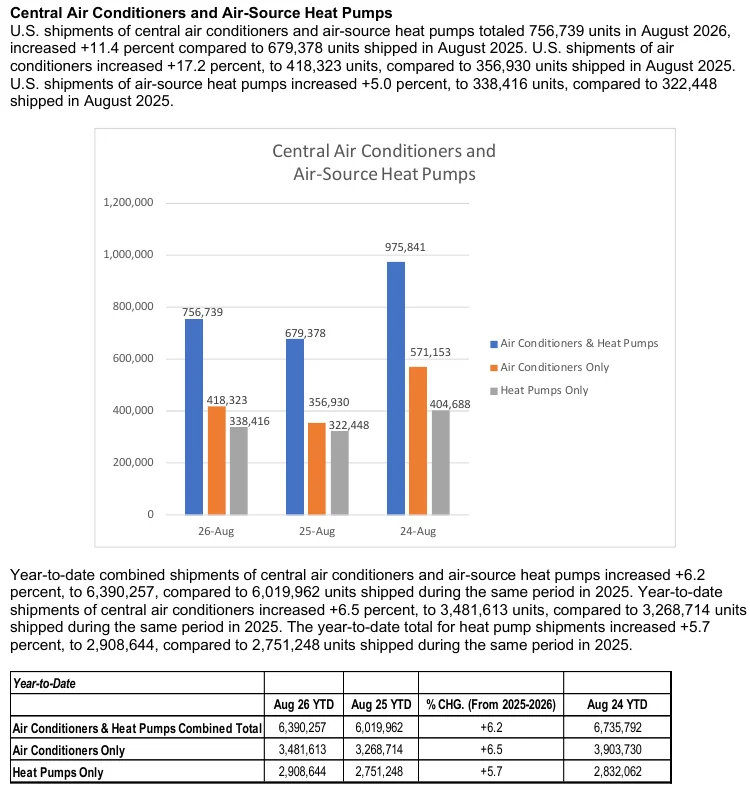
- Combined shipments through August 2026 were 6,390,257 units, up 6.2 percent on the same months of 2025 ((AHRI, Oct 2026)).
- Central air conditioner shipments through August 2026 were 3,481,613 units, up 6.5 percent ((AHRI, Oct 2026)).
- Air-source heat pump shipments through August 2026 were 2,908,644 units, up 5.7 percent ((AHRI, Oct 2026)).
- August 2026 shipments were 756,739 units, up 11.4 percent on August 2025 ((AHRI, Oct 2026)).
- August 2024 shipments were 975,841 units, which puts August 2026 about 22 percent lower ((AHRI, Oct 2026)).
- Annual central air conditioner shipments peaked at 6.5 million units in 2005 ((EIA, Mar 2023)).
How long does a system last?
DOE models central air conditioners to outlast heat pumps, and both vary by climate region.
- DOE’s average central air conditioner lifetime is 24.1 years in the North region ((DOE, Jan 2017)).
- It is 18.0 years in the hot-humid region ((DOE, Jan 2017)).
- It is 24.9 years in the hot-dry region ((DOE, Jan 2017)).
- DOE’s average heat pump lifetime runs from 15.1 years in the hot-humid region to 16.4 years in the North ((DOE, Jan 2017)).
How much do owners spend on replacing core systems?
Replacements that cannot wait are now about half of what owners spend on their homes.
- Replacements that affect safety and function, such as roofing, windows and HVAC, were 49 percent of owner improvement spending in 2023, or $197 billion ((Harvard JCHS, Mar 2025)).
- Systems and equipment replacements were 18.5 percent of the $405 billion owners spent on improvements in 2023 ((Harvard JCHS, Mar 2025)).
- Owners aged 65 and over spent 54 percent of improvement dollars on replacements, against 47 percent for owners under 65 ((Harvard JCHS, Mar 2025)).
- Per-owner improvement spending on homes built before 1980 was 24 percent higher than on homes built since 2010 ((Harvard JCHS, Mar 2025)).
What Does a New System Cost Installed?
Price is the number owners remember, and it has moved by more than the efficiency rules alone explain. Compare installed cost, not equipment cost, and note the year of the dollars.
What does EIA assume for installed prices?
Heat pumps cost more than air conditioners at every efficiency level in EIA’s tables, and the gap widens at the high end.
- A high-efficiency 3-ton central air conditioner is $5,980 installed, in 2022 dollars ((EIA, Mar 2026)).
- An air-source heat pump that meets the minimum is $6,730 installed ((EIA, Mar 2026)).
- A high-efficiency air-source heat pump is $8,620 installed ((EIA, Mar 2026)).
- A room air conditioner that meets the minimum is $560 installed ((EIA, Mar 2026)).
- A high-efficiency room air conditioner is $675 installed ((EIA, Mar 2026)).
- EIA’s model assumes rebates equal to 11 percent of installed cost for central air conditioners in the West South Central division and 1 percent in the East South Central division ((EIA, Mar 2026)).
- It assumes rebates for air-source heat pumps of 19 percent of installed cost in the West South Central division and 0 percent in the East South Central division ((EIA, Mar 2026)).
How have equipment prices moved?
The index kept to a slow climb until 2020, then stepped up.
- The index rose from 211.6 in January 2021 to 284.564 in January 2023 ((BLS, Sep 2026)).
- It stood at 298.002 in January 2025 and 313.036 in January 2026 ((BLS, Sep 2026)).
What do upkeep and payback look like?
Upkeep is small next to the install, and payback depends on climate.
- EIA’s typical annual maintenance cost for a central air conditioner or heat pump is $20 to $150, in 2022 dollars ((EIA, Mar 2023)).
- For split-system air conditioners in the North region, DOE found average life-cycle savings of $43 and a payback of 10.5 years under the 2023 standard, in 2015 dollars ((DOE, Jan 2017)).
- For split-system air conditioners in the hot-dry region, DOE found savings of $150 and a payback of 7.6 years ((DOE, Jan 2017)).
- For split-system heat pumps, DOE found savings of $131 and a payback of 4.9 years ((DOE, Jan 2017)).
When Does Repairing Stop Making Sense?
Breakdowns, not birthdays, trigger most replacements, and the refrigerant rules let owners keep fixing old equipment. The real question is how often it fails and what a repair buys.
How often do air conditioners break down?
Breakdowns are the biggest single reason an air-conditioned home gets uncomfortably hot.
- 11.6 million of 124 million homes with air conditioning, 9.4 percent, were uncomfortably hot for 24 hours or more in the prior 12 months ((Census Bureau, Sep 2025)).
- 2.9 million homes had one breakdown of at least six hours ((Census Bureau, Sep 2025)).
- 1.3 million homes had two to seven breakdowns of at least six hours each ((Census Bureau, Sep 2025)).
- 519 thousand homes had eight or more breakdowns of at least six hours each ((Census Bureau, Sep 2025)).
- 2.6 million households named inadequate cooling capacity as a reason they were uncomfortably hot, the most reported reason after breakdowns ((Census Bureau, Sep 2025)).
- 1.3 million households named power outages ((Census Bureau, Sep 2025)).
- 0.7 million households named the cost of cooling ((Census Bureau, Sep 2025)).
Can I keep repairing an old system?
Yes. Federal refrigerant rules do not force a changeout, and a repair can be a lawful, defensible choice.
- The 2023 EPA rule does not limit the use of any existing product or system ((EPA, Sep 2026)).
- Owners can keep repairing an existing system, including replacing a major component such as a condensing unit or compressor ((EPA, Sep 2026)).
- EPA left in place the treatment of new condensing units sold as replacements in existing split systems ((EPA, May 2026)).
- DOE assumed a compressor repair extends a unit’s life by about half of its original lifetime ((DOE, Jan 2017)).
- ENERGY STAR says systems over 10 to 12 years old are more prone to breakdowns and performance problems ((ENERGY STAR, Jul 2024)).
What does a heat pump change about the choice?
When the old system is an air conditioner plus a furnace, a heat pump swaps two replacements for one.
- An ENERGY STAR certified air-source heat pump can heat for about one third the cost of traditional electric heating, depending on location ((ENERGY STAR, Jul 2024)).
- It can heat for about one half the cost of oil heat ((ENERGY STAR, Jul 2024)).
- It can deliver up to three times more heat energy to a home than the electrical energy it uses ((ENERGY STAR, Jul 2024)).
How Does the Refrigerant Change Affect a New Install?
The rules changed twice in three years, and the latest change helps installers who hold older stock. Equipment made after 2025 starts must use lower-warming refrigerants, while earlier stock may still go in.
What does the HFC phasedown schedule say?
The AIM Act steps HFC production and consumption down in stages, with the last step in 2036.
- The AIM Act became law on December 27, 2020 ((EPA, Sep 2026)).
- Allowed HFC production and consumption is 90 percent of the baseline for 2020 to 2023 ((EPA, Sep 2026)).
- It is 60 percent of the baseline for 2024 to 2028 ((EPA, Sep 2026)).
- It is 30 percent of the baseline for 2029 to 2033 ((EPA, Sep 2026)).
- It is 20 percent of the baseline for 2034 to 2035 ((EPA, Sep 2026)).
- EPA estimates the allocation program’s cumulative net benefits at $269.9 billion from 2022 through 2050, in 2020 dollars ((EPA, Sep 2026)).
What do the equipment rules require?
New residential systems must use refrigerants below a set warming limit, and the install deadline has been relaxed twice.
- EPA published the Technology Transitions rule on October 24, 2023, and it applied to over 40 subsectors ((EPA, May 2026)).
- The residential air conditioning and heat pump limit is a global warming potential of 700 ((EPA, May 2026)).
- The original deadline for installing lower-GWP residential systems was January 1, 2025 ((EPA, Dec 2023)).
- A December 2023 interim rule let pre-2025 inventory be installed until January 1, 2026 ((EPA, Dec 2023)).
- The May 2026 final rule takes effect on July 27, 2026 ((EPA, May 2026)).
- Installing new R-410A systems made or imported after January 1, 2025 remains prohibited ((EPA, May 2026)).
- EPA found contractors had trouble getting R-454B in service cylinders in some regions during the 2025 rollout ((EPA, May 2026)).
- EPA estimates the May 2026 rule saves $576 million in present value across all the subsectors it covers, at a 7 percent discount rate in 2024 dollars ((EPA, May 2026)).
- In April 2021 EPA listed R-32, R-452B, R-454A, R-454B, R-454C and R-457A as acceptable, with use conditions, for new residential and light commercial air conditioning and heat pumps ((EPA, Apr 2021)).
What about older refrigerants like R-22?
R-22 is a separate, older phaseout under ozone rules, not the AIM Act.
- US HCFC use had to fall to at least 90 percent below baseline by 2015 ((EPA, Apr 2026)).
- It had to fall to at least 99.5 percent below baseline by 2020 ((EPA, Apr 2026)).
- The HCFC phaseout is complete in 2030 ((EPA, Apr 2026)).
Which Efficiency Rules Apply to a New System?
Since 2023 the test changed and the floor rose, so a like-for-like swap is no longer like for like. Read SEER2 and SEER as different scales.
What did the 2023 federal standards change?
DOE raised the floor for equipment made from January 1, 2023, and changed how efficiency is measured.
- The amended standards apply to central air conditioners and heat pumps made or imported from January 1, 2023 ((DOE, Jan 2017)).
- For split-system air conditioners under 45,000 Btu/h the national floor is 14 SEER, and 15 SEER in the Southeast and Southwest, on the older test scale ((DOE, Jan 2017)).
- For split-system heat pumps the floor is 15 SEER and 8.8 HSPF on the older test scale ((DOE, Jan 2017)).
- DOE expects 3.2 quads of lifetime energy savings for units bought from 2023 to 2052, 2.6 percent of what these products would otherwise use ((DOE, Jan 2017)).
- DOE puts the net present value of consumer benefits at $2.5 billion at a 7 percent discount rate and $12.2 billion at 3 percent ((DOE, Jan 2017)).
- DOE expects 188.3 million metric tons of avoided carbon dioxide emissions over the same period ((DOE, Jan 2017)).
- EIA notes that SEER2 values are generally lower than SEER values because the test uses a higher external static pressure ((EIA, Mar 2023)).
- EIA’s model has the minimum central air conditioner at SEER 13.0 in 2022, rising to 14.4 by 2040 ((EIA, Mar 2026)).
- DOE finalized a one-year delay of certain enforcement provisions of the controls verification procedure in its central air conditioner and heat pump test procedure in September 2025 ((DOE, Sep 2025)).
What does ENERGY STAR require now?
ENERGY STAR sits above the federal floor, and heat pumps have a separate cold climate tier. To check a heat pump against a home’s load rather than the old unit’s nameplate, use the heat pump sizing calculator.
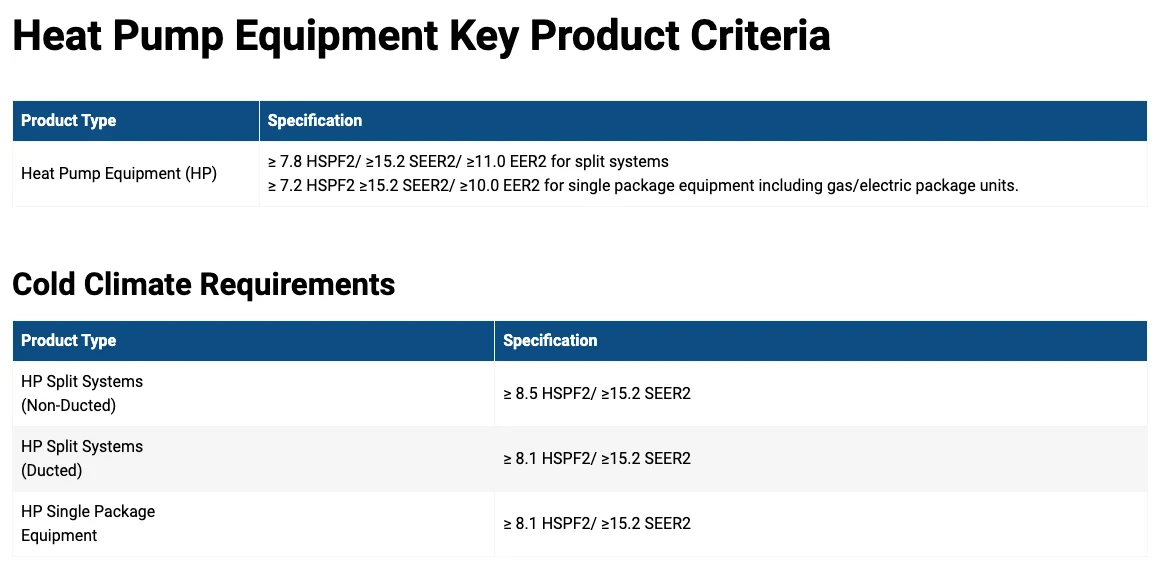
- Certified split-system central air conditioners need at least 15.2 SEER2 and 12.0 EER2 ((ENERGY STAR, Dec 2024)).
- Certified single-package central air conditioners need at least 15.2 SEER2 and 11.5 EER2 ((ENERGY STAR, Dec 2024)).
- Certified split-system heat pumps need at least 15.2 SEER2, 11.0 EER2 and 7.8 HSPF2 ((ENERGY STAR, Dec 2024)).
- Certified single-package heat pumps need at least 7.2 HSPF2 ((ENERGY STAR, Dec 2024)).
- Cold climate ducted split systems need at least 8.1 HSPF2, and non-ducted split systems need at least 8.5 ((ENERGY STAR, Dec 2024)).
- Cold climate heat pumps need a coefficient of performance of at least 1.75 at 5 degrees F ((ENERGY STAR, Dec 2024)).
- They also need at least 70 percent of their 47 degree F heating capacity at 5 degrees F ((ENERGY STAR, Dec 2024)).
What Help Exists to Pay for a New System?
The federal tax credit is gone, which leaves state-run rebates and utility programs to carry the cost. Owners who budgeted around the credit need new numbers.
What did the federal tax credit cover before it ended?
The credit was 30 percent with caps, and it reached millions of filers.
- The credit equaled 30 percent of qualifying costs, including some labor ((IRS, Jan 2025)).
- Heat pumps carried a $2,000 annual cap ((IRS, Jan 2025)).
- Central air conditioners were subject to a $600 cap per item ((IRS, Jan 2025)).
- The general annual limit was $1,200 per taxpayer ((IRS, Jan 2025)).
- A taxpayer with enough qualifying costs in both groups could claim up to $3,200 in one year ((IRS, Jan 2025)).
- More than 3.4 million tax filers claimed the clean energy and energy-efficient home improvement credits in 2023 ((Harvard JCHS, Mar 2025)).
- 17 percent of homeowners, nearly 15 million households, did a project in the prior two years explicitly to improve energy efficiency ((Harvard JCHS, Mar 2025)).
- Projects that affect home energy use were about $140 billion, or 34 percent, of owner improvement spending in 2023 ((Harvard JCHS, Mar 2025)).
What do state-run rebates offer?
DOE’s rebate programs are run by states, so availability depends on where the home is.
- A household can get up to $8,000 for an ENERGY STAR certified electric heat pump for space heating and cooling ((DOE, Sep 2024)).
- Electrification and appliance rebates total up to $14,000 per household ((DOE, Sep 2024)).
- Those rebates cover up to 100 percent of costs for lower-income families and up to 50 percent for moderate-income families ((DOE, Sep 2024)).
- Only households below 150 percent of area median income are potentially eligible, which was roughly $110,000 nationally in 2022 ((DOE, Sep 2024)).
- Whole-home efficiency rebates of up to $8,000 require a projected cut in energy use of at least 20 percent ((DOE, Sep 2024)).
Can households absorb a surprise bill?
A failed system usually arrives as an unplanned expense.
- 63 percent of adults would cover a hypothetical $400 emergency expense with cash or its equivalent ((Federal Reserve, May 2026)).
- 59 percent of adults had at least one major unexpected expense in the prior 12 months ((Federal Reserve, May 2026)).
- 22 percent of adults had a major house or appliance repair among their unexpected expenses ((Federal Reserve, May 2026)).
Is the New System Sized and Installed Right?
A new system can still underperform if it is the wrong size or is charged wrong. The field data say faults are common and that a permit does not guarantee a right-sized unit.
How common are installation faults?
In a recent federal field study, charge and airflow faults showed up across the sample.
- The average refrigerant charge was 6.5 percent low across the 311 systems ((DOE and University of Nebraska-Lincoln, Jun 2026)).
- Evaporator airflow was 16 percent low on average ((DOE and University of Nebraska-Lincoln, Jun 2026)).
- 1 percent of systems had a serious liquid line restriction, and 25 percent had a minor one ((DOE and University of Nebraska-Lincoln, Jun 2026)).
- Combined faults reduced efficiency by up to 39 percent in lab tests ((DOE and University of Nebraska-Lincoln, Jun 2026)).
- 21 percent of the systems in the sample were heat pumps and 79 percent were cooling only ((DOE and University of Nebraska-Lincoln, Jun 2026)).
How often are new systems oversized?
Oversizing was common with or without a permit, in a sample too small to project to the state.
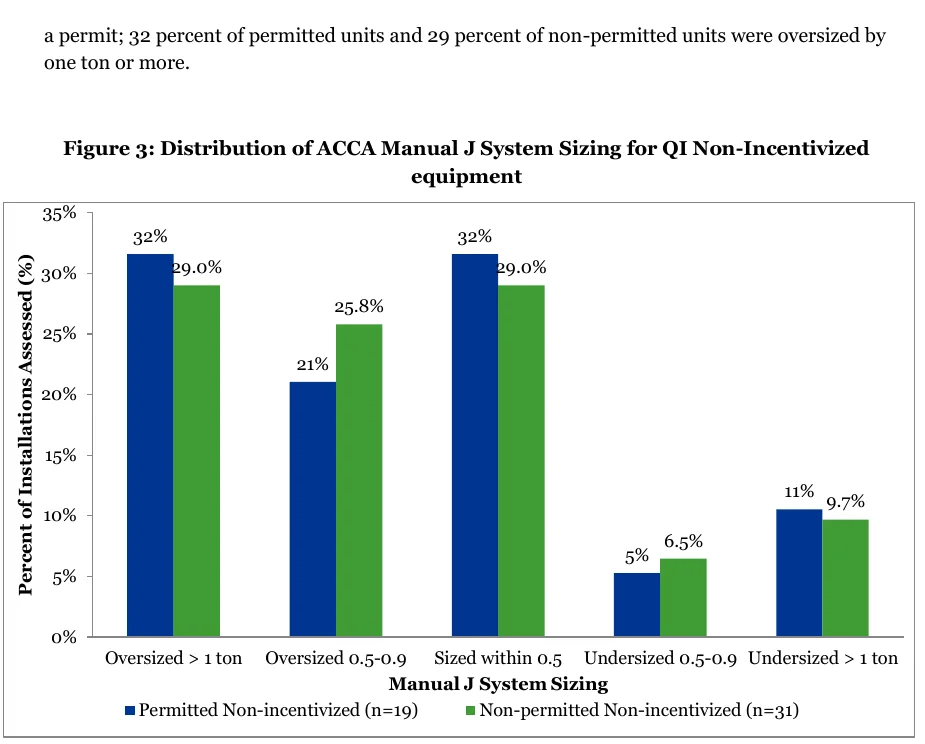
- 32 percent of permitted units and 29 percent of non-permitted units were oversized by one ton or more ((DNV GL for PG&E, Oct 2014)).
- 32 percent of permitted units and 29 percent of non-permitted units were sized within half a ton ((DNV GL for PG&E, Oct 2014)).
- 11 percent of permitted units and 9.7 percent of non-permitted units were undersized by more than a ton ((DNV GL for PG&E, Oct 2014)).
- Only 1 of 109 building departments required and kept HERS compliance documents ((DNV GL for PG&E, Oct 2014)).
- NREL’s simulations found that the energy penalty of an oversized air conditioner is not primarily the result of extra on-off cycling ((NREL, Nov 2014)).
The fix at the point of sale is a load calculation, not the old unit’s tonnage. The free AC tonnage calculator gives an estimate in the style of Manual J to check a quote against.
Is there enough labor to do the work?
The trade is growing, and most of its openings come from people leaving it.
- HVACR mechanics and installers held 440.9 thousand jobs in 2025 ((BLS, Aug 2026)).
- BLS projects 489.1 thousand jobs in 2035 ((BLS, Aug 2026)).
- That is growth of 10.9 percent from 2025 to 2035 ((BLS, Aug 2026)).
- The median annual wage was $61,010 in 2025 ((BLS, Aug 2026)).
- 6.3 percent of these workers were self-employed in 2025 ((BLS, Aug 2026)).
Methodology and Sources
Facts were chosen for what they say about replacing residential heating and cooling equipment: age, volume, cost, repair, refrigerant, efficiency rules, money and install quality. Each came from the body that produced the data, and each link points to the report, table or rule itself. Roundups and trade-press retellings were not used. Where a newer release exists, the older one was dropped. The 2024 RECS has no equipment-age tables yet, so the 2020 tables are the latest. Counts such as “six in ten” and “about 22 percent lower” are simple arithmetic on the cited figures. The PPI change of 60 percent is calculated from the two index values quoted. Studies with small samples, such as the 2014 California permit study, are marked as such. The page is refreshed monthly, and shipment data is updated when AHRI releases new months.
Manual J is a trademark of ACCA. The calculators linked here give estimates in the style of Manual J. They are not affiliated with or approved by ACCA.
Glossary
- AHRI: Air-Conditioning, Heating, and Refrigeration Institute, the trade group that reports equipment shipments.
- AIM Act: American Innovation and Manufacturing Act of 2020, the law that phases down HFCs.
- BLS: Bureau of Labor Statistics.
- COP: coefficient of performance, heat delivered per unit of electricity used.
- EER2: energy efficiency ratio under the 2023 test, a cooling efficiency at a fixed hot day.
- EIA: Energy Information Administration.
- GWP: global warming potential, how much a gas warms the air compared with carbon dioxide.
- HCFC: hydrochlorofluorocarbon, an older refrigerant family that includes R-22.
- HFC: hydrofluorocarbon, a refrigerant family that includes R-410A and R-32.
- HSPF2: heating seasonal performance factor under the 2023 test, a heat pump heating efficiency.
- JCHS: Joint Center for Housing Studies of Harvard University.
- PPI: Producer Price Index, a measure of prices makers receive.
- RECS: Residential Energy Consumption Survey, run by EIA.
- SEER2: seasonal energy efficiency ratio under the 2023 test, a cooling efficiency over a season.
Sources
- AHRI, August 2026 U.S. Heating and Cooling Equipment Shipment Data
- AHRI, December 2025 U.S. Heating and Cooling Equipment Shipment Data
- BLS, Occupational projections and worker characteristics, 2025 to 2035
- BLS, Producer Price Index by Industry: Air-Conditioning, Refrigeration, and Forced Air Heating Equipment Manufacturing (via FRED)
- DNV GL for Pacific Gas and Electric, HVAC Permitting: A Study to Inform IOU HVAC Programs
- DOE and University of Nebraska-Lincoln, A Field and Laboratory Study to Characterize Fault Prevalence in Residential Comfort Systems
- DOE, Consumer Central Air Conditioners and Heat Pumps
- DOE, Energy Conservation Standards for Residential Central Air Conditioners and Heat Pumps, Federal Register
- DOE, Home Energy Rebates FAQ Fact Sheet
- EIA, 2024 RECS housing characteristics data page
- EIA, 2024 RECS select household characteristics highlights
- EIA, Assumptions to the Annual Energy Outlook 2026: Residential Demand Module
- EIA, Table HC6.3 Space heating in U.S. homes, by year of construction, 2020
- EIA, Table HC7.9 Air conditioning in U.S. homes, by home size, 2020
- EIA, Today in Energy: Nearly 90% of U.S. households used air conditioning in 2020
- EIA, Updated Buildings Sector Appliance and Equipment Costs and Efficiencies
- ENERGY STAR, Consider a Heat Pump to Replace Your Central Air Conditioner
- ENERGY STAR, Version 6.2 Central Air Conditioner and Heat Pump Final Specification
- EPA, Final Rule 23 SNAP fact sheet
- EPA, Frequent Questions on the Phasedown of Hydrofluorocarbons
- EPA, Phasedown of Hydrofluorocarbons: Reconsideration of Certain Regulatory Requirements (Federal Register, May 26, 2026)
- EPA, Phaseout of Class II Ozone-Depleting Substances
- EPA, Regulatory Actions for Technology Transitions
- Federal Reserve, Economic Well-Being of U.S. Households in 2025
- Harvard JCHS, Improving America’s Housing 2025
- IRS, FS-2025-01 FAQs on the Energy Efficient Home Improvement Credit
- IRS, FS-2025-05 FAQs on the termination of energy credits
- NREL, Energy Impacts of Oversized Residential Air Conditioners
- U.S. Census Bureau, 13.2 Million Households Were Uncomfortably Hot for 24 Hours or More in 2023