Updated October 2026.
Energy poverty statistics measure how many households cannot pay for the heating, cooling and power they need, and what happens when they cannot. The same problem has different names. In the United States it is called energy burden or energy insecurity, in the United Kingdom fuel poverty, and in the European Union the inability to keep a home adequately warm.
This page collects the latest figures from the agencies that produce them: the US Energy Information Administration, the Department of Energy, the Department of Health and Human Services, Eurostat, the UK Department for Energy Security and Net Zero, Germany’s network regulator and the World Bank. Every number links to its source and carries the date of the data.
Three themes run through the data. Low-income households pay a far larger share of their income for energy than other households do. Old, poorly insulated homes and failing heating and cooling equipment raise both the bill and the risk. And a shutoff, a cold room or an overheated one is a health event as much as a money problem.
Key Takeaways
- 43.56 million of 132.54 million US households reported at least one form of energy insecurity in 2024. (EIA, Mar 2026)
- EIA’s new national survey counted 13.4 million residential electricity disconnections for unpaid bills in 2024. (EIA, Apr 2026)
- Low-income households spend about 6% of income on energy, three times the 2% spent by other households. (DOE, Jun 2025)
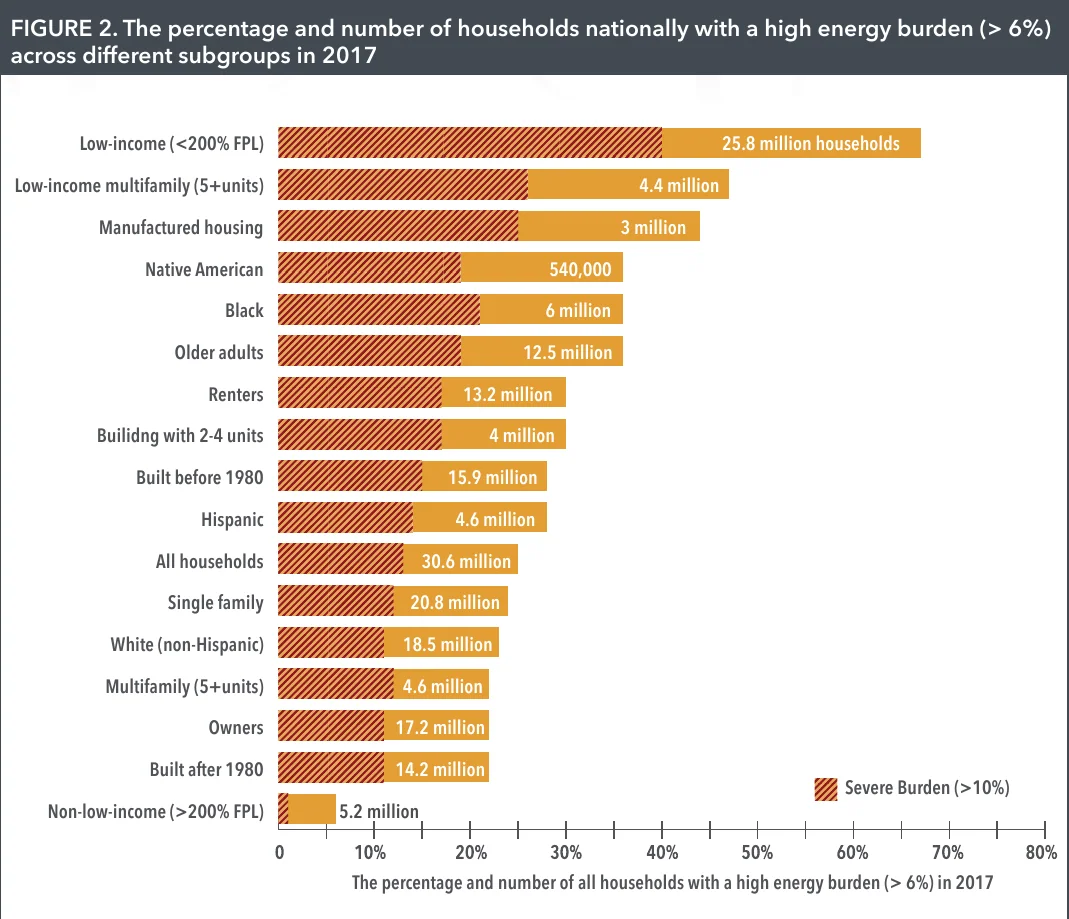
- 67% of low-income US households, 25.8 million, carried a high energy burden of more than 6% of income. (ACEEE, Sep 2020)
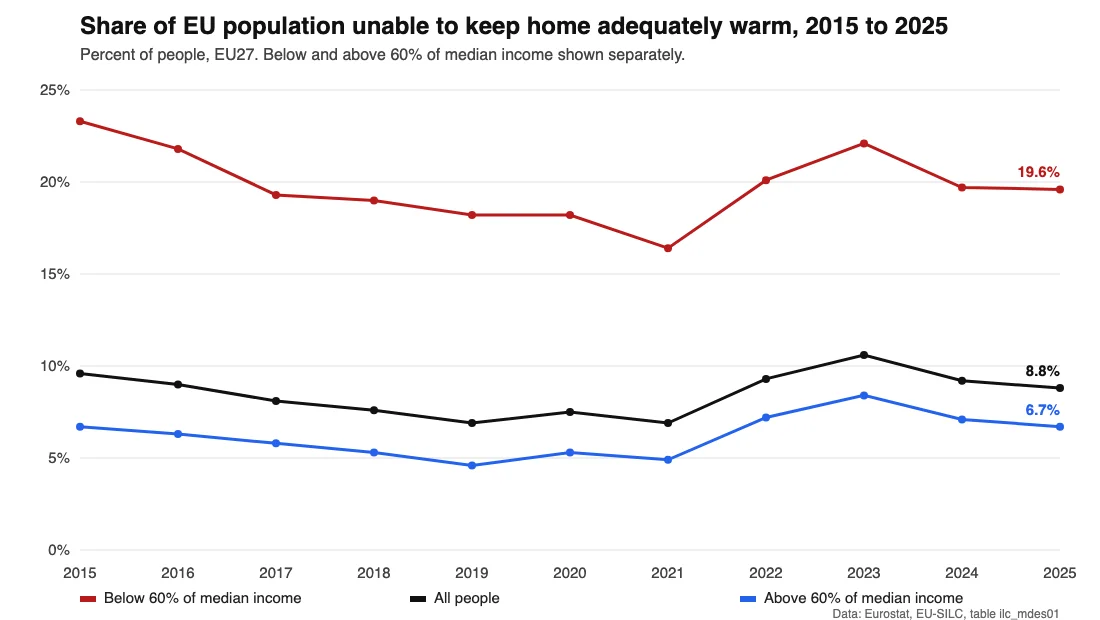
- 8.8% of people in the EU could not keep their home adequately warm in 2025. (Eurostat, Sep 2026)
- Among EU residents below the poverty line, 19.6% could not keep warm, against 6.7% of those above it. (Eurostat, Sep 2026)
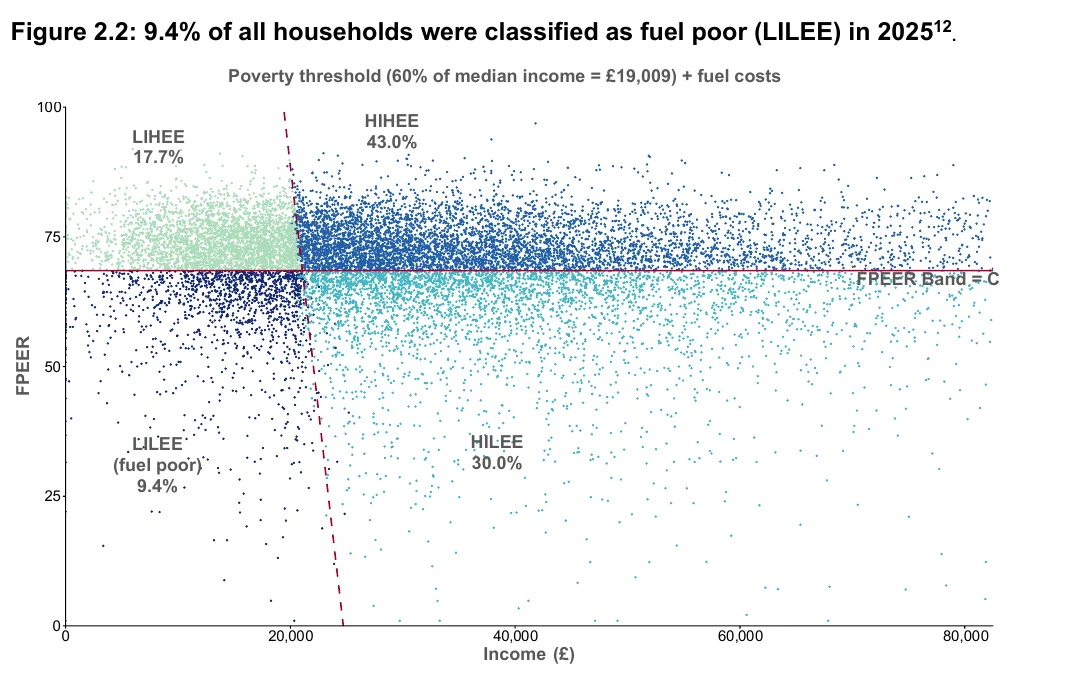
- 9.4% of English households, 2.36 million, were in fuel poverty in 2025. (DESNZ, Mar 2026)
- 43.3% of US adults reported at least one form of energy insecurity in Census Household Pulse data from December 2022 to September 2024. (JAMA Network Open, Oct 2025)
- The federal heating aid program reached 5.7 million households in fiscal year 2022, about 15% of those eligible under the federal income limit. (HHS ACF, Oct 2024)
- New York City residents with three or more energy insecurity indicators had 3.9 times the odds of a mental health condition. (Health Affairs, Feb 2024)
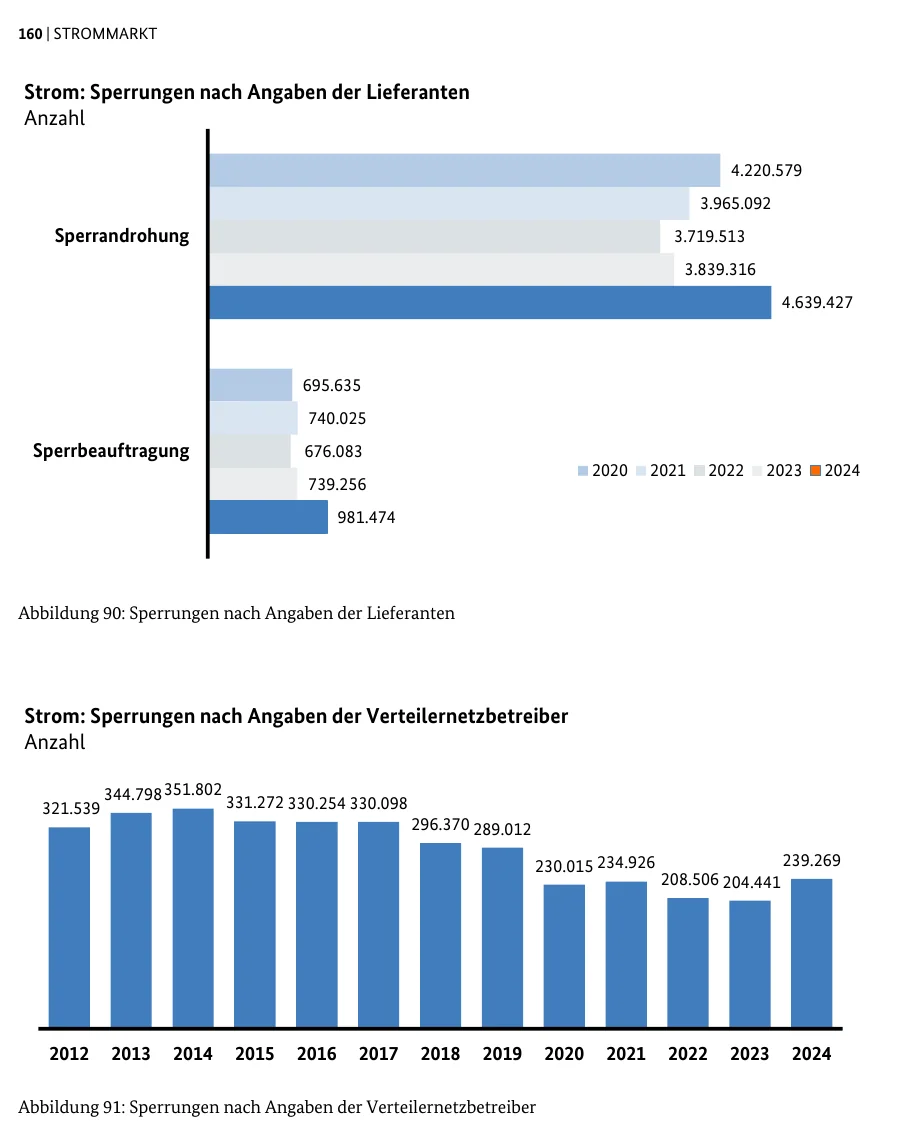
- German network operators carried out 239,269 electricity disconnections in 2024, up from 204,441 in 2023. (Bundesnetzagentur, Jan 2026)
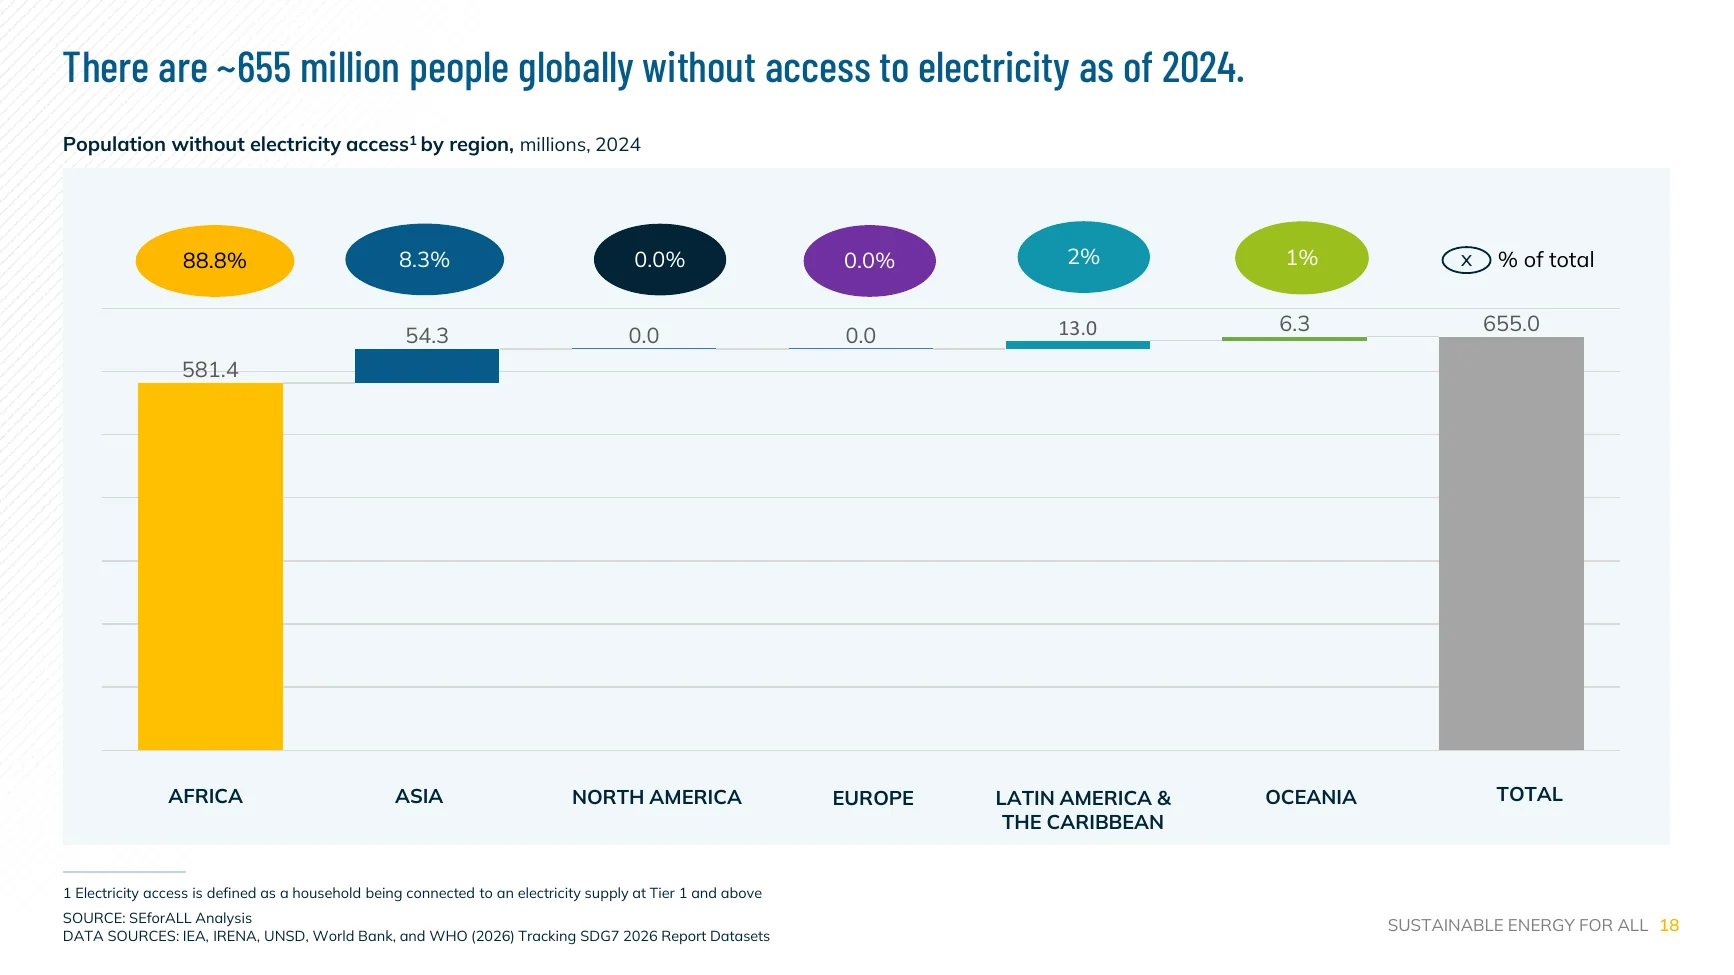
- 655 million people worldwide still lack electricity. (World Bank, Jun 2026)
How Much of Their Income Do US Households Spend on Energy?
Low-income households spend less on energy in dollars than other households, yet it takes a far bigger bite of their income. That gap is what the term energy burden measures.
What counts as a high energy burden?
Energy burden is the share of gross household income spent on energy, and a household at 6% or more is a high energy burden household (DOE, Jun 2025).
- The 6% line follows from a rule of thumb that housing should cost no more than 30% of income and energy no more than 20% of housing costs (ACEEE, Sep 2020).
- ACEEE calls a burden above 10% of income a severe energy burden (ACEEE, Sep 2020).
- Burden can exceed 30% of income in some areas, depending on location and income (DOE, Jun 2025).
How many households carry a high burden?
More than 25% of US households, or 30.6 million, had a high energy burden in the 2017 data (ACEEE, Sep 2020).
- About half of those households, 15.9 million, faced a severe burden (ACEEE, Sep 2020).
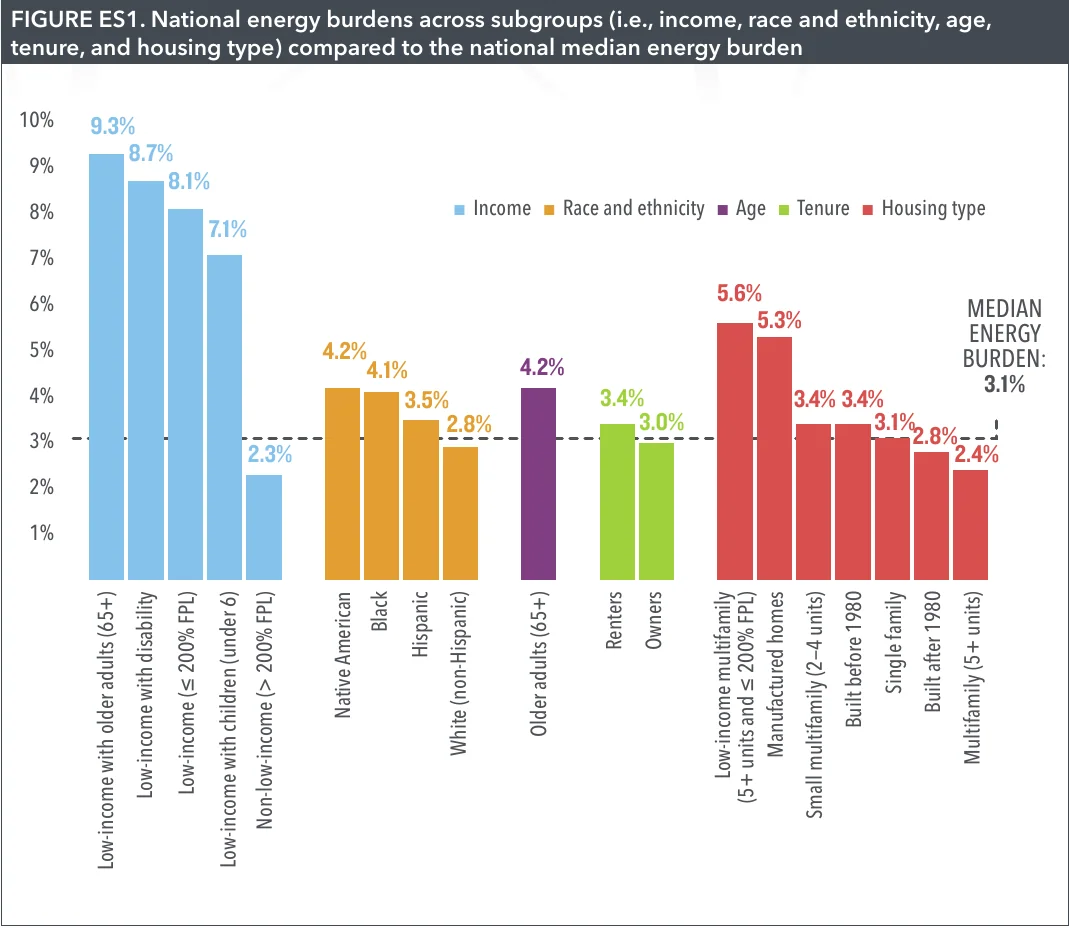
- The typical US household spent a median 3.1% of income on home energy bills (ACEEE, Sep 2020).
- Low-income households spent a median 8.1% of income on energy, against 2.3% for other households (ACEEE, Sep 2020).
- Of the low-income households with a high burden, 60% (15.4 million) faced a severe one (ACEEE, Sep 2020).
- 42% of US households, about 51 million, count as low-income (DOE, Jun 2025).
- 52% of low-income households rent their homes (DOE, Jun 2025).
- One in four low-income households spends more than 15% of income on energy bills (ACEEE, Sep 2024).
- Low-income households spent $1,987 a year on residential energy, against $2,438 for non-low-income households (HHS ACF, Oct 2024).
Which Groups Carry the Heaviest Energy Burden?
Burden follows income first, then the age, race and tenure of the household and the type of building it lives in.
Which low-income households pay the most?
Low-income households with an adult aged 65 or older had the highest median burden of any group, at 9.3% of income (ACEEE, Sep 2020).
- Low-income households with a member who has a disability paid a median 8.7% (ACEEE, Sep 2020).
- Low-income households with children under 6 paid a median 7.1% (ACEEE, Sep 2020).
- Low-income multifamily households paid a median 5.6%, against 2.4% for multifamily households overall (ACEEE, Sep 2020).
- Manufactured homes had a median burden of 5.3% (ACEEE, Sep 2020).
How do race, age and tenure change the picture?
The median burden of Black households was 4.2%, which is 43% higher than the 2.9% of non-Hispanic white households (ACEEE, Sep 2020).
- Hispanic households paid a median 3.5%, 20% above non-Hispanic white households (ACEEE, Sep 2020).
- The median burden of Native American households was 45% higher than that of non-Hispanic white households (ACEEE, Sep 2020).
- Renters paid a median 3.4% of income, 13% more than the 3.0% of owners (ACEEE, Sep 2020).
- 36% of Black, Native American and older adult households had a high energy burden (ACEEE, Sep 2020).
- 28% of Hispanic households had a high energy burden (ACEEE, Sep 2020).
Which US Cities Have the Highest Energy Burden for Low-Income Households?
City averages hide the strain. In the hardest-hit metro areas, half of all low-income households spend more than a tenth of their income on energy.
Which metro areas hit low-income households hardest?
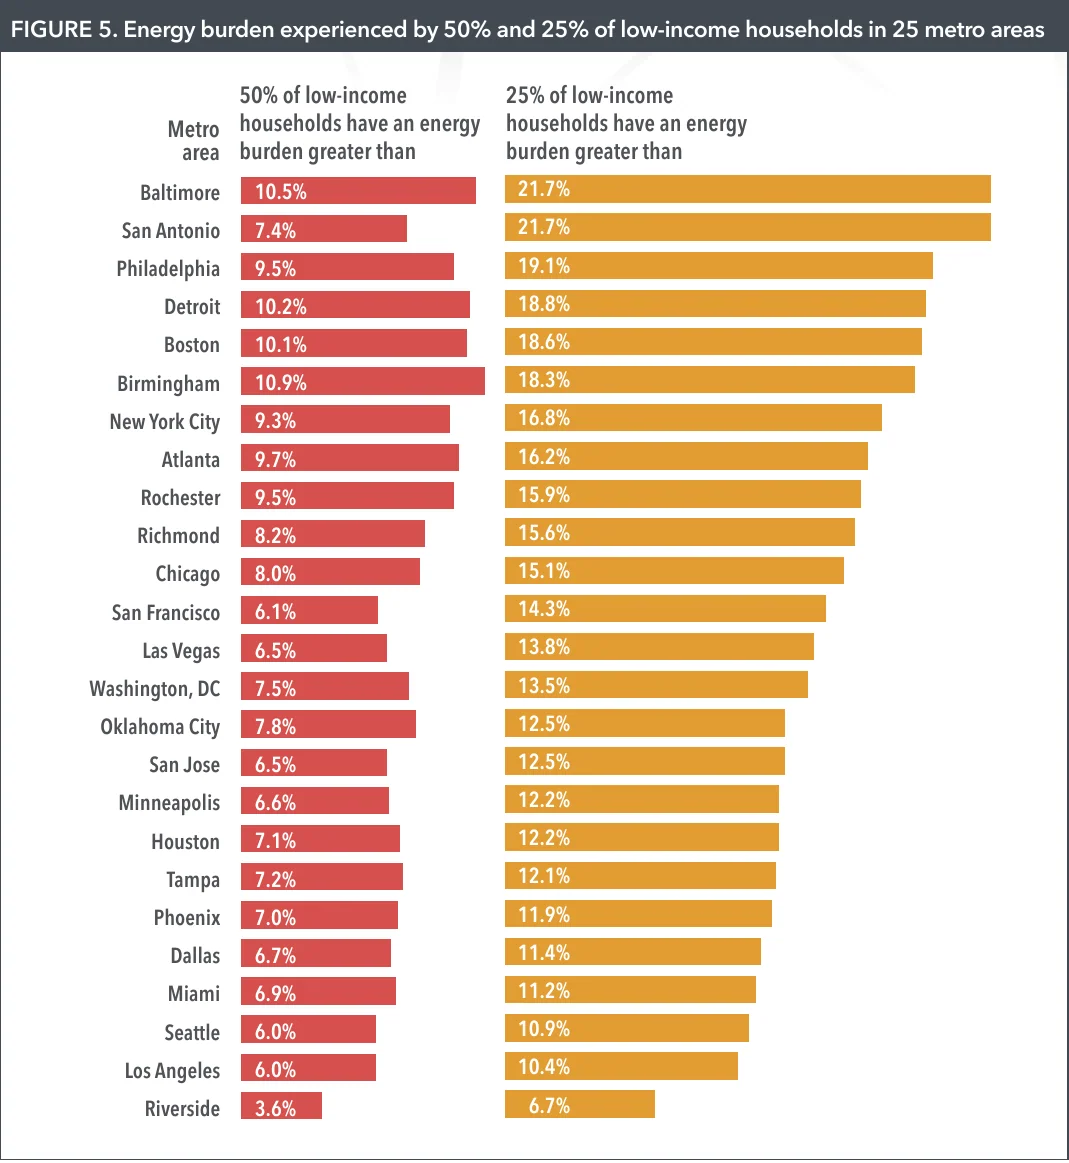
In Birmingham, half of low-income households spent more than 10.9% of income on energy, the highest median among the 25 metro areas studied (ACEEE, Sep 2020).
- Baltimore followed at 10.5%, then Detroit at 10.2% and Boston at 10.1% (ACEEE, Sep 2020).
- Los Angeles and Seattle sat at 6.0%, and Riverside had the lowest median at 3.6% (ACEEE, Sep 2020).
- The worst-off quarter of low-income households in Baltimore and San Antonio paid more than 21.7% of income (ACEEE, Sep 2020).
- In 17 of 25 regions in a 2021 update, the quarter of low-income households with the highest burden paid 15% or more (ACEEE, Sep 2024).
Where is a high burden most common across all households?
Birmingham led, with 34% of all households carrying a high energy burden, against 25% nationally (ACEEE, Sep 2020).
- Detroit followed at 30% (ACEEE, Sep 2020).
- Riverside and Rochester each reached 29% (ACEEE, Sep 2020).
- Atlanta stood at 28% and Philadelphia at 26% (ACEEE, Sep 2020).
- In 23 of the 25 regions in the 2021 update, one in four low-income households had bills above 10% of income (ACEEE, Sep 2024).
- Baltimore had the highest energy burdens in that update, with one in four households paying an average of 26% of income (ACEEE, Sep 2024).
How Many US Households Cannot Pay Their Energy Bills?
Surveys that count households, not averages, show the size of the problem. The 2024 count is larger than the 2020 count, and it covers more than unpaid bills.
What forms does energy insecurity take?
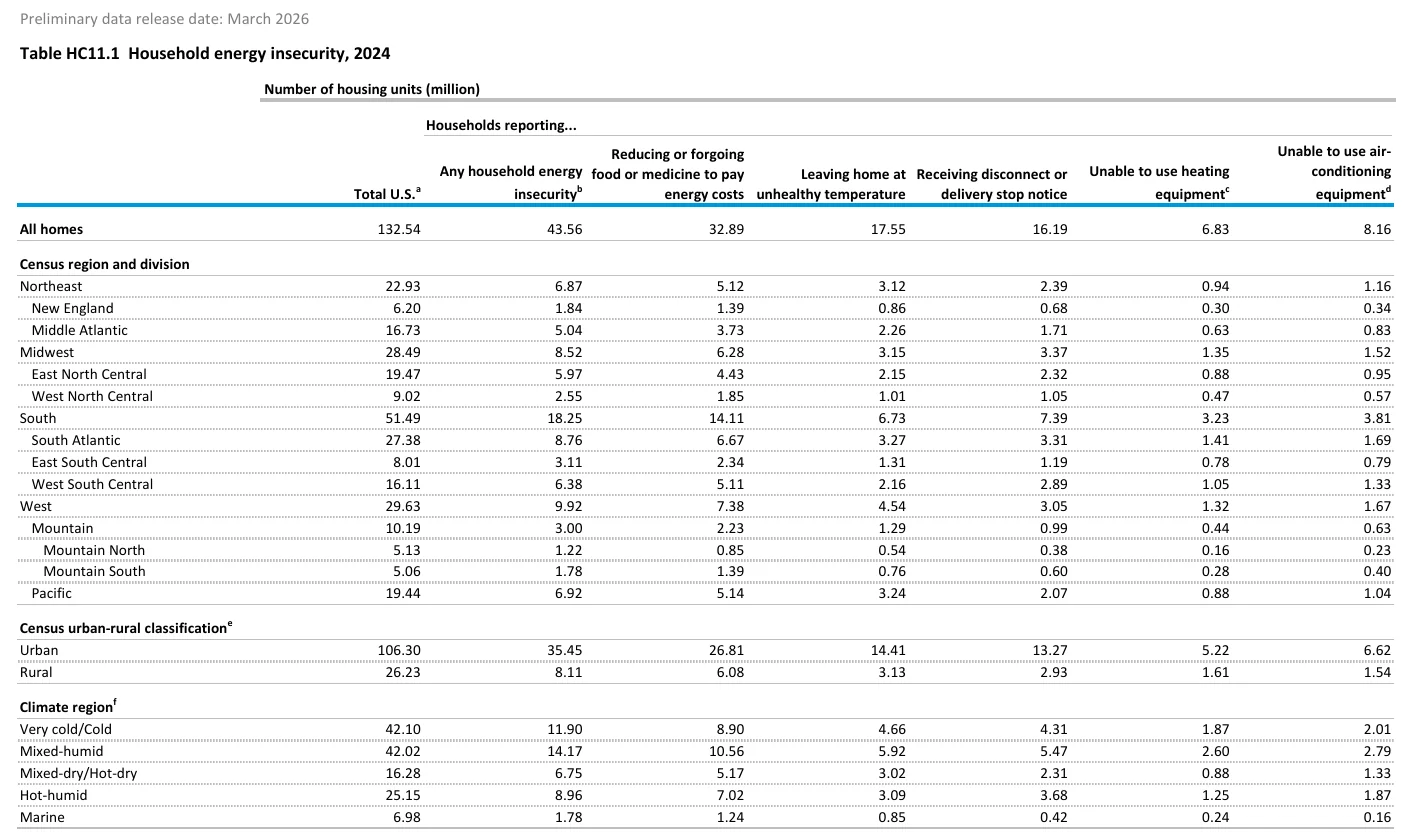
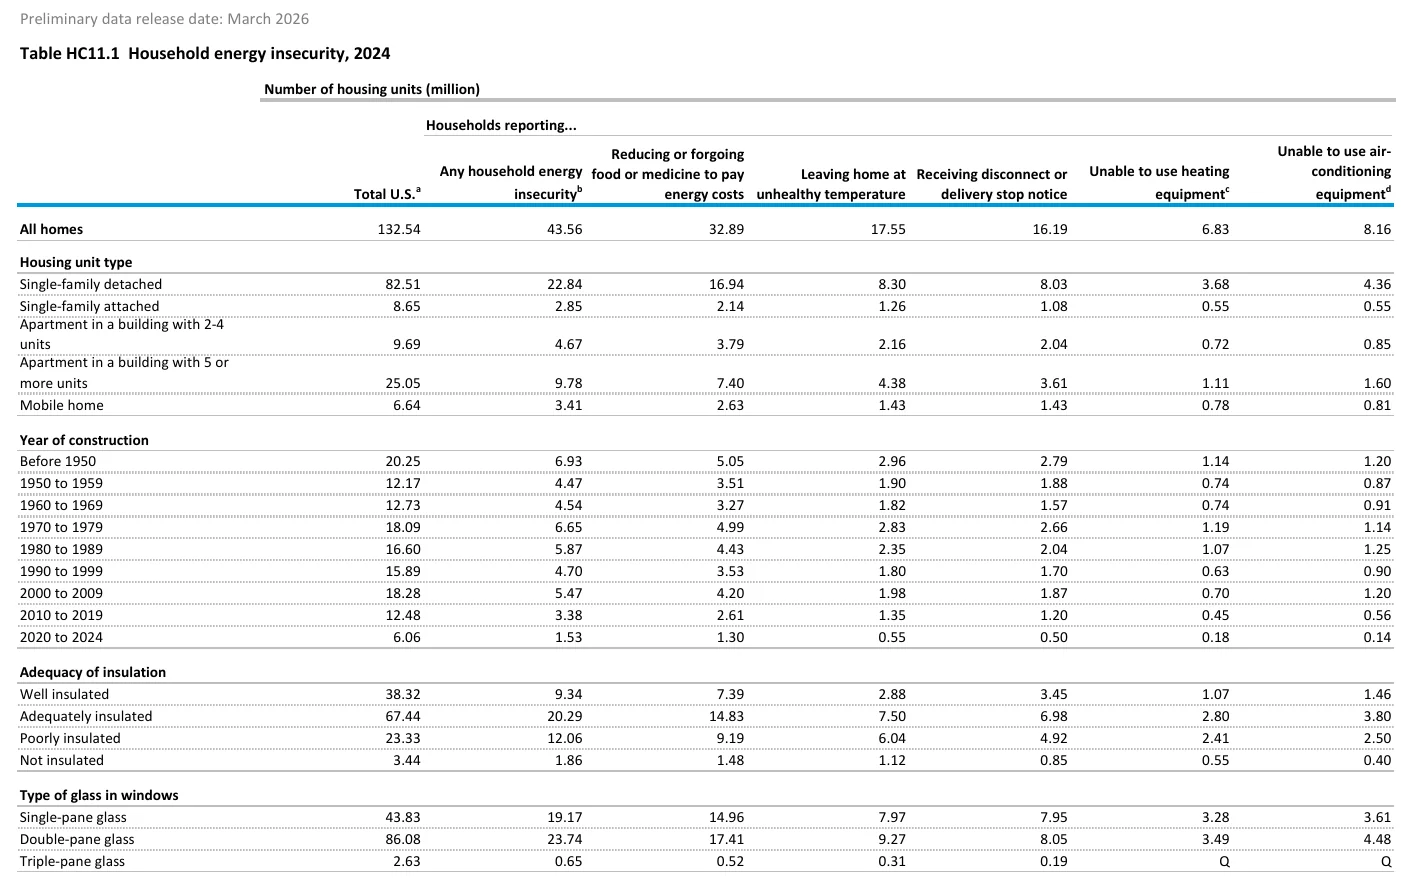
In 2024, 32.89 million households reduced or forwent food or medicine to pay energy costs (EIA, Mar 2026).
- 17.55 million households left their home at an unhealthy temperature (EIA, Mar 2026).
- 16.19 million households received a disconnect or delivery stop notice (EIA, Mar 2026).
- 6.83 million households could not use their heating equipment, because it was broken and unrepaired or because service was cut for lack of payment (EIA, Mar 2026).
- 8.16 million households could not use their air conditioning for the same reasons (EIA, Mar 2026).
- In the 2020 survey, 33.58 million of 123.53 million households reported some energy insecurity (EIA, Aug 2025).
- In 2020, 24.61 million households had cut back on food or medicine and 12.36 million had received a disconnect notice (EIA, Aug 2025).
Who is most exposed, and where?
Insecurity falls steeply as income rises: 3.97 million of the 6.23 million households earning under $10,000 reported it (EIA, Mar 2026).
- Among the 14.32 million households earning $200,000 or more, only 1.07 million did (EIA, Mar 2026).
- The South had 18.25 million insecure households out of 51.49 million (EIA, Mar 2026).
- The mixed-humid climate region had 14.17 million out of 42.02 million (EIA, Mar 2026).
- 14.96 million of the 35.34 million households with children under 18 reported it (EIA, Mar 2026).
- 7.46 million of 13.53 million households with a Black householder reported it (EIA, Mar 2026).
- 8.16 million of 16.32 million households with a Hispanic or Latino householder reported it (EIA, Mar 2026).
Does the Condition of the Home Raise the Risk?
A leaky, poorly insulated home turns an ordinary winter into a hardship. The 2024 survey shows insecurity is far more common where the building envelope is weak and the equipment is failing.
How much does insulation matter?
Of 23.33 million poorly insulated homes, 12.06 million reported energy insecurity, against 9.34 million of 38.32 million well-insulated homes (EIA, Mar 2026).
- 1.86 million of the 3.44 million homes with no insulation reported it (EIA, Mar 2026).
- 2.41 million poorly insulated homes could not use their heating equipment, against 1.07 million well-insulated homes (EIA, Mar 2026).
- 19.17 million of 43.83 million homes with single-pane glass reported it (EIA, Mar 2026).
- 0.65 million of 2.63 million homes with triple-pane glass reported it (EIA, Mar 2026).
Which homes and tenants are most exposed?
Mobile homes stand out: 3.41 million of 6.64 million reported energy insecurity (EIA, Mar 2026).
- 4.67 million of 9.69 million apartments in buildings with 2 to 4 units reported it (EIA, Mar 2026).
- Renters reported it in 20.55 million of 43.00 million homes, while owners reported it in 23.01 million of 89.54 million (EIA, Mar 2026).
- 6.93 million of 20.25 million homes built before 1950 reported it, against 1.53 million of 6.06 million built from 2020 to 2024 (EIA, Mar 2026).
- In 2020, 1.54 million of the 3.03 million households whose main heating was a portable electric heater reported it (EIA, Aug 2025).
Weak envelopes and worn equipment raise a home’s heating and cooling load, and the load decides what size of equipment fits. The BTU calculator gives a first estimate of that load for a single home.
How Many Households Lose Power or Gas for Unpaid Bills?
The country now has a federal count of residential shutoffs. It shows that notices are routine and disconnections are common, and that they are concentrated in a handful of states.
How many notices and disconnections happen each year?
Utilities sent about 94.9 million final notices to residential electricity customers in 2024 (EIA, Apr 2026).
- They sent about 27.1 million final notices to residential natural gas customers (EIA, Apr 2026).
- There were 1.7 million residential natural gas disconnections (EIA, Apr 2026).
- 11.4 million electricity accounts were reconnected after a disconnection (EIA, Apr 2026).
- 1.2 million natural gas accounts were reconnected (EIA, Apr 2026).
- The United States had 143.0 million residential electricity customers in 2024 (EIA, Apr 2026).
Where and when do shutoffs peak?
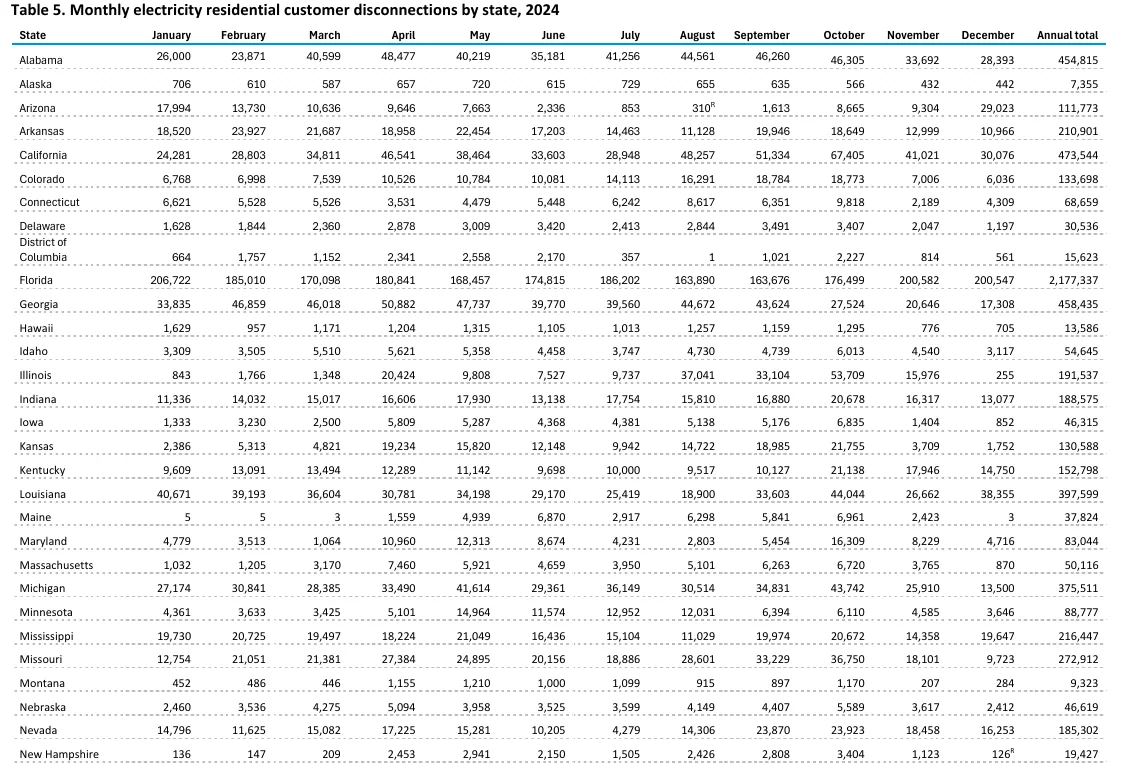
Texas had 3,028,150 residential electricity disconnections in 2024, the most of any state (EIA, Apr 2026).
- Florida had 2,177,337 (EIA, Apr 2026).
- Oklahoma had 572,480 (EIA, Apr 2026).
- October was the peak month for electricity disconnections at 1,490,201, and July the lowest at 967,012 (EIA, Apr 2026).
- Natural gas disconnections peaked in April at 214,726 (EIA, Apr 2026).
- The NEADA association estimates that one in six households is behind on energy bills, owing utilities $23 billion (NEADA, Dec 2025).
- NEADA says utility arrearages remain above $25 billion (NEADA, Jul 2026).
How Much Help Do Low-Income Households Get?
Aid exists, but it reaches a minority of eligible households, and prices keep moving under it. For the savings side of the same problem, see home energy efficiency statistics.
How much does LIHEAP cover?
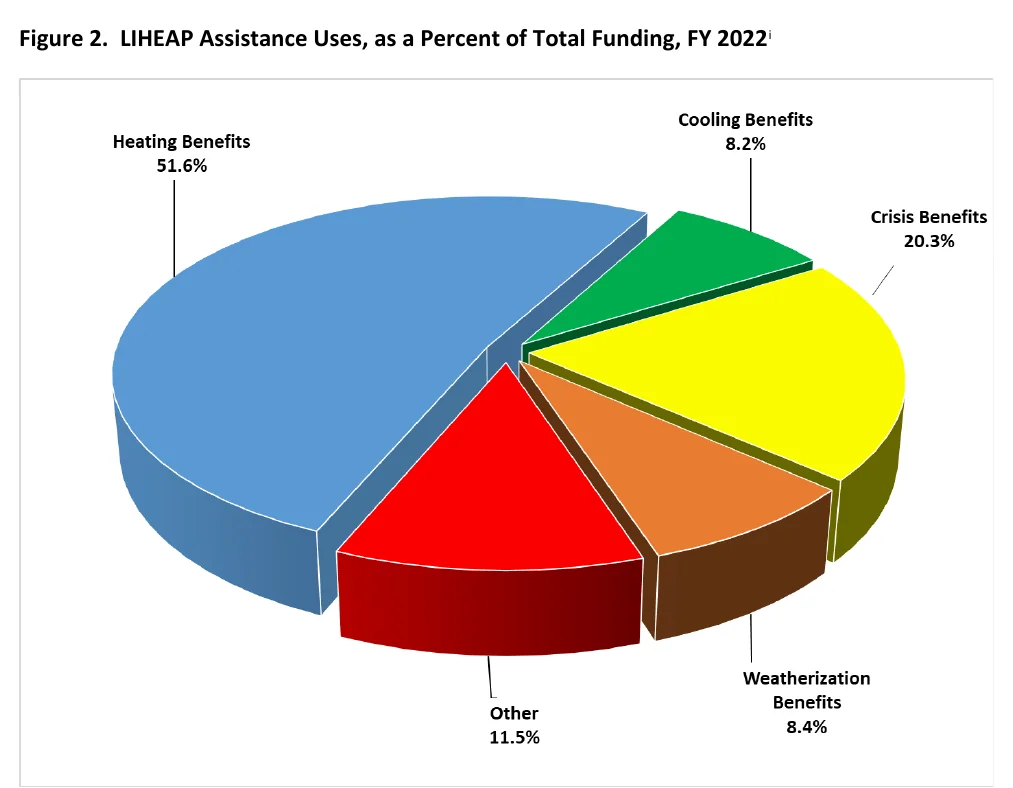
Congress appropriated $3.90 billion to the Low Income Home Energy Assistance Program for fiscal year 2022 (HHS ACF, Oct 2024).
- An estimated 37.3 million households met the federal income limit for the program (HHS ACF, Oct 2024).
- That heating help equals about 17% of households under the stricter income standards many states use (HHS ACF, Oct 2024).
- The average heating benefit was $662, rising to $792 when crisis help was added (HHS ACF, Oct 2024).
- The average cooling benefit was $656 (HHS ACF, Oct 2024).
- Of about 5.1 million households that received heating assistance, 3.4 million had an older adult, a member with a disability or a young child (HHS ACF, Oct 2024).
- 24 states put an estimated $541 million into cooling assistance (HHS ACF, Oct 2024).
- 47 states put an estimated $556 million into low-cost weatherization and energy-related home repair (HHS ACF, Oct 2024).
- The median energy burden of households that received LIHEAP was 12.2% of income (HHS ACF, Oct 2024).
- Low-income households heating with fuel oil had a median burden of 13.6% (HHS ACF, Oct 2024).
Are rising prices widening the gap?
The average US residential electricity price was 18.31 cents per kilowatt-hour in July 2026, up from 17.45 cents in July 2025 (EIA, Sep 2026).
- NEADA projected that households would spend an average $995 on heating in winter 2025 to 2026, up $84 (NEADA, Jan 2026).
- Homes with electric heating faced a projected rise of 12.2% (NEADA, Jan 2026).
- NEADA, using EIA data, reports that the average monthly residential electricity bill rose from about $121 in 2021 to about $156 in 2025 (NEADA, Jan 2026).
- National residential electricity prices rose about 7.6% between January and April 2026 after rising 13% from 2023 to 2025 (NEADA, Jul 2026).
- NEADA asked Congress for a $3.0 billion emergency LIHEAP increase (NEADA, Jul 2026).
- If crude oil stays near $100 a barrel, NEADA expects heating oil bills to rise from about $1,100 to about $1,700 (NEADA, Jul 2026).
What Does Energy Insecurity Do to Health?
The research is clear on direction. Households that cut back on heating, cooling and power report worse mental and physical health, and the odds are large. On the heat side, see heat-related deaths statistics.
How common is energy insecurity among US adults?
In Census Household Pulse data, 33.6% of adults forwent expenses such as food or medicine to pay an energy bill (JAMA Network Open, Oct 2025).
- 22.4% were unable to pay a full or partial energy bill (JAMA Network Open, Oct 2025).
- 22.0% kept their home at an unsafe or unhealthy temperature to save money (JAMA Network Open, Oct 2025).
- Food insecurity was 10.8% in the same period, well below the energy figure (JAMA Network Open, Oct 2025).
What does it do to mental and physical health?
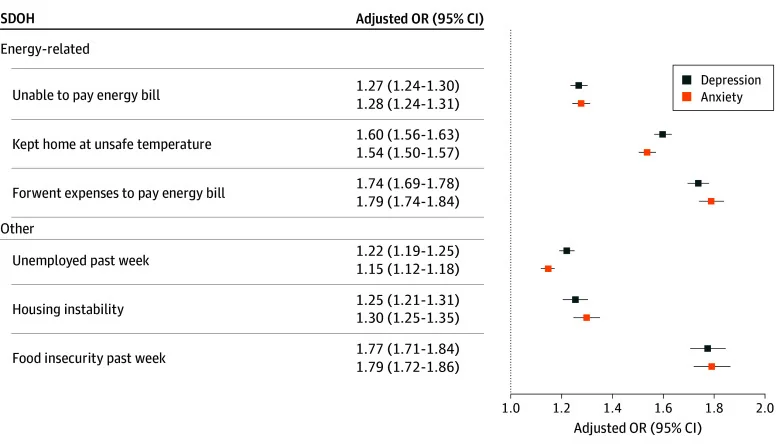
After adjustment for other factors, energy insecurity was linked to 2.29 times the odds of anxiety symptoms and 2.31 times the odds of depression symptoms (JAMA Network Open, Oct 2025).
- Keeping the home at an unsafe temperature carried an odds ratio of 1.60 for depression (JAMA Network Open, Oct 2025).
- Forgoing necessities to pay energy bills carried an odds ratio of 1.74 for depression (JAMA Network Open, Oct 2025).
- A 2022 survey of 1,950 New York City residents found that nearly 30% had three or more energy insecurity indicators (Health Affairs, Feb 2024).
- Those residents had 2.2 times the odds of respiratory conditions and 2.5 times the odds of cardiovascular disease (Health Affairs, Feb 2024).
- They also had 3.4 times the odds of using electric medical devices, which makes a shutoff dangerous (Health Affairs, Feb 2024).
How Many Europeans Cannot Keep Their Homes Warm?
Europe uses one blunt, consistent question: can the household keep its home adequately warm? The answer moved with energy prices.
How has the EU share changed since 2015?
The EU share peaked at 10.6% in 2023, after the energy price spike (Eurostat, Sep 2026).
- It fell to 9.2% in 2024 (Eurostat, Sep 2026).
- The low point was 6.9%, reached in both 2019 and 2021 (Eurostat, Sep 2026).
- In 2015 the share was 9.6% (Eurostat, Sep 2026).
- Among people below the poverty line, the share rose to 22.1% in 2023 (Eurostat, Sep 2026).
Which household types are most at risk?
Households with one adult had a 12.1% rate in 2025, well above the 7.1% for households with two adults (Eurostat, Sep 2026).
- One adult with dependent children reached 15.0% (Eurostat, Sep 2026).
- Single women (13.0%) fared worse than single men (11.1%) (Eurostat, Sep 2026).
- One adult aged 65 or over stood at 11.4% (Eurostat, Sep 2026).
- Among households of three or more adults with children below the poverty line, 26.2% could not keep warm (Eurostat, Sep 2026).
Which European Countries Struggle the Most?
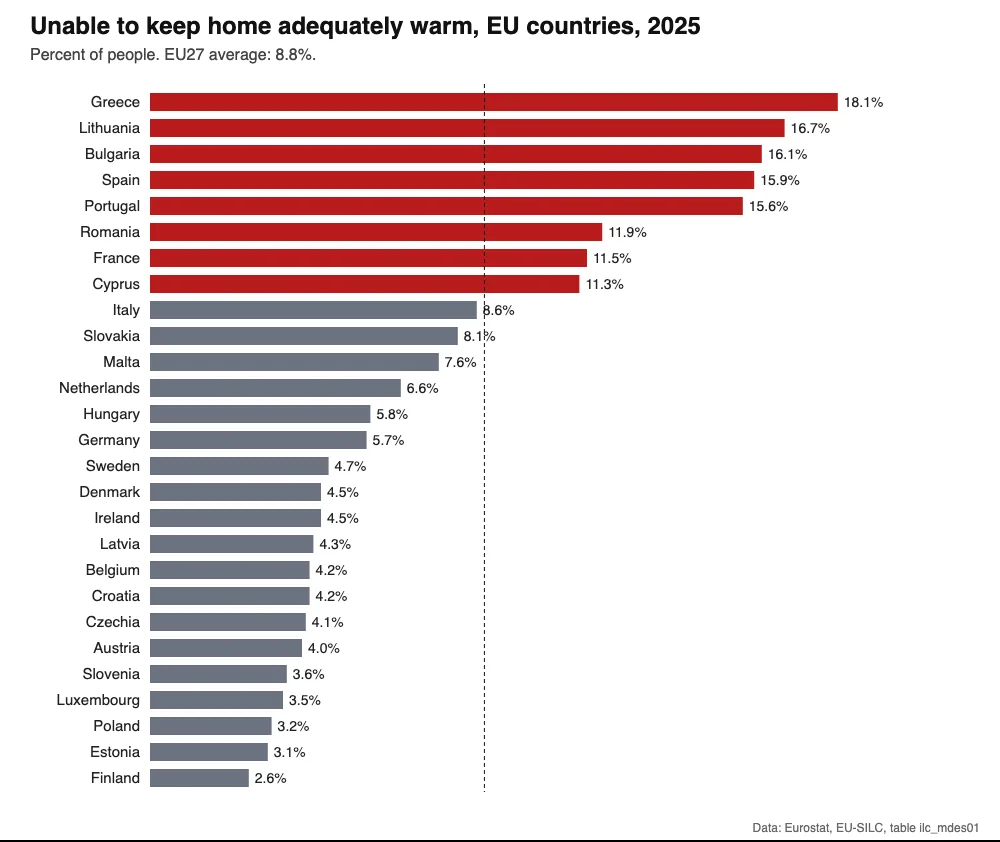
The spread inside the EU is wide. Southern and eastern members have the highest rates, and cold Nordic countries have the lowest, because building quality and income matter more than climate.
Where is the inability to keep warm highest?
Greece had the highest share in the EU in 2025, at 18.1% (Eurostat, Sep 2026).
- Lithuania was at 16.7% and Bulgaria at 16.1% (Eurostat, Sep 2026).
- Spain was at 15.9% and Portugal at 15.6% (Eurostat, Sep 2026).
- France was at 11.5% (Eurostat, Sep 2026).
- Germany was at 5.7% and Poland at 3.2% (Eurostat, Sep 2026).
- Finland had the lowest rate at 2.6% (Eurostat, Sep 2026).
Where are unpaid utility bills most common?
In Greece, 31.9% of people lived in a household in arrears on utility bills in 2025 (Eurostat, Sep 2026).
- Romania was at 17.7% and Bulgaria at 17.2% (Eurostat, Sep 2026).
- The EU average was 7.0% (Eurostat, Sep 2026).
- The Netherlands (2.2%) and Czechia (2.4%) had the lowest rates (Eurostat, Sep 2026).
- Among people below the poverty line, 16.8% were in arrears, against 5.1% above it (Eurostat, Sep 2026).
How do electricity prices and housing quality compare?
The EU average household electricity price was EUR 0.2832 per kilowatt-hour in the first half of 2026, for households using 2,500 to 4,999 kilowatt-hours a year, taxes included (Eurostat, Oct 2026).
- Ireland paid EUR 0.3871 and Germany EUR 0.3618 (Eurostat, Oct 2026).
- Hungary paid EUR 0.1139 (Eurostat, Oct 2026).
- 15.6% of EU residents lived in a dwelling with a leaking roof, damp walls or rot in 2023 (Eurostat, Aug 2026).
How Common Is Fuel Poverty in England?
England publishes the most detailed national series, and it shows what a mix of targeted aid and insulation can do. It also shows what is left: homes that are hard to heat.
How many English households are fuel poor?
In 2024 the final count was 2.47 million households, or 9.9% (DESNZ, Mar 2026).
- The average fuel poverty gap in 2025 was £379, the reduction in fuel costs needed to leave fuel poverty (DESNZ, Mar 2026).
- The aggregate gap across all fuel-poor households was £896 million (DESNZ, Mar 2026).
- 27.1% of households had a low income, and 39.4% were classed as low energy efficiency (DESNZ, Mar 2026).
- 65.2% of low-income households lived in a home rated band C or better, up from 62.6% in 2024 (DESNZ, Mar 2026).
- 30.4% of households (7.63 million) had to spend more than 10% of income after housing costs on energy, down from 34.4% in 2024 (DESNZ, Mar 2026).
What drives fuel poverty in England?
Homes with uninsulated solid walls had the highest rate, at 17.5% of households, against 5.8% for insulated solid walls (DESNZ, Mar 2026).
- Uninsulated cavity walls had a rate of 12.4%, against 5.1% for insulated ones (DESNZ, Mar 2026).
- Households heating mainly with electricity had a rate of 20.3% and an average gap of £732 (DESNZ, Mar 2026).
- Households heating mainly with gas had a rate of 8.0% and an average gap of £239 (DESNZ, Mar 2026).
- The West Midlands had the highest regional rate at 10.9%, and the South East the lowest at 7.8% (DESNZ, Mar 2026).
- Median required energy costs took 6.8% of household income after housing costs, and 14.9% for low-income households (DESNZ, Mar 2026).
Electric-heated homes carry the highest rate, so the choice and sizing of heating equipment shapes the bill. The heat pump sizing calculator shows how a home’s load maps to a heat pump size.
What Do Shutoffs and Policy Look Like in Germany and the EU?
Germany publishes shutoff counts every year, and the EU has turned its warm-home measure into law and money. Together they show how a large economy tracks and funds the problem.
How many German households are cut off?
Suppliers made about 4.6 million disconnection threats to household customers in 2024 (Bundesnetzagentur, Jan 2026).
- About 981,000 of those threats led to a disconnection order to the network operator (Bundesnetzagentur, Jan 2026).
- In 2023 there were 3.8 million threats and 739,000 orders (Bundesnetzagentur, Jan 2026).
- Suppliers also terminated 236,195 contracts, partly for late payment, and 91% of those fell outside the basic supply (Bundesnetzagentur, Jan 2026).
- Network operators carried out 34,393 gas disconnections in 2024, up from 28,059 in 2023 (Bundesnetzagentur, Jan 2026).
- Gas suppliers made 999,000 disconnection threats (Bundesnetzagentur, Jan 2026).
- In the 2012 to 2024 series, electricity disconnections peaked at 351,802 in 2014 (Bundesnetzagentur, Jan 2026).
What has the EU set in law and funding?
The European Commission put the number of Europeans unable to keep their homes warm at approximately 40 million in 2022, or 9.3% of the Union population (European Commission, Oct 2023).
- The law that created the Social Climate Fund cited 34 million Europeans, 6.9% of the population, who could not afford to heat their home in a 2021 survey (EU Regulation 2023/955, May 2023).
- The Energy Efficiency Directive cited around 34 million households unable to keep warm in 2019 (EU Directive 2023/1791, Sep 2023).
- Poland holds the largest share of the Social Climate Fund at 17.60% (EU Regulation 2023/955, May 2023).
- France holds 11.19% and Italy 10.81% (EU Regulation 2023/955, May 2023).
- Romania holds 9.25% (EU Regulation 2023/955, May 2023).
How Many People Worldwide Lack Basic Energy?
The global picture frames the rest. Where the grid does not reach, the question is not the size of a bill but whether there is any power at all.
How many people lack electricity?
Sub-Saharan Africa had over 560 million people without electricity, a disproportionate share of the global gap (World Bank, Jun 2026).
- The global access rate stagnated at 92% in 2024 (World Bank, Jun 2026).
- The deficit fell by about 11 million people from 2023 (SEforALL, Jul 2026).
- Africa holds about 89% of the world’s unelectrified population (SEforALL, Jul 2026).
- Roughly 644 million people are projected to lack access in 2030 (SEforALL, Jul 2026).
- Universal access by 2030 would mean connecting about 177 million people a year (SEforALL, Jul 2026).
How many people cook with polluting fuels?
Two billion people, roughly a quarter of the world’s population, still lack clean cooking (World Bank, Jun 2026).
- 970 million of them live in Sub-Saharan Africa (World Bank, Jun 2026).
- 89% of urban residents have clean cooking, against 56% of rural residents (World Bank, Jun 2026).
- About 1.6 billion people are projected to lack clean cooking in 2030 (SEforALL, Jul 2026).
- Clean energy finance flows to the least developed countries fell 11% to $3.7 billion in 2024 (World Bank, Jun 2026).
Methodology and Sources
Every figure on this page comes from the agency, regulator, statistics office or research body that produced it, and each link points to the source document or data table. Where a number comes from a survey that has a newer edition, the newer edition is used and the older one appears only as a comparison. NEADA is an association of state energy assistance directors, and its figures are labeled as its own estimates. US burden figures use different data and methods, so they differ: the Department of Energy uses the American Community Survey, ACEEE uses the 2017 American Housing Survey, and the federal aid report uses the 2020 Residential Energy Consumption Survey. Eurostat figures are survey answers on the EU-SILC survey and are not directly comparable with US or UK measures. This page is checked and refreshed monthly.
Glossary
- Energy burden: the share of gross household income spent on energy bills.
- High and severe burden: more than 6% and more than 10% of income spent on energy.
- Energy insecurity: the inability to meet household energy needs, measured by missed bills, cut-backs on necessities, unsafe indoor temperatures or lost service.
- Fuel poverty: the term used in the United Kingdom. In England a household is fuel poor if it has a low income and a home with a low energy efficiency rating.
- LIHEAP: the Low Income Home Energy Assistance Program, a US federal block grant for bill help, crisis aid and weatherization.
- RECS: the Residential Energy Consumption Survey run by the US Energy Information Administration.
- EU-SILC: the European Union Statistics on Income and Living Conditions survey, which asks households whether they can keep their home adequately warm.
- ACEEE: the American Council for an Energy-Efficient Economy.
- NEADA: the National Energy Assistance Directors Association.
- DESNZ: the UK Department for Energy Security and Net Zero.
- SDG7: the United Nations Sustainable Development Goal on affordable, reliable and clean energy.
Sources
- DOE, Low-Income Energy Affordability Data (LEAD) Tool
- ACEEE, How High Are Household Energy Burdens?
- ACEEE, One in Four Low-Income Households Spend Over 15% of Income on Energy Bills
- EIA, Residential Energy Consumption Survey 2024, Table HC11.1
- EIA, Residential Energy Consumption Survey 2020, Table HC11.1
- EIA, 2024 Residential Utility Disconnections Report
- EIA, Electric Power Monthly, Table 5.6.A
- HHS ACF, LIHEAP Report to Congress for Fiscal Year 2022
- NEADA, Winter heating outlook, December 2025
- NEADA, Mid-winter heating price update, January 2026
- NEADA, $3 billion LIHEAP request, July 2026
- JAMA Network Open, Energy Insecurity and Mental Health Symptoms in US Adults
- Health Affairs, Energy Insecurity Indicators Associated With Respiratory, Mental Health, And Cardiovascular Conditions
- Eurostat, Inability to keep home adequately warm (ilc_mdes01)
- Eurostat, Arrears on utility bills (ilc_mdes07)
- Eurostat, Electricity prices for household consumers (nrg_pc_204)
- Eurostat, Leaking roof, damp walls or rot (ilc_mdho01)
- DESNZ, Annual Fuel Poverty Statistics in England, 2026
- Bundesnetzagentur and Bundeskartellamt, Monitoringbericht 2025
- European Commission, Recommendation (EU) 2023/2407 on energy poverty
- EU, Regulation (EU) 2023/955 establishing a Social Climate Fund
- EU, Directive (EU) 2023/1791 on energy efficiency
- World Bank, 655 Million People Still Without Electricity
- SEforALL, Tracking SDG7: The Energy Progress Report 2026, deep dive