Carbon monoxide poisoning statistics point one way in the United States: deaths tied to fuel-burning products are rising, and most of them happen at home. The gas, called CO, has no color, smell or taste, so nobody can sense it. A furnace with a bad vent, a generator in a garage or a charcoal grill in a tent can fill a room before anyone feels sick.
This page gathers 132 sourced numbers from the CDC, the Consumer Product Safety Commission (CPSC), peer-reviewed studies and health agencies in Canada and the UK. Every number links to the report that first published it, with the date. We use the newest release on each topic. The CPSC report on 2022 deaths came out in May 2026, so death counts for the most recent years are still being filled in.
HVAC techs, home inspectors and homeowners can use it to see which appliances do the harm, when the risk peaks and how many homes have an alarm. For the energy side of heating equipment, see HVAC energy consumption statistics. Updated October 2026.
Key Takeaways
- More than 400 Americans die each year from CO poisoning that is not linked to fires, more than 100,000 visit an emergency department and more than 14,000 are hospitalized (CDC, Jan 2026).
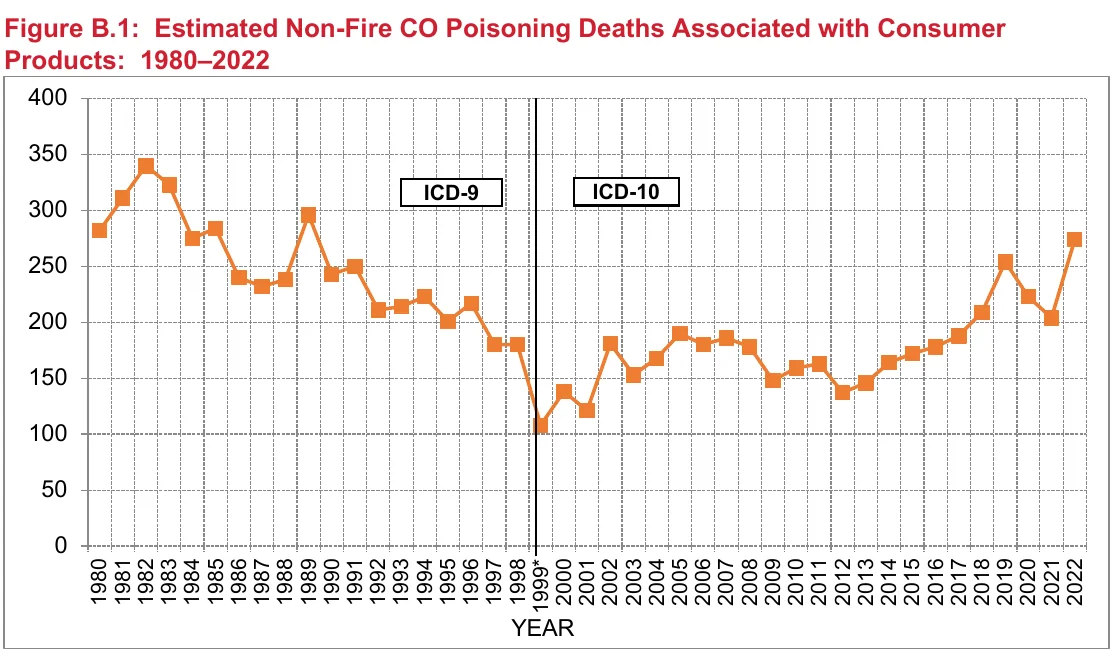
- An estimated 274 people died from CO tied to consumer products in 2022, more than in any year since the coding change of 1999 (CPSC, May 2026).
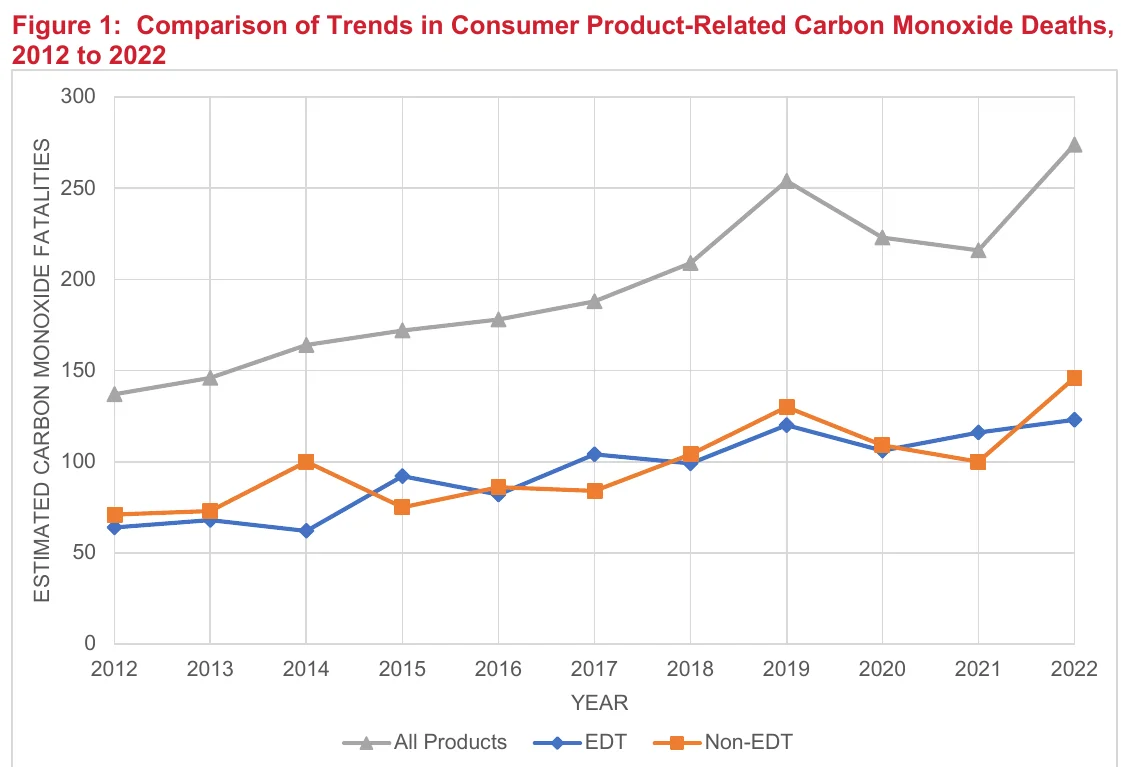
- Generators alone were tied to 892 CO deaths from 2012 to 2022, or 41% of all consumer product CO deaths (CPSC, May 2026).
- In 2021, accidental CO deaths (543) outnumbered intentional ones (524) in the US for the first time (Clinical Toxicology, Jul 2023).
- Adults 45 and older made up about 67% of product-related CO deaths but only 42% of the population (CPSC, May 2026).
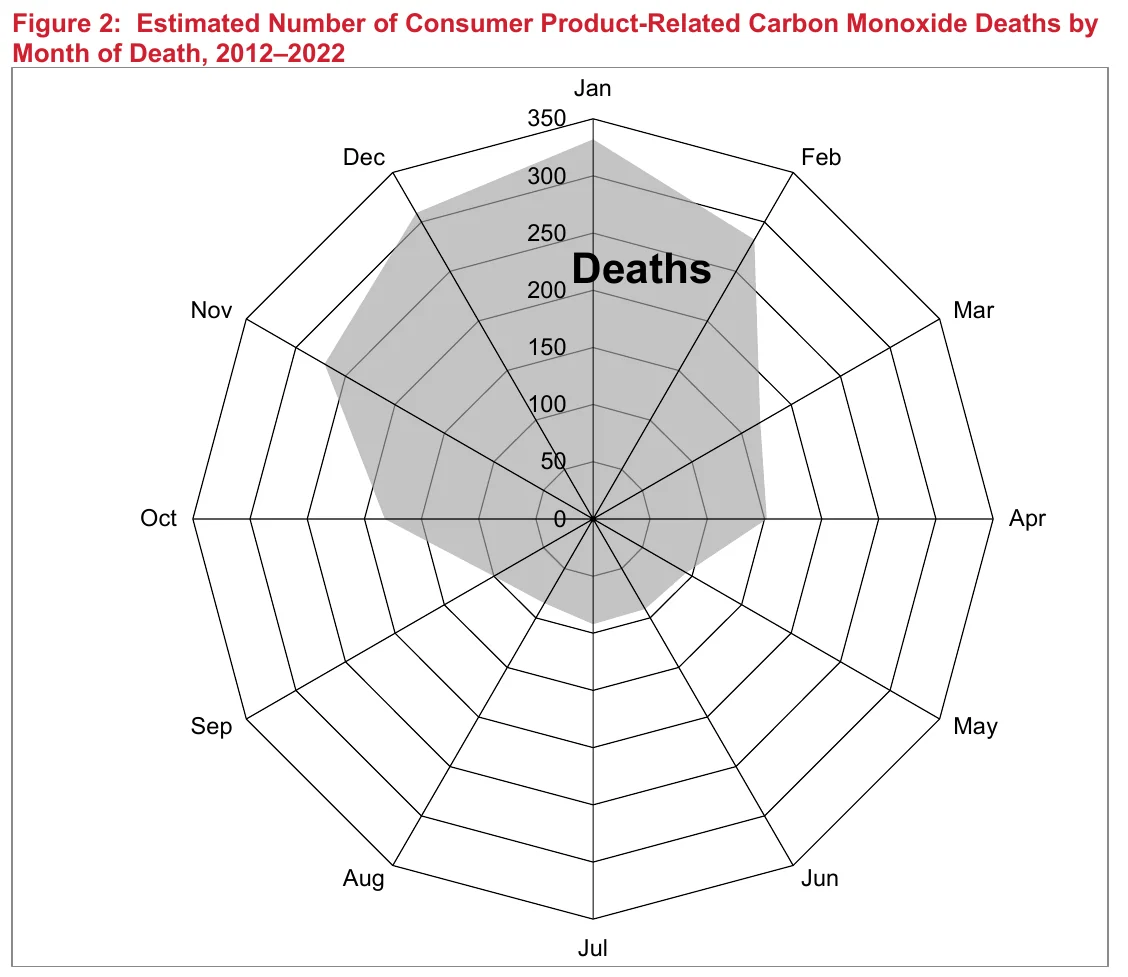
- 59% of product-related CO deaths from 2020 to 2022 happened in November, December, January and February (CPSC, May 2026).
- 36% of US adults, about 86.2 million people, have no way to detect CO in their homes (UL Standards & Engagement, May 2024).
- 62% of portable generator owners say they do not feel at risk of CO poisoning from their generator (UL Standards & Engagement, May 2024).
- A simulation of 511 real generator deaths found that generators built to the UL 2201 standard would have averted nearly 100% of them (CPSC, Feb 2022).
- Four hours without power raised the odds of a child’s CO emergency visit by at least 50%, and by at least 150% in large outages (Pediatrics, Jun 2025).
- Winter Storm Uri caused 19 CO deaths in Texas, 7.7% of the 246 storm-related deaths (Texas DSHS, Dec 2021).
- Fire departments answered 82,245 CO incidents in 2023, and another 79,286 alarm activations where no CO was found (NFPA, Jan 2025).
- High-income North America was one of only two world regions where CO death rates rose between 2000 and 2021, up 30.4% (Lancet Public Health, Nov 2023).
Carbon Monoxide Death Statistics: How Many Americans Die Each Year?
The toll is small next to heart disease or cancer, yet it is almost all preventable, and it has been climbing. Two data sets tell the story: all unintentional CO deaths, and deaths tied to consumer products such as generators and heaters.
How many people die from CO poisoning in the US each year?
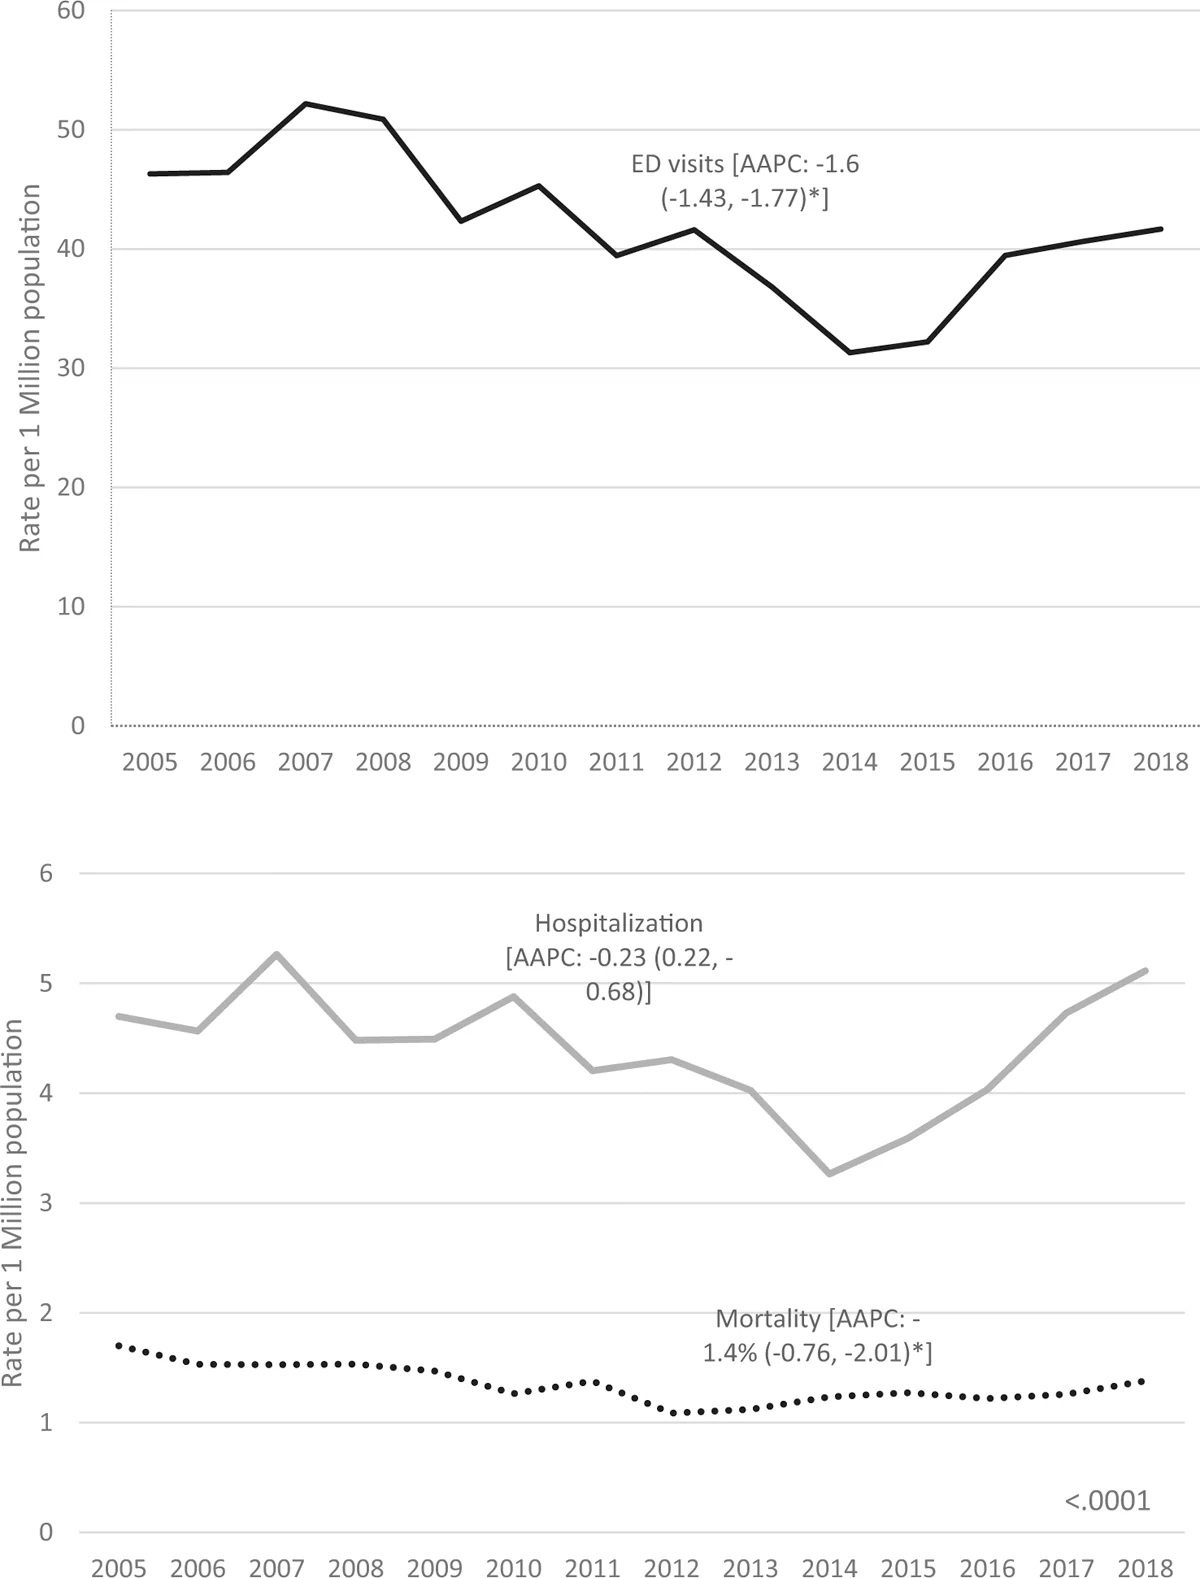
From 2005 to 2018, a study by CDC and partners counted 3.3 unintentional CO deaths per million people each year (Annals of Emergency Medicine, Mar 2023).
- Non-fire cases made up 40.9% of unintentional CO deaths, and fire-related or unknown causes made up the rest (Annals of Emergency Medicine, Mar 2023).
- Earlier CDC work found an average of 439 unintentional, non-fire CO deaths a year from 1999 to 2004, a rate of 1.5 per million (MMWR, Dec 2007).
- Counting all intents, total CO deaths fell from 1,253 in 2015 to 1,067 in 2021, because intentional deaths dropped faster than accidental ones rose (Clinical Toxicology, Jul 2023).
How many CO deaths come from consumer products?
CPSC counts only unintentional, non-fire deaths linked to products it oversees, such as heaters, generators and grills. Its estimates average 189 deaths a year from 2012 to 2021 (CPSC, May 2026).
- The average for 2020 to 2022 was 238 deaths a year (CPSC, May 2026).
- The 2012 estimate, the low point of the decade, was 137 deaths (CPSC, May 2026).
- Every yearly estimate from 2018 to 2022 is higher than every estimate from 2012 to 2017, and the 11-year rise is statistically significant at p below 0.0001 (CPSC, May 2026).
- The all-time high in CPSC’s series is 340 deaths, in 1982 (CPSC, May 2026).
- The three-year average death rate reached 7.15 per 10 million people in 2021, above the 6.21 of 2006, a year shaped by Hurricane Katrina and other 2005 storms (CPSC, May 2026).
How complete are the newest numbers?
Not fully. Death certificates for 2022 were only 90% complete when CPSC wrote its report, so the 2022 estimate may change (CPSC, May 2026).
- CPSC had records of 182 separate fatal incidents in 2022, and 21% of them killed more than one person (CPSC, May 2026).
Carbon Monoxide Poisoning ER Visits, Hospital Stays and Health Effects
Most people who breathe too much CO live, but many are hurt, and the harm can last for years. ER counts also hide cases, because CO symptoms look like the flu.
How many people go to the ER or hospital for CO?
A study by CDC and partners found 56.5 ER visits and 7.3 hospital stays per million people each year from 2005 to 2018, in the states that report these data (Annals of Emergency Medicine, Mar 2023).
- Poison centers logged 172,489 unintentional CO exposure cases over those 14 years (Annals of Emergency Medicine, Mar 2023).
- In 2007, one national hospital sample counted 21,304 ER visits for confirmed CO cases and 2,302 hospital stays (Public Health Reports, Sep 2012).
- Hyperbaric oxygen facilities reported 552 CO patients treated in 2009 (Public Health Reports, Sep 2012).
- Of 68,316 CO exposures reported to poison centers from 2000 to 2009, 45.1% were handled by phone at the scene and 53.7% were treated at a health care facility (MMWR, Aug 2011).
- Medical care for non-fire CO poisoning cost between $33.6 million and $37.7 million a year in 2013 dollars (American Journal of Emergency Medicine, Mar 2018).
Who gets sick most often?
Young children and the very old carry the highest rates, for different reasons. Children aged 0 to 9 had the highest ER visit rate, 70.5 per million (Annals of Emergency Medicine, Mar 2023).
- Adults over 80 had the highest hospital stay rate (20.2 per million) and death rate (9.9 per million) (Annals of Emergency Medicine, Mar 2023).
- 80.3% of poison center cases happened at a residence and 9.5% at work (Annals of Emergency Medicine, Mar 2023).
- The most reported symptoms were headache (24.8%), nausea (14.3%) and dizziness (12.4%) (Annals of Emergency Medicine, Mar 2023).
What does CO do to the body?
CO binds to hemoglobin with an affinity about 250 times that of oxygen, which starves cells of oxygen (CPSC, May 2026).
- Healthy adults show symptoms at about 10% carboxyhemoglobin, may lose consciousness above 20%, and typically need more than 50% to die (CPSC, May 2026).
- A blood level of 2% or more in non-smokers, or 9% or more in smokers, strongly supports a diagnosis (CDC Health Alert Network, Feb 2021).
- Heart damage is common: 37% of 230 patients treated for moderate to severe poisoning had myocardial injury (JAMA, Jan 2006).
- Those with heart injury were more likely to die later, 38% versus 15% over a median of 7.6 years (JAMA, Jan 2006).
- In one trial, 25.0% of patients given hyperbaric oxygen had cognitive problems six weeks later, against 46.1% of those given normal-pressure oxygen (New England Journal of Medicine, Oct 2002).
What Causes Carbon Monoxide Poisoning? Generators, Heaters and Furnaces
Engines now kill more people than home heating does. But heating gear is still the second biggest cause, and it is the part of the problem that HVAC work touches.
Which products are linked to the most CO deaths?
Engine-driven tools were tied to 107 of the 274 product-related CO deaths in 2022 (39%), and 93 of those involved generators (CPSC, May 2026).
- Heating systems came second, with an estimated 76 deaths, or 28% (CPSC, May 2026).
- Charcoal and charcoal grills were tied to 18 deaths, 7% of the total (CPSC, May 2026).
- 33 deaths (12%) involved several fuel-burning products at once, so no single source could be named (CPSC, May 2026).
- Over 11 years, deaths tied only to engine-driven tools (1,017) beat deaths tied only to heating systems (622) (CPSC, May 2026).
How many CO deaths come from furnaces, boilers and water heaters?
Installed heating equipment is a smaller share than portable gear, but it is where a tech can make a difference. Furnaces and boilers of all fuels were tied to 20 deaths in 2022, and water heaters to 9 (CPSC, May 2026).
- 88% of the 76 heating-system deaths involved gas equipment (CPSC, May 2026).
- Natural gas heating was tied to 15 deaths, and 11 of those involved installed natural gas furnaces (CPSC, May 2026).
- Propane heating was tied to 43 deaths, and about 70% of those involved unvented portable propane heaters (CPSC, May 2026).
- 16 deaths involved gas ranges that were used, or suspected of being used, to heat a room (CPSC, May 2026).
- In Canadian emergency room records, furnaces were the named source in 6.4% of CO cases, vehicles in 14.1% and barbecues in 7.6% (Public Health Agency of Canada, Aug 2023).
Techs who replace a furnace can size the new one with the free furnace sizing calculator. Age and replacement timing are covered in residential HVAC replacement statistics.
How dangerous are portable and standby generators?
CPSC says nearly 100 people a year die in the US from CO caused by portable generators (CPSC, Feb 2026).
- From 2008 to CPSC’s February 2022 release, portable generators were tied to an estimated 790 CO deaths, 43% of the product total (CPSC, Feb 2022).
- Generators built to the less effective PGMA G300 standard would have averted nearly 87% of those simulated deaths (CPSC, Feb 2022).
- Gasoline generators were tied to 71 of the 93 generator deaths in 2022 (CPSC, May 2026).
- After Hurricane Ida, CPSC learned of 256 New Orleans area homes with at least one CO exposure, and 105 of them blamed a permanent standby generator (CPSC, Jun 2025).
- Exhaust from those standby units traveled at least 25 feet, so the 5-foot clearance in NFPA 37 was not enough (CPSC, Jun 2025).
What about boats and vehicles?
Boats are a small slice. In 2024 the Coast Guard logged 5 CO incidents on recreational boats, with 2 deaths and 26 injuries (US Coast Guard, Jun 2025).
Who Dies From Carbon Monoxide, and When?
Risk follows the calendar and the cold. It also follows age, sex and place, and the pattern is not what most people expect.
Which months are the deadliest?
Over the 11 years to 2022, 55% of product-related CO deaths happened in the four coldest months (CPSC, May 2026).
- December 2022 alone had an estimated 62 deaths (CPSC, May 2026).
- Only 17% of deaths fell in May through August (CPSC, May 2026).
- The Midwest had the highest CO death rate, 5.0 per million, while the Northeast had the highest poison center call rate, 57.2 per million (Annals of Emergency Medicine, Mar 2023).
Who is most at risk by age, sex and race?
Children under 15 were 18% of the population but only 3% of product-related CO deaths in 2020 to 2022 (CPSC, May 2026).
- Men were 78% of victims in 2022 (CPSC, May 2026).
- In all unintentional non-fire cases, men were 66.3% of deaths, and adults aged 50 to 59 were the largest age group at 17.3% (Annals of Emergency Medicine, Mar 2023).
- African Americans are about 12% of the population but suffered 22% of portable generator CO deaths each year (CPSC, Feb 2022).
- In hurricane-prone states from 2014 to 2019, CO death rates were nearly twice as high among Black adults (0.5 versus 0.3) (Journal of Public Health, Jun 2023).
- In New York State, Black children had a CO emergency visit rate of 9.1 per 100,000 person-years, and children aged five or younger had 7.8 (Pediatrics, Jun 2025).
Where do CO deaths happen?
At home, mostly. An estimated 64% of 2022 product-related CO deaths happened in a home location, which includes sheds, detached garages and campers used as a home (CPSC, May 2026).
- Temporary shelters such as cabins and trailers accounted for 57 deaths in 2022 (CPSC, May 2026).
- Vehicles, including boats, accounted for 32 deaths (CPSC, May 2026).
- Urban core areas held 73% of the population but only 49% of deaths, while small towns and isolated rural areas held 5% of the population and 15% of deaths (CPSC, May 2026).
- The Mountain region had 14% of deaths against 8% of the population (CPSC, May 2026).
- Among states, Nebraska had the highest reliable CO death rate from 1999 to 2004 (MMWR, Dec 2007).
Power Outages and Storms: When Generators Turn Deadly
A storm takes the grid down, and people reach for a generator, a grill or a heater. CO deaths follow the outage map closely.
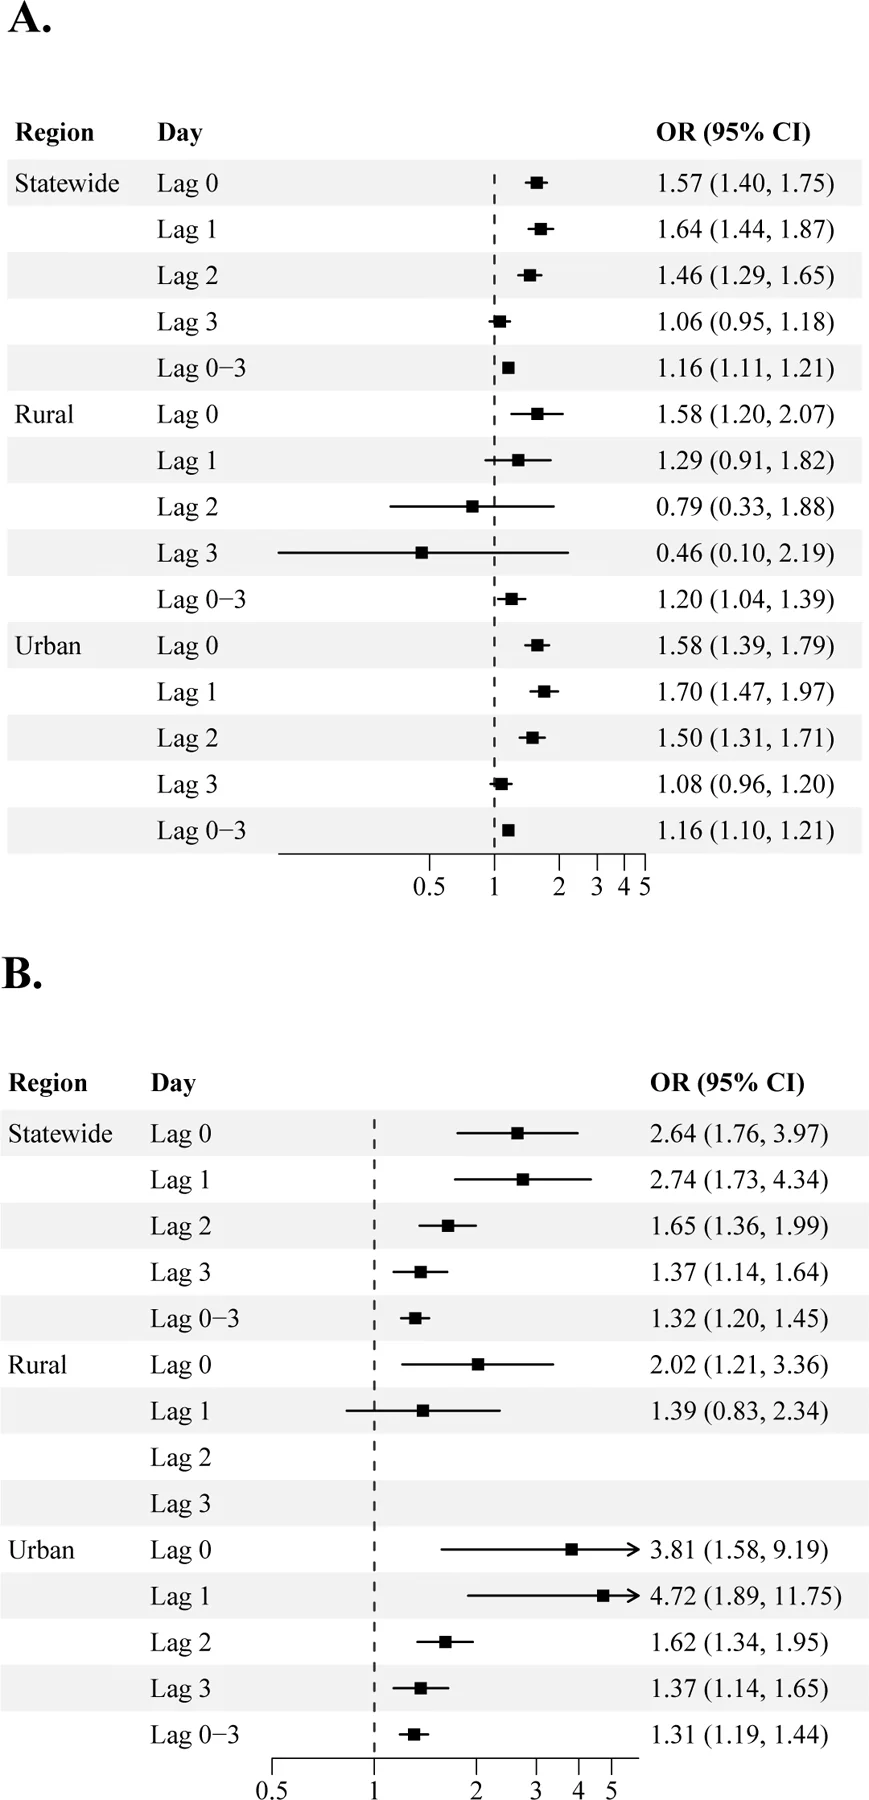
How much do outages raise the risk?
New York State recorded 917 CO emergency visits among children from 2017 to 2020, a rate of 5.6 per 100,000 person-years (Pediatrics, Jun 2025).
- CDC media tracking tied 136 deaths in nine states to Winter Storm Uri, and CO poisoning was behind 7.4% of the indirect ones (Disaster Medicine and Public Health Preparedness, Nov 2023).
- After Hurricane Irma, 16 of 129 deaths (12.4%) in Florida, Georgia and North Carolina were from CO poisoning (MMWR, Aug 2018).
What happened after Katrina and the 2004 Florida hurricanes?
Both events show the same pattern: generators set up near a house, and people poisoned while asleep.
- Hyperbaric oxygen centers in Alabama, Louisiana and Mississippi reported 51 CO cases after Hurricane Katrina in 2005, including 5 deaths (MMWR, Oct 2005).
- Improper generator placement caused 98% of those poisonings (MMWR, Oct 2005).
- 74.5% of the Katrina cases came in the first week (MMWR, Oct 2005).
- Among nonfatal Katrina cases, 28.6% of generators sat under a deck and 26.2% near a window (MMWR, Oct 2005).
- Four hurricanes in Florida in 2004 led to 167 nonfatal CO cases in 51 incidents, plus 6 deaths (MMWR, Jul 2005).
- 96.0% of the nonfatal incidents with a known source involved a gasoline generator (MMWR, Jul 2005).
- 66.5% of Florida patients reached an ER between 5 a.m. and 10 a.m., after waking with symptoms (MMWR, Jul 2005).
- The average carboxyhemoglobin level of those patients was 19.8%, and 46.1% got hyperbaric oxygen (MMWR, Jul 2005).
- 31.1% of the Florida patients were under age 16 (MMWR, Jul 2005).
Do generator owners know the risk?
Many do not. An estimated 29 million Americans own a portable generator, and 23% of owners did not know it can be a source of CO (UL Standards & Engagement, May 2024).
- 41% of generator owners are not concerned about CO exposure from their unit (UL Standards & Engagement, May 2024).
- 34% of owners did no research before buying (UL Standards & Engagement, Jan 2025).
CO Alarms and Laws: How Many Homes Are Protected?
Alarms are the last line of defense, and the data show gaps in who owns one, who trusts one and how well some of them work.
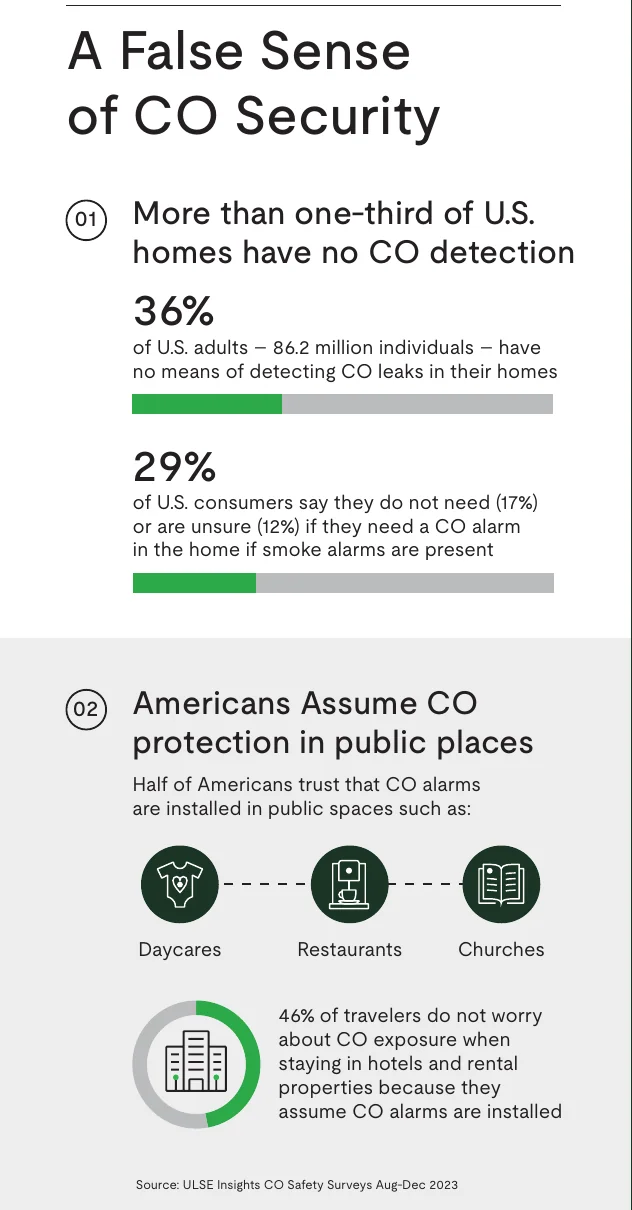
How many homes have a working CO alarm?
In 2009 only 36% of US homes reported a working CO detector (HUD, Jul 2010).
- In a 2023 survey, 29% of adults said they did not need a CO alarm if they had smoke alarms, or were unsure (UL Standards & Engagement, May 2024).
- One in ten had never replaced the battery in their CO alarm, and 17% thought an alarm never needs replacing (UL Standards & Engagement, May 2024).
- 64% of adults, an estimated 153.7 million, do not see CO as a risk to their household (UL Standards & Engagement, May 2024).
- 30% wrongly believe it is safe to run a car in a garage with the door open (UL Standards & Engagement, May 2024).
- CDC advises replacing a CO detector every 5 years or as the maker directs (CDC, Jan 2026).
Do CO alarms work as they should?
Sometimes not. A 2011 test of 30 alarms in use found that more than half failed to work properly, and 40% failed to sound at hazardous CO levels (American Journal of Public Health, Oct 2011).
- The same study counted more than 38 million residential CO detectors installed in the US (American Journal of Public Health, Oct 2011).
- Fire departments responded to 79,051 CO alarm malfunctions in 2023 (NFPA, Jan 2025).
- The UL 2034 standard requires an alarm to sound at 70 ppm or more within set times, and allows an optional pre-alarm between 30 and 70 ppm (CPSC, Sep 2026).
- A petition filed in December 2024 asks CPSC to require alarms that sound at 15 ppm over 30 days or 30 ppm over one hour (CPSC, Sep 2026).
- A draft standard that merges UL 2034 with Canada’s CSA 6.19 is due to go to its committees by the end of 2026 (CPSC, Sep 2026).
Do alarm laws and rules cut deaths?
The evidence is mixed. A national study found no sign that state laws requiring home CO alarms lowered deaths, even though over half of accidental deaths occurred at home (Clinical Toxicology, Jul 2023).
- Alarms still pay off on paper: the estimated benefit-to-cost ratio of home detectors is as high as 7.2 to 1 (American Journal of Emergency Medicine, Mar 2018).
- 44% of Americans believe every state requires CO alarms, and 46% of travelers assume hotels have them (UL Standards & Engagement, Jan 2025).
- New CO detection requirements for several occupancy types were being written into the 2024 editions of NFPA 101 and NFPA 5000 (NFPA Research Foundation, Oct 2022).
How Much Carbon Monoxide Is Too Much? Exposure Limits in PPM
Limits are written in parts per million, and they differ by who sets them. For techs who test flue gas and room air, these are the numbers to know.
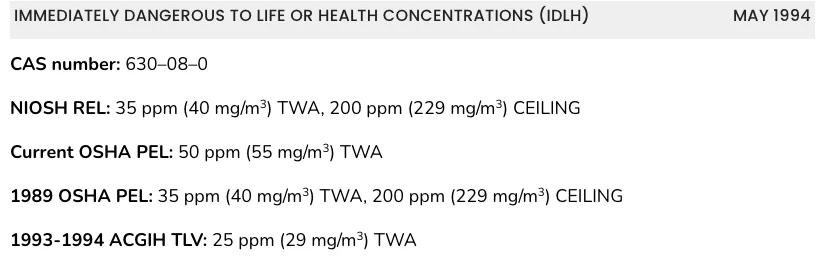
What are the workplace limits?
OSHA’s permissible exposure limit is 50 ppm as an 8-hour average (NIOSH, May 1994).
- NIOSH recommends 35 ppm as an 8-hour average, with a 200 ppm ceiling (NIOSH, May 1994).
- The ACGIH threshold listed in 1993 and 1994 was 25 ppm (NIOSH, May 1994).
- The level that is immediately dangerous to life or health is 1,200 ppm (NIOSH, May 1994).
- A 30-minute exposure at 1,200 ppm produces a carboxyhemoglobin level of 10% to 13% (NIOSH, May 1994).
What levels are normal in a home?
EPA says homes without gas stoves average 0.5 to 5 ppm, and levels near a well-adjusted gas stove are often 5 to 15 ppm (EPA, Oct 2026).
- Levels near a poorly adjusted stove can reach 30 ppm or more (EPA, Oct 2026).
- The outdoor air standard is 9 ppm over 8 hours and 35 ppm over 1 hour (EPA, Nov 2025).
- EPA notes that no CO standard has been agreed for indoor air (EPA, Oct 2026).
Other indoor pollutants are covered in indoor air quality statistics, and how homes are heated is in heating statistics.
Carbon Monoxide Statistics Around the World
The global trend is good news that the US has not shared. Deaths fell by half worldwide while North America moved the other way.
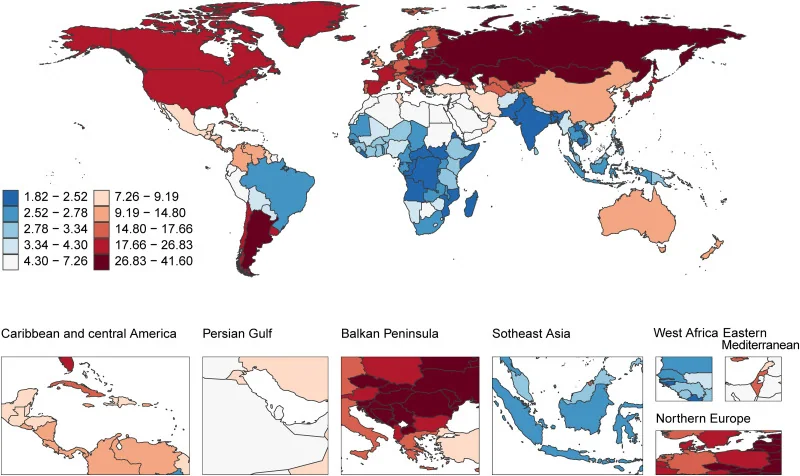
How many people die from CO worldwide?
The global death rate from unintentional CO poisoning was 0.366 per 100,000 people in 2021 (Lancet Public Health, Nov 2023).
- The age-standardized death rate fell 53.5% between 2000 and 2021 (Lancet Public Health, Nov 2023).
- Nearly 70% of deaths were in men, and people aged 85 and older had the highest rate, 1.96 per 100,000 (Lancet Public Health, Nov 2023).
- Eastern Europe had the highest regional rate, 2.12 per 100,000 (Lancet Public Health, Nov 2023).
- High-income North America ended 2021 at an age-standardized 0.314 per 100,000, up from 2000 (Lancet Public Health, Nov 2023).
- Occupational injuries account for 13.6% of CO deaths worldwide (Lancet Public Health, Nov 2023).
How fast is the CO burden changing by country?
World incidence of CO poisoning fell 35.1% between 1990 and 2021, from 12.13 to 7.87 per 100,000 (PLOS One, Aug 2025).
- Eastern Europe had the highest burden, at 37.98 per 100,000 in 2021 (PLOS One, Aug 2025).
- Men’s death rate was 0.50 per 100,000 against 0.20 for women (PLOS One, Aug 2025).
- Burden peaks at mid-level development, an index score of 0.6 to 0.7, which the authors link to more fossil fuel use without matching safety rules (PLOS One, Aug 2025).
What do Canada and the UK report?
Canada estimates about 300 CO deaths and 200 hospitalizations a year (Public Health Agency of Canada, Aug 2023).
- Canadian ER records from 2011 to mid-2023 show 767 unintentional CO events, and children aged 0 to 4 were 24.3% of them (Public Health Agency of Canada, Aug 2023).
- 63.6% of those Canadian cases happened in fall or winter, and 10.6% were work-related (Public Health Agency of Canada, Aug 2023).
- 6.5% of Canadian cases were admitted to hospital (Public Health Agency of Canada, Aug 2023).
- About 20 people die each year in England and Wales from unintentional CO poisoning (UK Health Security Agency, Nov 2025).
- In England, 68% of CO deaths occur in autumn and winter (UK Health Security Agency, Nov 2025).
- A UK study of 4,175 ER patients with CO-type symptoms found suspected CO exposure in 0.62% (Journal of Public Health, Jan 2023).
Glossary
- CO: carbon monoxide, a gas made when fuel burns without enough air.
- COHb: carboxyhemoglobin, the form of blood hemoglobin that carries CO instead of oxygen.
- CPSC: the US Consumer Product Safety Commission.
- EDT: engine-driven tool, such as a generator, pressure washer or lawn mower.
- ACGIH: the American Conference of Governmental Industrial Hygienists.
- IDLH: immediately dangerous to life or health, the NIOSH level that can cause lasting harm or death.
- NIOSH: the National Institute for Occupational Safety and Health.
- OSHA PEL: the permissible exposure limit set by the US Occupational Safety and Health Administration.
- ppm: parts per million, the unit used for CO in air.
- HBO: hyperbaric oxygen, oxygen given in a pressure chamber.
- ICD-10: the coding system used on death certificates since 1999.
Methodology and Sources
We chose each number from the agency, journal or standards body that first published it, and we opened every link to confirm the number and the date. We did not use roundup pages. Where two sources measure different things, such as all CO deaths versus consumer product deaths, we kept them apart and said so. Estimates for the newest years are often incomplete, and the page says when that is the case. We review the page every month and add new releases as they appear.
Sources
- American Journal of Emergency Medicine
- American Journal of Public Health
- Annals of Emergency Medicine
- CDC
- CDC Health Alert Network
- Clinical Toxicology
- CPSC
- CPSC
- CPSC
- CPSC
- CPSC
- Disaster Medicine and Public Health Preparedness
- EPA
- EPA
- HUD
- JAMA
- Journal of Public Health
- Journal of Public Health
- Lancet Public Health
- Lancet Public Health
- MMWR
- MMWR
- MMWR
- MMWR
- MMWR
- New England Journal of Medicine
- NFPA
- NFPA Research Foundation
- NIOSH
- Pediatrics
- PLOS One
- Public Health Agency of Canada
- Public Health Reports
- Texas DSHS
- UK Health Security Agency
- UL Standards & Engagement
- UL Standards & Engagement
- UL Standards & Engagement
- US Coast Guard