Building electrification retrofit statistics show a gap between what rules ask for and what an old house can take. Fuel burned on site is the part of building emissions that electric heat removes. The switch still means new equipment, often new wiring, and a grid that starts to peak in winter.
This page collects dated figures from government agencies, national laboratories, grid operators, the International Energy Agency, the United Nations and peer-reviewed journals. Every number links to the document that produced it. It covers U.S. homes and commercial buildings first, then the UK, Germany and the EU.
Use it to price a job, to explain a quote to a customer, or to check a claim before you repeat it. Each stat appears once, so scan the headings for the question you need. For the wider picture of home energy use, see the HVAC energy consumption statistics page. The figures are refreshed every month.
Key Takeaways
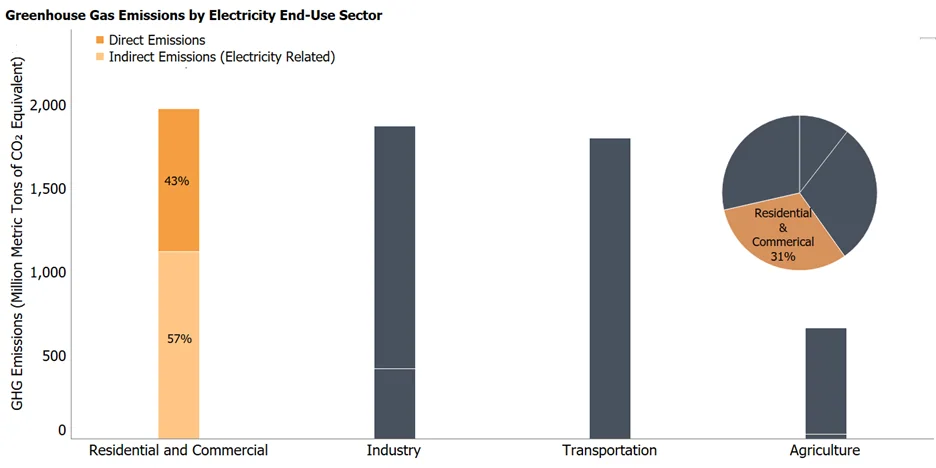
- Homes and businesses caused 31% of U.S. greenhouse gas emissions in 2022 when electricity use is counted (EPA, Mar 2026).
- Operational emissions from buildings grew 6.5% from 2015 to 2024, when a path to net zero in 2050 needed a 31.6% fall (UNEP, May 2026).
- The Second Circuit affirmed in June 2026 that New York City and New York State can bar gas in new buildings, which sets up a split with the Ninth Circuit (Congressional Research Service, Jul 2026).
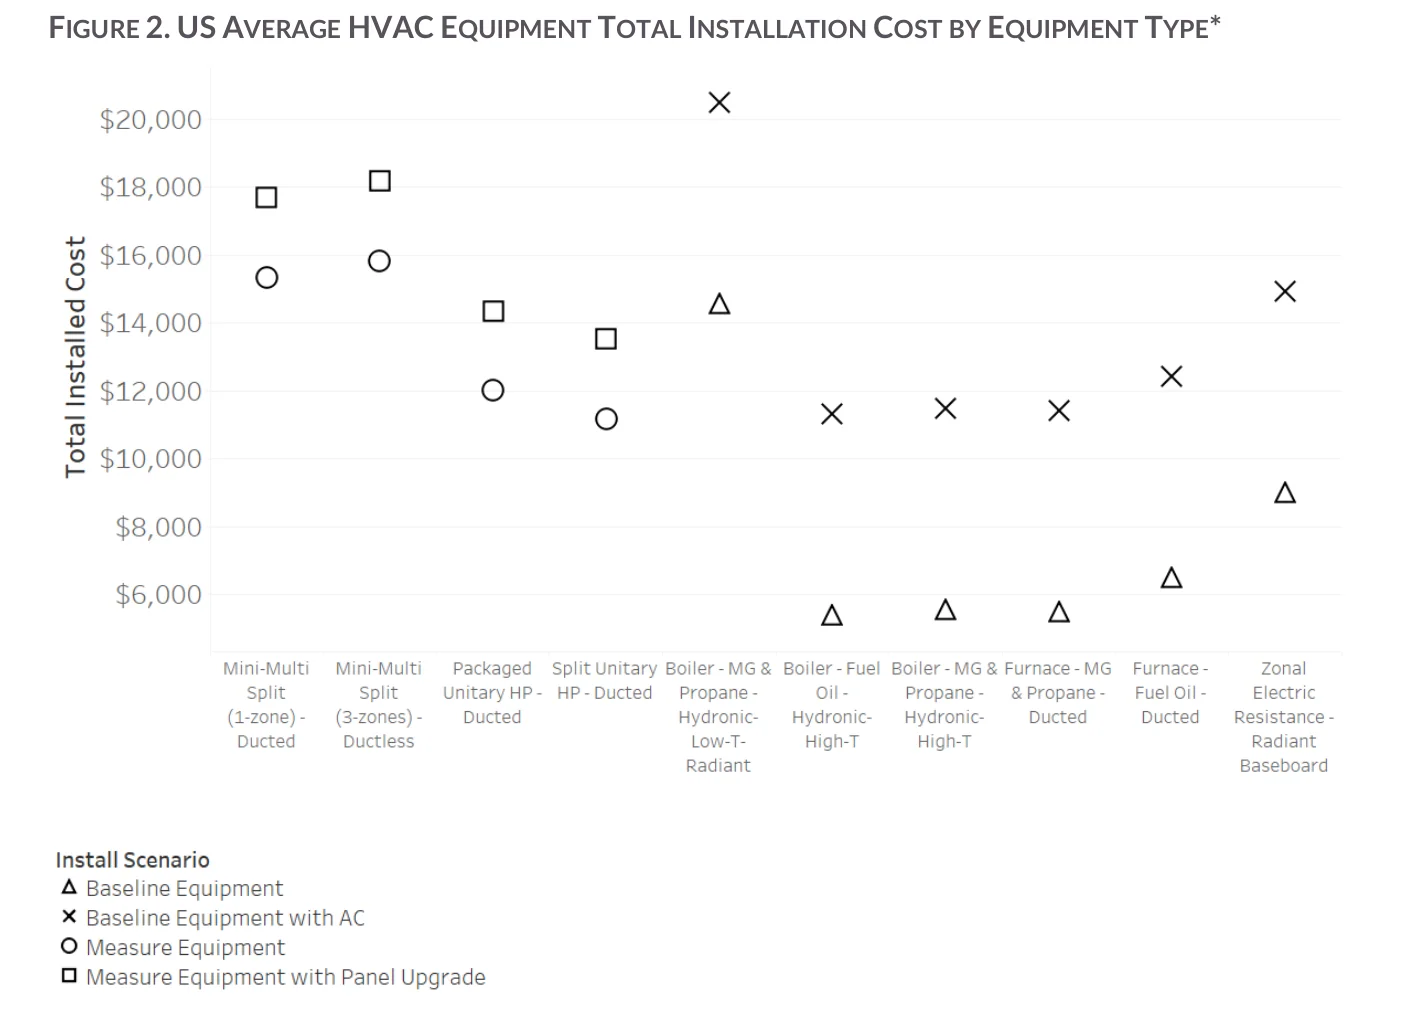
- A whole-home air-source heat pump costs $12,000 to $23,000 installed in the Northeast and Mid-Atlantic, against $10,000 to $13,000 for a fossil fuel system with air conditioning (NESCAUM, Oct 2024).
- About 21% of U.S. homes have a 100-amp panel or smaller, and 44% have two or fewer open breaker slots (U.S. DOE, Jul 2023).
- Replacing the main service panel in a single-family home cost a median of $3,500 in a 2025 survey of building professionals (Lawrence Berkeley National Laboratory, Aug 2026).
- Air-to-air heat pumps could be cost effective without subsidies in 59% of U.S. households, or 65 million homes (Joule, Apr 2024).
- Replacing a gas furnace with a heat pump cuts CO2 by 38% to 53% over 15 years, on average across the U.S. (Energy Policy, Apr 2022).
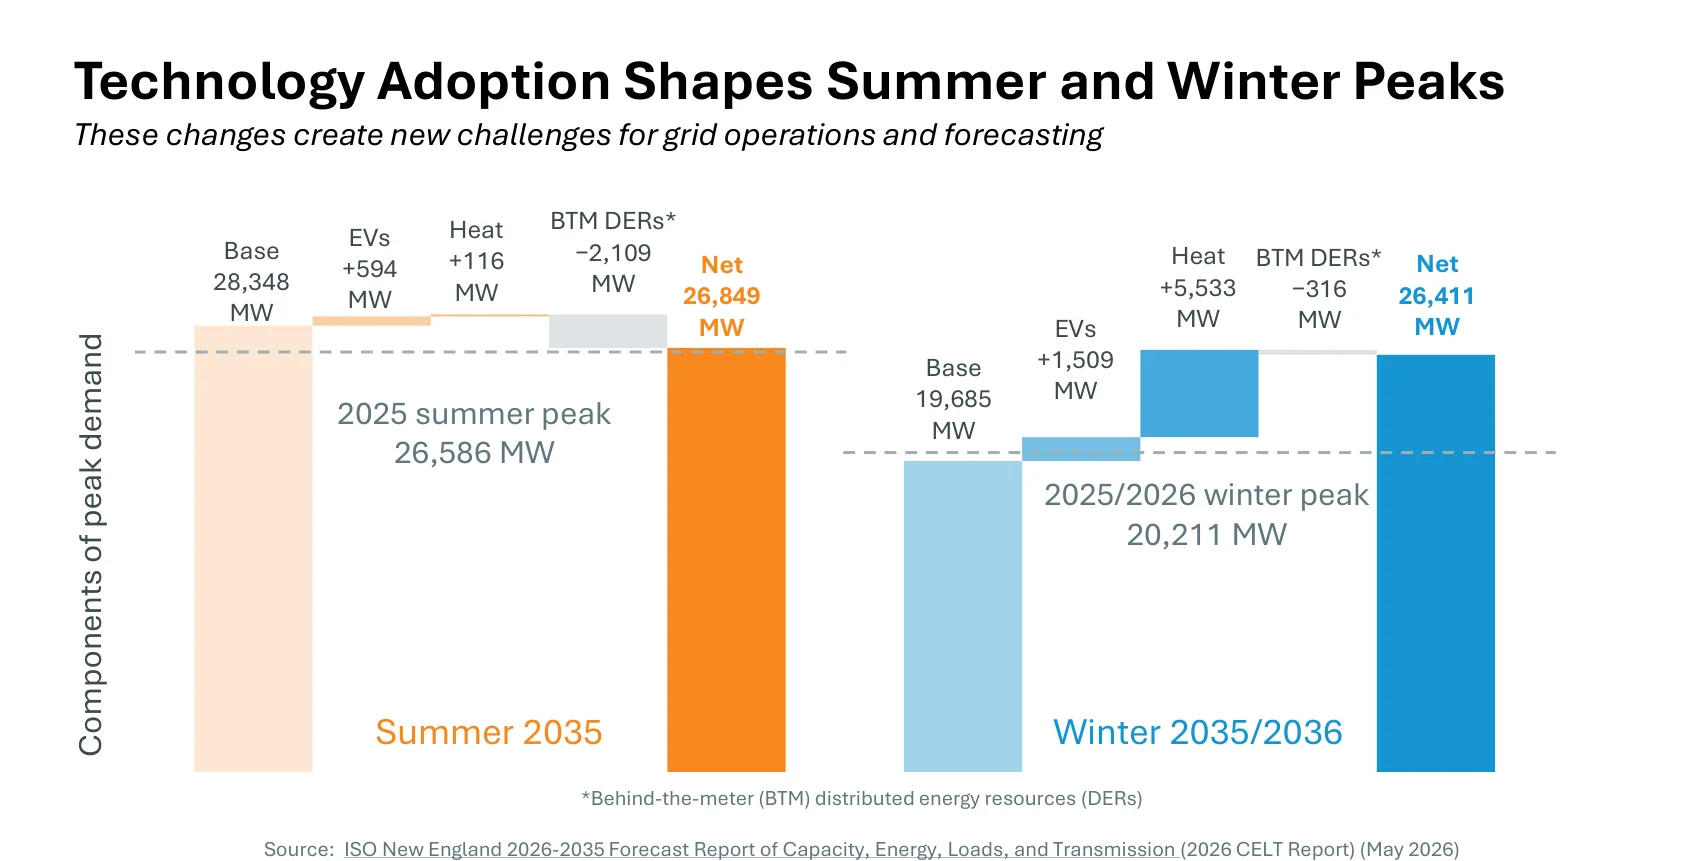
- By winter 2035/36, heat pumps add 5,533 MW to New England’s peak demand, against 116 MW added to the summer peak (ISO New England, Jun 2026).
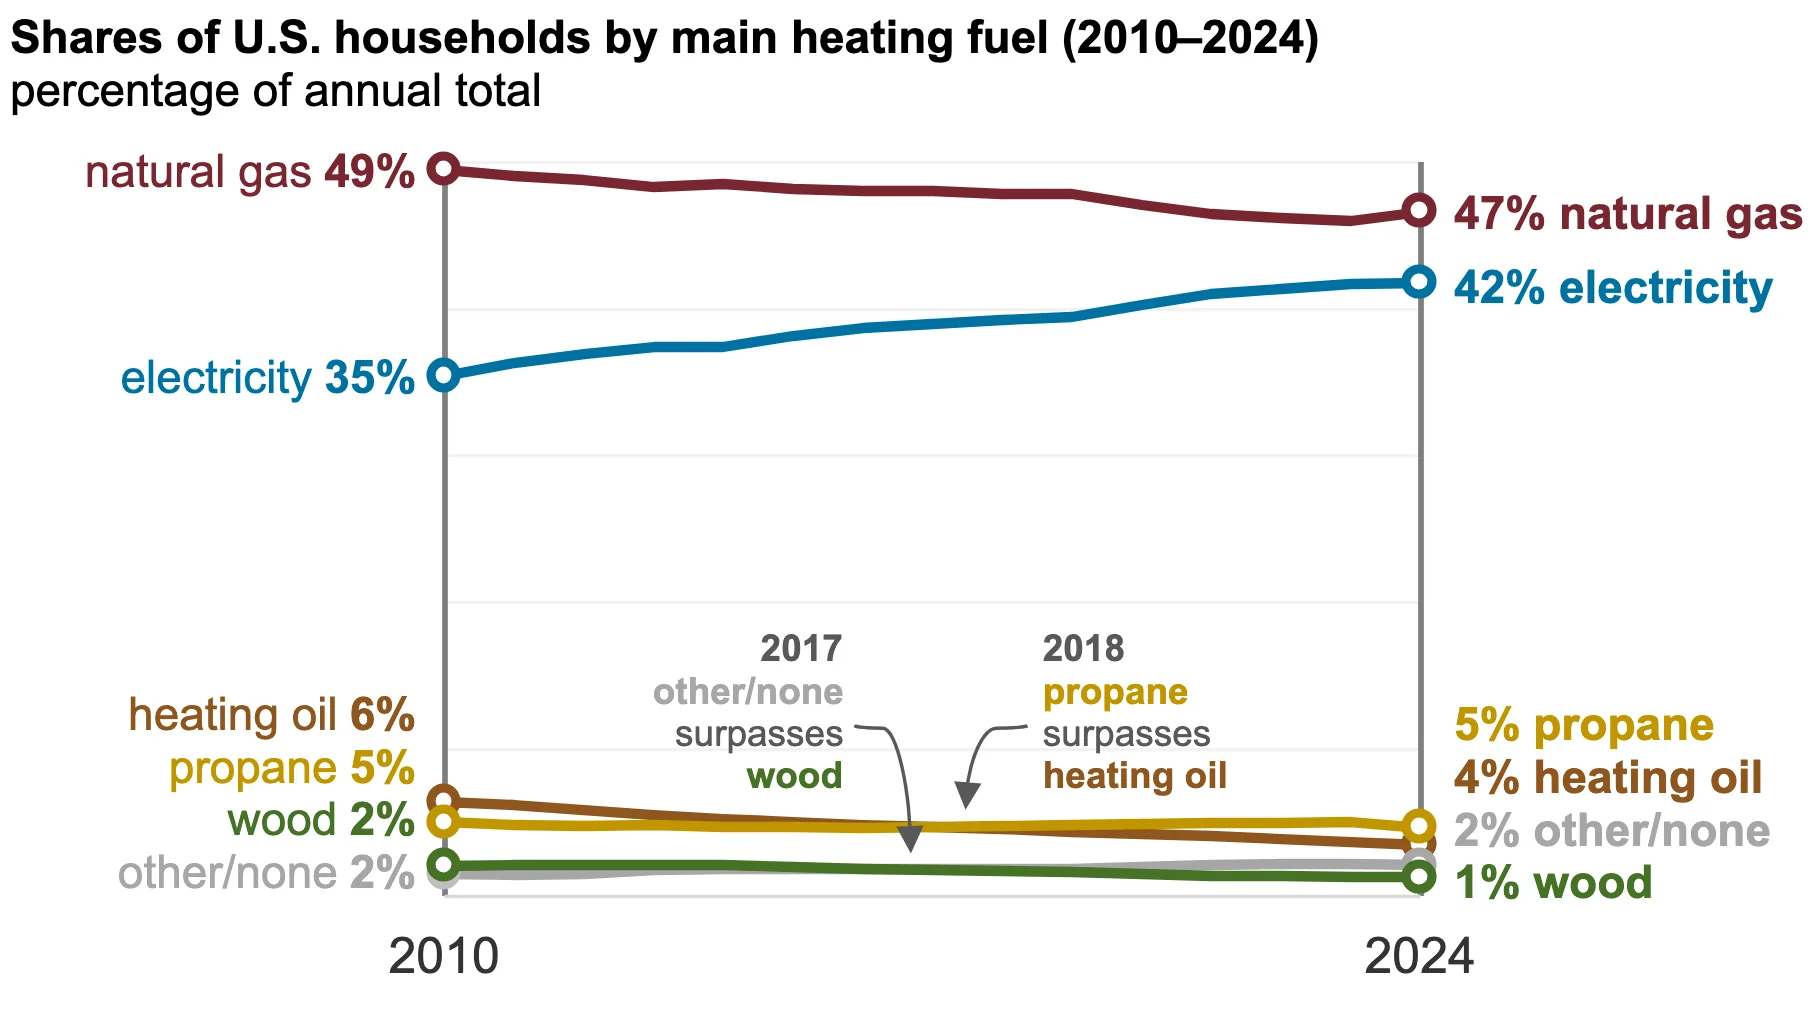
- In 2024, 42% of U.S. households named electricity as their main heating fuel (EIA, Oct 2025).
- Heat pumps were the main heating system in 73.6% of the homes finished in Germany in 2025 (Destatis, Jun 2026).
- Households that stay on gas could see their gas bills rise 46% on average over 15 years as the customer base shrinks (Scientific Reports, Jul 2025).
- Spending $100 on electricity for a heat pump gives 42 days of heating, against 30 days from $100 of fuel in a gas boiler (IEA, Sep 2026).
How much do buildings add to climate emissions?
Fuel burned inside buildings is a direct, local source of emissions, and it is the part that electric equipment removes. The rest comes from the power plants that supply buildings with electricity.
What do buildings add worldwide?
- Renewables supplied about 17% of the energy used in buildings in 2024, and the net-zero path needs 46% by 2030 (UNEP, May 2026).
- Electricity demand in buildings rose 26%, from 39 EJ in 2015 to 49 EJ in 2024 (UNEP, May 2026).
- Electricity was about 33% of final energy use in buildings in advanced economies, against about 23% in emerging and developing ones (UNEP, May 2026).
- On-site renewables, mostly rooftop solar, stayed near 5% of the energy supplied to buildings (UNEP, May 2026).
- In 2025, 40% of residential energy demand in Europe was for gas (UNEP, May 2026).
What do buildings add in the United States?
- Fuel burned in homes and businesses caused 13% of all U.S. greenhouse gas emissions in 2022 (EPA, Mar 2026).
- Natural gas made up 78% of the direct fossil fuel CO2 from homes and businesses in 2022 (EPA, Mar 2026).
- Direct emissions from homes and businesses were 8% higher in 2022 than in 1990 (EPA, Mar 2026).
- Direct CO2 from homes rose 9%, or 27 million metric tons, in 2025, and from commercial buildings 7%, or 17 million metric tons, as winters turned colder (EIA, Jul 2026).
Which fuels do U.S. homes use?
- 61% of U.S. households used natural gas for at least one purpose in 2020 (EIA, Mar 2023).
- Another 12% of households had gas access and did not use it (EIA, Mar 2023).
- 38% of U.S. households cooked with gas in 2020, including 70% in California and 69% in New Jersey (EIA, Aug 2022).
- Homes and businesses use nearly 70% of California’s electricity and cause 25% of its greenhouse gas emissions (California Energy Commission, Sep 2024).
Which rules limit gas in new buildings?
The legal fight over gas in new buildings is not settled. The Ninth Circuit ruled one way in 2023 and the Second Circuit ruled the other way in 2026, while codes in California, New York and the EU keep moving toward all-electric new construction.
Where do the courts stand?
- The Ninth Circuit held that federal law preempts Berkeley’s ban on natural gas piping in new buildings (U.S. Court of Appeals for the Ninth Circuit, Apr 2023).
- In 2025, federal district courts rejected challenges to New York City’s Local Law 154 and to a similar New York State law (Congressional Research Service, Jul 2026).
- The Justice Department sued Morgan Hill and Petaluma, California, in January 2026 and the case ended in March after both cities amended or withdrew their ordinances (Congressional Research Service, Jul 2026).
- Montgomery County, Maryland, adopted a law effective at the end of 2026 that bars equipment using fuel gas or fuel oil in new construction and major renovations (Congressional Research Service, Jul 2026).
- A 2022 Massachusetts law lets up to 10 municipalities require fossil-fuel-free new construction under a state pilot (Congressional Research Service, Jul 2026).
What do state and city codes require?
- Local Law 154 bars onsite combustion of fuels that emit more than 25 kg of CO2 per MMBtu in new construction (NYC Department of Buildings, Oct 2026).
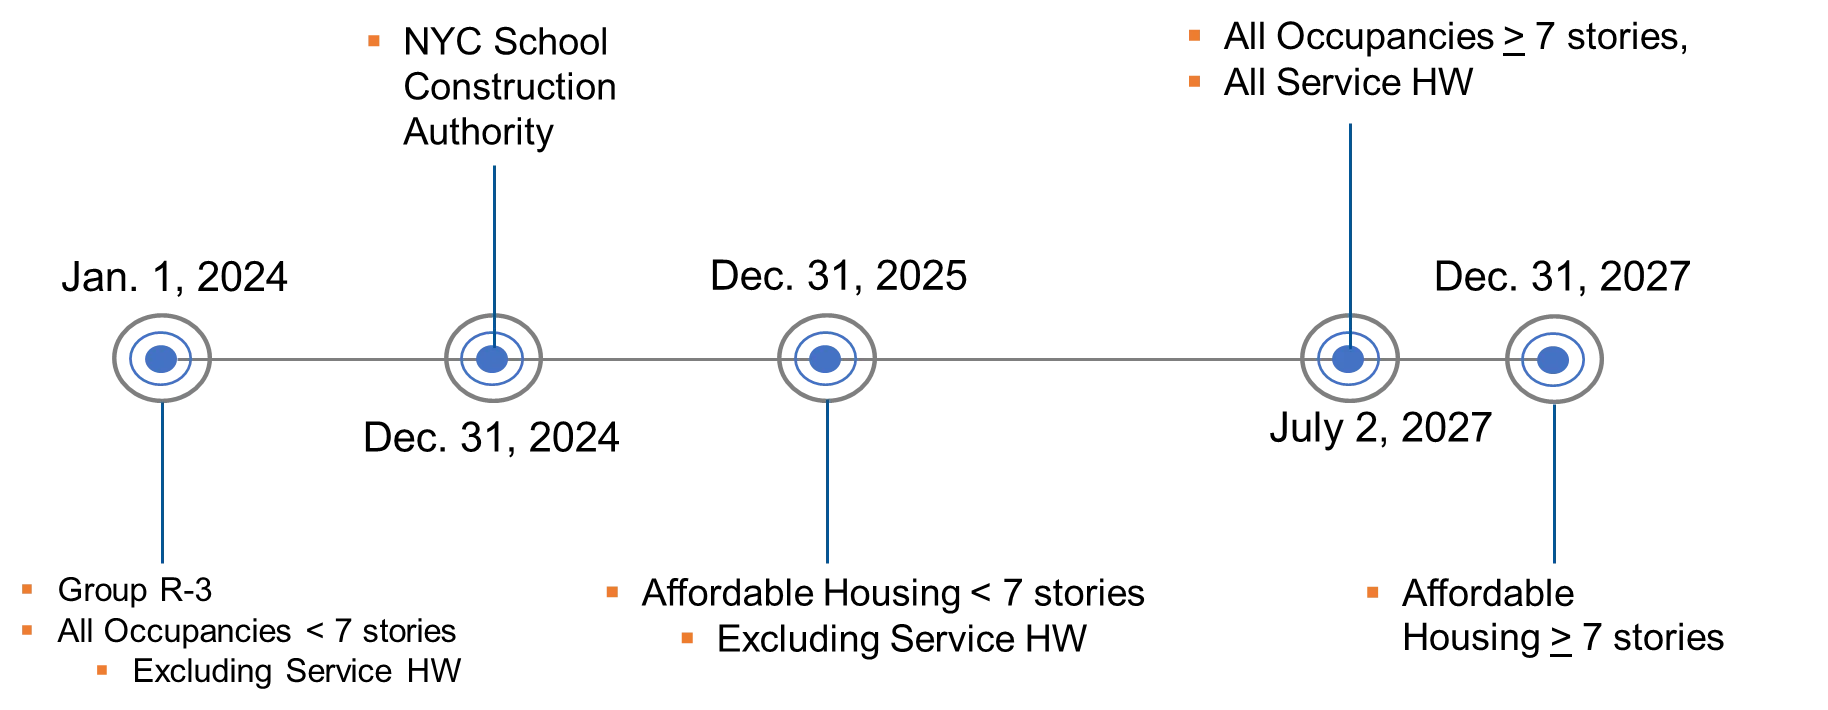
- New York State bars fossil fuel equipment, with some exceptions, in new buildings of up to seven stories when the permit application comes in on or after 31 December 2025, and in other new buildings after 31 December 2028 (New York Department of State, Jul 2024).
- Local building departments in California began enforcing the 2025 Energy Code on 1 January 2026 (California Energy Commission, Sep 2024).
- The code sets heat pumps for both space heating and water heating as the baseline for new homes (California Energy Commission, Sep 2024).
- The Bay Area air district adopted zero-NOx rules for new furnaces and water heaters in March 2023 (Bay Area Air Quality Management District, Oct 2026).
- Compliance starts on 1 January 2027 for water heaters under 75,000 BTU/h and on 1 January 2029 for furnaces (Bay Area Air Quality Management District, Oct 2026).
What do Europe and the UK require?
- All new EU buildings must be zero-emission buildings from 2028 if public bodies own them and from 2030 for all others (European Commission, May 2024).
- From 1 January 2025, EU member states may not give financial incentives for stand-alone fossil fuel boilers (EUR-Lex, Apr 2024).
- The UK Future Homes Standard came into effect and aims to cut carbon emissions from new buildings by around 75% (UNEP, May 2026).
- Building energy codes covered about 60% of new construction worldwide by mid-2025 (UNEP, May 2026).
What does it cost to switch a home to electric heat?
A heat pump costs more to install than a furnace across the Northeast and Mid-Atlantic, and the gap grows when ducts or the panel need work. Labor, not equipment, explains most of the difference between states.
What do the systems cost installed?
- On a U.S.-average basis, a split unitary heat pump cost $11,179 installed without a panel upgrade and $13,530 with one, counting a new distribution system (NESCAUM, Oct 2024).
- A gas furnace with central air conditioning cost $11,416, and a gas furnace alone cost $5,494 (NESCAUM, Oct 2024).
- The lowest heat pump price in the study was $9,400, for a split unitary system where no panel upgrade or ductwork was needed (NESCAUM, Oct 2024).
- New or replaced ductwork added about $4,500 in material cost to a heat pump install (NESCAUM, Oct 2024).
- Electrical work such as new panels and circuits added an average of $2,400 (NESCAUM, Oct 2024).
- Labor cost indexes ran from 72.2% of the U.S. average in Virginia to 161.4% in New York (NESCAUM, Oct 2024).
- Equipment cost indexes stayed within 97.7% (Vermont) and 101.5% (Delaware) of the U.S. average (NESCAUM, Oct 2024).
- Air-to-water heat pumps, common in Europe and rare in the U.S., cost about $50,000 installed (NESCAUM, Oct 2024).
Cost follows the size of the system, and the size follows the heat loss of the house. The heat pump sizing calculator gives a first estimate.
Can the electrical panel in an older home take the load?
Panel work is the hidden line on many retrofit quotes. Most homes have room, but a large minority do not, and the fix has a wide price range.

How many homes lack panel room?
- 100-amp and 200-amp panels each made up 41% of homes in a 2026 laboratory analysis, and panels under 100 amps made up 2% (Journal of Building Engineering, Feb 2026).
- In homes built in the 2010s, 77% have a 200-amp panel and 13% have a 100-amp panel (Journal of Building Engineering, Feb 2026).
- The share of 100-amp panels is 33% in the lowest-income homes and 25% in the highest-income homes (Journal of Building Engineering, Feb 2026).
- 36% of Midwest homes have a 100-amp panel, against 19% of homes in the South (Journal of Building Engineering, Feb 2026).
- Of homes with 200-amp panels, 48% have five or more major electric end uses, against 28% of homes with 100-amp panels (Journal of Building Engineering, Feb 2026).
What do the upgrades cost?
- Rewiring a single-family home cost a median of $5,000 (Lawrence Berkeley National Laboratory, Aug 2026).
- Utility-side costs passed on for a higher service rating had a median of $3,500 for single-family homes, and customer-side equipment a median of $2,800 (Lawrence Berkeley National Laboratory, Aug 2026).
- Replacing a subpanel cost a median of $1,500 per single-family home (Lawrence Berkeley National Laboratory, Aug 2026).
- The survey reached 140 stakeholders in 34 states, and most single-family projects finished within 30 days (Lawrence Berkeley National Laboratory, Aug 2026).
- Panel and service upgrades can cost a customer $2,000 to $30,000 and take months (U.S. DOE, Jul 2023).
- Each new circuit costs $250 to $750, and a pad-mounted or subsurface utility transformer costs $10,000 to $80,000 (Lawrence Berkeley National Laboratory, Apr 2025).
- Replacing every 100-amp panel would cost a very rough $250 billion nationally, and each upgrade can delay a project by 3 to 6 months (Lawrence Berkeley National Laboratory, Apr 2024).
The panel rating has to cover the new load, and the heat pump’s load comes from the heat loss of the house. The BTU calculator shows that load for a room or a whole home.
What help pays for the switch?
U.S. federal support for home electrification shrank at the end of 2025, while the UK raised its grant. The UK numbers show how much a bigger grant moves demand.
What changed in U.S. federal help?
- The Joint Committee on Taxation projects that repealing the residential clean energy credit, which paid 30% of geothermal heat pump costs, cuts deficits by $77.4 billion through fiscal 2034 (Congressional Research Service, Dec 2025).
- It projects $21.2 billion in savings from repealing the energy efficient home improvement credit (Congressional Research Service, Dec 2025).
- The home improvement credit also covered improvements to panelboards, subpanelboards, branch circuits and feeders (IRS, Dec 2025).
- Between June and December 2024, nine more states and the District of Columbia launched Home Energy Rebates programs (U.S. DOE, Dec 2024).
- ISO New England cut its 2026 electrification forecasts, citing reduced federal policy support, and its 2035 net energy forecast is 4.5% below last year’s forecast (ISO New England, Mar 2026).
How do the UK grants work?
- The UK pays £7,500 toward an air source or ground source heat pump and £2,500 toward an air-to-air heat pump (GOV.UK, Oct 2026).
- Until March 2027 homes heated by oil or LPG with no mains gas get an extra £1,500 (GOV.UK, Oct 2026).
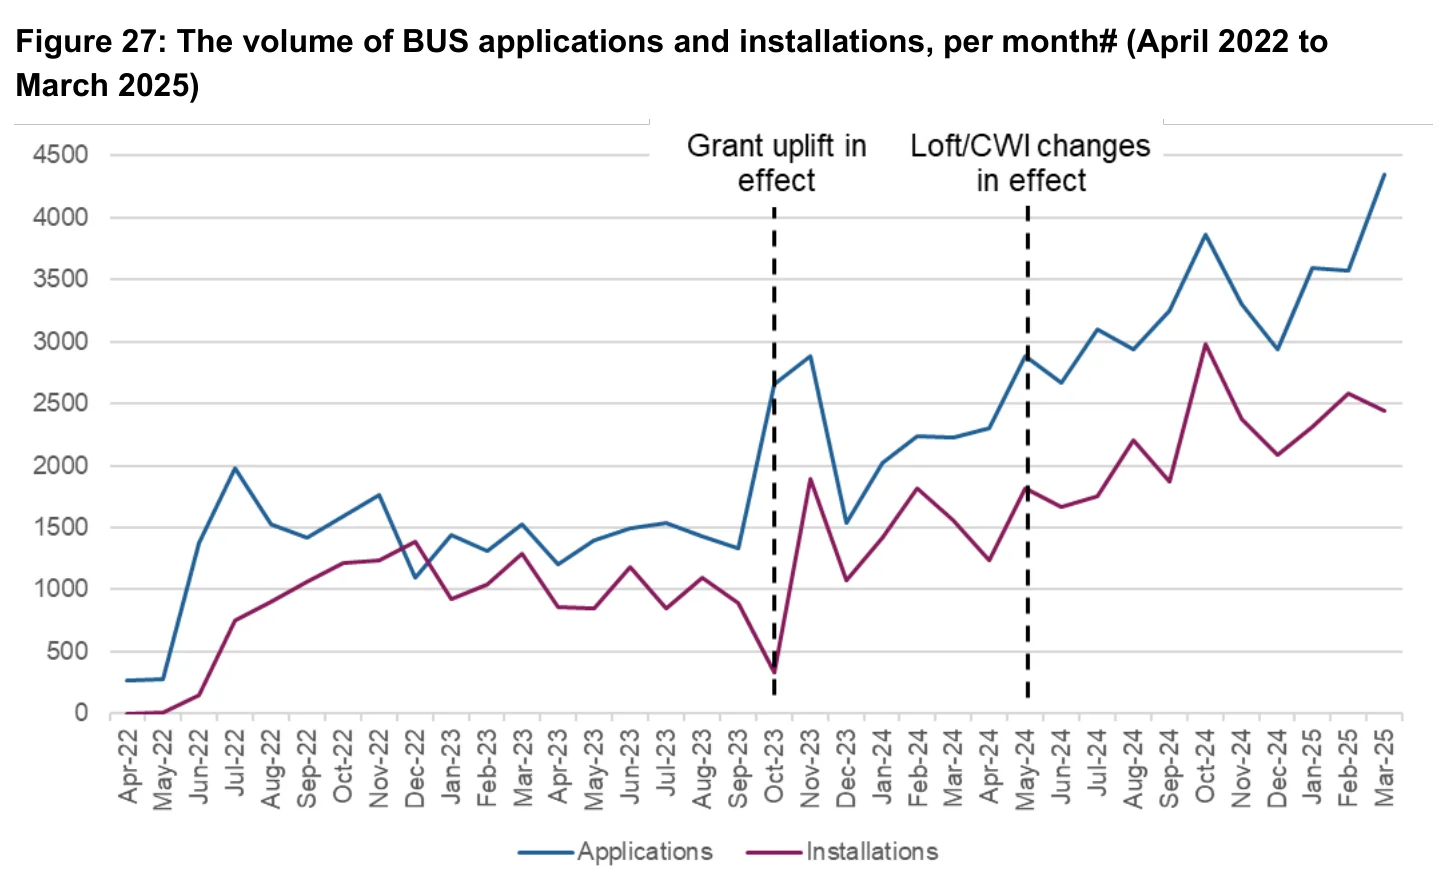
- Applications in February 2024 were 75% above February 2023, after the grant rose to £7,500 (GOV.UK, Mar 2024).
- Monthly applications from November 2023 to February 2024 averaged 45% above the level before the increase (GOV.UK, Mar 2024).
- From April 2022 to March 2025 the scheme awarded £328.2 million in grants and supported 49,136 installations (UK DESNZ, Sep 2026).
- That compared with a budget of £450 million, which could have supported up to 90,000 installations (UK DESNZ, Sep 2026).
- 74% of grant-funded installations were additional, meaning the grant made them happen or happen sooner, and the share rose from 69% to 79% after the grant increase (UK DESNZ, Sep 2026).
- 75% of the 65,500 vouchers issued had led to an installation by the end of March 2025 (UK DESNZ, Sep 2026).
- The Warm Homes Plan commits £15 billion of public money to upgrade up to 5 million homes by 2030 (UK DESNZ, Jan 2026).
- It targets over 450,000 heat pump installations a year by 2030 (UK DESNZ, Jan 2026).
Do bills and emissions go down after the switch?
Bills fall for most homes that replace oil, propane or electric baseboard, and they can rise for homes that leave cheap gas. Emissions fall in every state studied.
What do electricity and gas cost?
- The U.S. residential electricity price averaged 17.3 cents per kWh in 2025 (EIA, Oct 2026).
- EIA expects 18.2 cents in 2026 and 18.7 cents in 2027 (EIA, Oct 2026).
- Residential natural gas averaged $15.34 per thousand cubic feet in 2025 (EIA, Sep 2026).
- Heat pumps can cut bills where electricity and gas prices are close, and can raise them where electricity costs more than three times as much as gas (IEA, Feb 2026).
Did bills fall after a heat pump?
- Replacing electric baseboard heat with a heat pump saved $1,200 to $7,000 a year in the Northeast and Mid-Atlantic (NESCAUM, Oct 2024).
- Switching from fuel oil or propane saved about $1,100 a year on average (NESCAUM, Oct 2024).
- Switching from gas raised annual operating costs by about $90 in Delaware and up to $1,200 in New Hampshire (NESCAUM, Oct 2024).
- In DC, Maryland, Pennsylvania and Virginia, the same switch saved $50 to $400 a year (NESCAUM, Oct 2024).
- Minimum-efficiency heat pumps could raise bills in 39% of U.S. households, a share that falls to 19% with insulation upgrades and 5% with higher-efficiency equipment (Joule, Apr 2024).
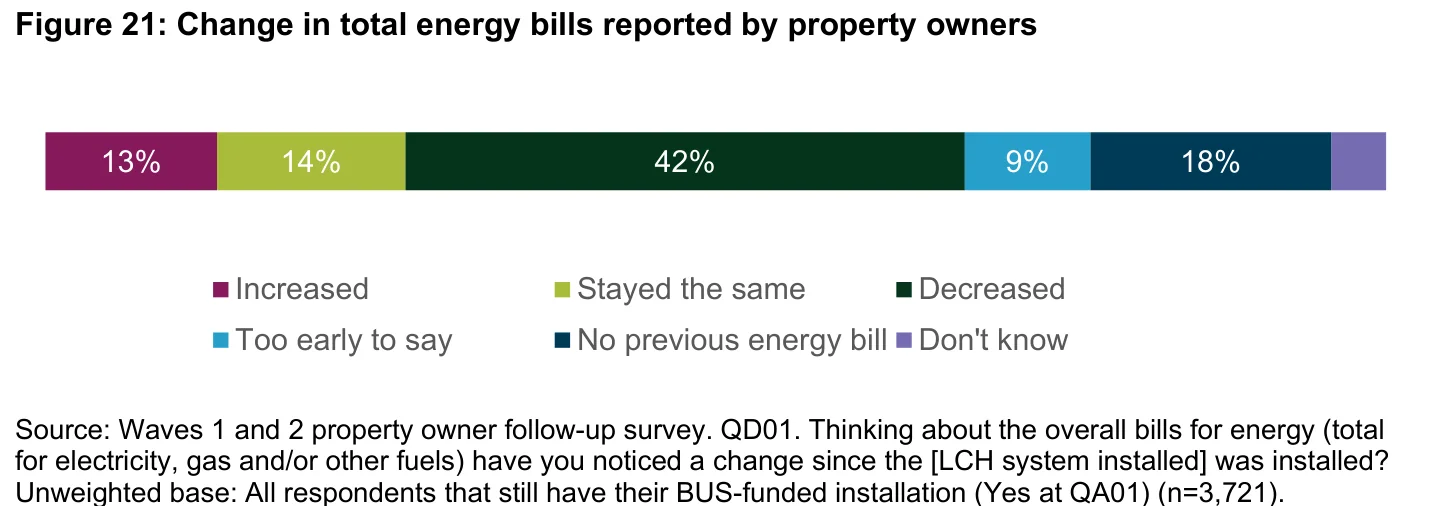
- Among UK owners able to compare, 61% reported lower bills, 20% no change and 19% higher bills (UK DESNZ, Sep 2026).
- Owners who replaced direct electric heating (57%) or a gas boiler (52%) were more likely to report lower bills than those who replaced an oil boiler (38%) (UK DESNZ, Sep 2026).
What happens to the households that stay on gas?
- In Massachusetts, the share of gas heating customers who are energy burdened could rise from 26% to 34% by 2041 if high-income households leave first (Scientific Reports, Jul 2025).
How much do emissions fall?
- Full adoption of air-to-air heat pumps would cut national emissions by 5% to 9%, with cuts in every U.S. state (Joule, Apr 2024).
- Counting leaked methane and refrigerant, a heat pump cuts 100-year warming impact by 44% to 60% against a gas furnace (Energy Policy, Apr 2022).
- Over 20 years, the cut in warming impact is 53% to 67% (Energy Policy, Apr 2022).
- Switching Texas homes to standard-efficiency heat pumps would cut residential CO2 by 4.1% and NOx by 5.8% (Applied Energy, Sep 2021).
What does switching do to the electric grid?
Electric heat moves the yearly peak from summer to winter. New England and New York already plan for that shift, and national operators list it next to data centers as a driver of load growth.
What do grid operators forecast?
- ISO New England expects its typical winter peak to rise from 20,483 MW in 2026/27 to 26,411 MW in 2035/36 (ISO New England, Jun 2026).
- Heating electrification adds 198 GWh to New England’s energy use in 2026 and 7,165 GWh by 2035 (ISO New England, Mar 2026).
- By 2034 the extreme-weather winter peak forecast exceeds the typical summer peak, and by the late 2030s winter becomes the main peak season (ISO New England, Jun 2026).
- New York’s winter peaks are rising faster than its summer peaks as heating electrifies, which moves the state toward a winter-peaking system (NYISO, Jun 2026).
- NYISO expects summer peak growth to stay small, largely because electric air conditioning is already common (NYISO, Jun 2026).
- NERC expects several areas, including the Southeast and Northeast, to become dual-peaking or winter-peaking as heating and vehicles electrify (NERC, Jan 2026).
- PJM expects its winter peak to climb by 62 GW to 198 GW by winter 2034/35 (NERC, Jan 2026).
- PJM’s annual energy growth is projected at 4.8% a year, up from 2.3% in the last forecast, driven mainly by data centers and then by electrification and manufacturing (NERC, Jan 2026).
What do studies find for a full switch?
- Switching every gas furnace in the ERCOT region to a heat pump could lift the residential winter peak by up to 36%, or 12 GW (Applied Energy, Sep 2021).
- That study found grid capacity would need to grow by 10 GW, or 25% for the residential sector (Applied Energy, Sep 2021).
- In the IEA’s high electrification case, heat pumps and electric vehicles draw about 450 GW on average in 2035 but about 900 GW at peak (IEA, Sep 2026).
How much of demand growth comes from buildings?
- Buildings are expected to supply 49% of the extra electricity demand worldwide from 2025 to 2030 (IEA, Feb 2026).
- U.S. electricity demand grew 2.1% in 2025 after 2.8% in 2024, and buildings were over 70% of the growth (IEA, Feb 2026).
- Space cooling, data centers and heat pumps make up almost half of the buildings growth to 2030 (IEA, Feb 2026).
How fast are homes and new buildings switching?
The switch is slow in the existing U.S. stock and fast in new construction in Germany. Where a rule or a grant is in place, the numbers move quickly.
What share of U.S. homes heat with electricity?
- Natural gas was the main heating fuel in 47% of U.S. homes in 2024, down from 49% in 2010 (EIA, Oct 2025).
How fast is Germany switching?
- Heat pumps were the main heat source in 69.4% of homes finished in 2024 and in 31.4% of those finished in 2015 (Destatis, Jun 2026).
- Gas was the main heat source in 10.5% of new homes finished in 2025, down from 15.0% in 2024 and 51.5% in 2015 (Destatis, Jun 2026).
- Heat pumps are planned as the main heat source in 83.0% of the homes permitted in 2025, and gas in 2.2% (Destatis, Jun 2026).
- The older stock looks different: 53.9% of existing buildings with housing were heated with gas and 24.7% with heating oil in the 2022 census (Destatis, Jun 2026).
Is heating getting cleaner across Europe?
- Renewables supplied 26.7% of EU heating and cooling in 2024, up from 11.7% in 2004 (Eurostat, Jan 2026).
- The EU average gain was 0.93 percentage points a year from 2021 to 2024, against a legal minimum of 0.8 points a year to 2025 and 1.1 points a year from 2026 to 2030 (Eurostat, Jan 2026).
How far can electrification go?
- The share of energy in buildings that is electric rose from about 25% in 2000 to nearly 40% in 2025 (IEA, Sep 2026).
- Heat pumps are cost competitive in around 75% of heating markets in advanced economies and China (IEA, Sep 2026).
- About half of residential fuel consumption could be electrified at a competitive cost (IEA, Sep 2026).
- The IEA’s high electrification case lifts the electric share of space heating in advanced economies and China from about 15% today to 27% by 2035 (IEA, Sep 2026).
What about offices, shops and other commercial buildings?
Gas supplies most commercial space heating. Washington’s performance standard shows how a rule phases in, starting with the largest buildings.
What fuels heat commercial buildings?
- Service buildings such as salons and repair shops used 52% of their energy for space heating, the largest share of any building type (EIA, Jan 2023).
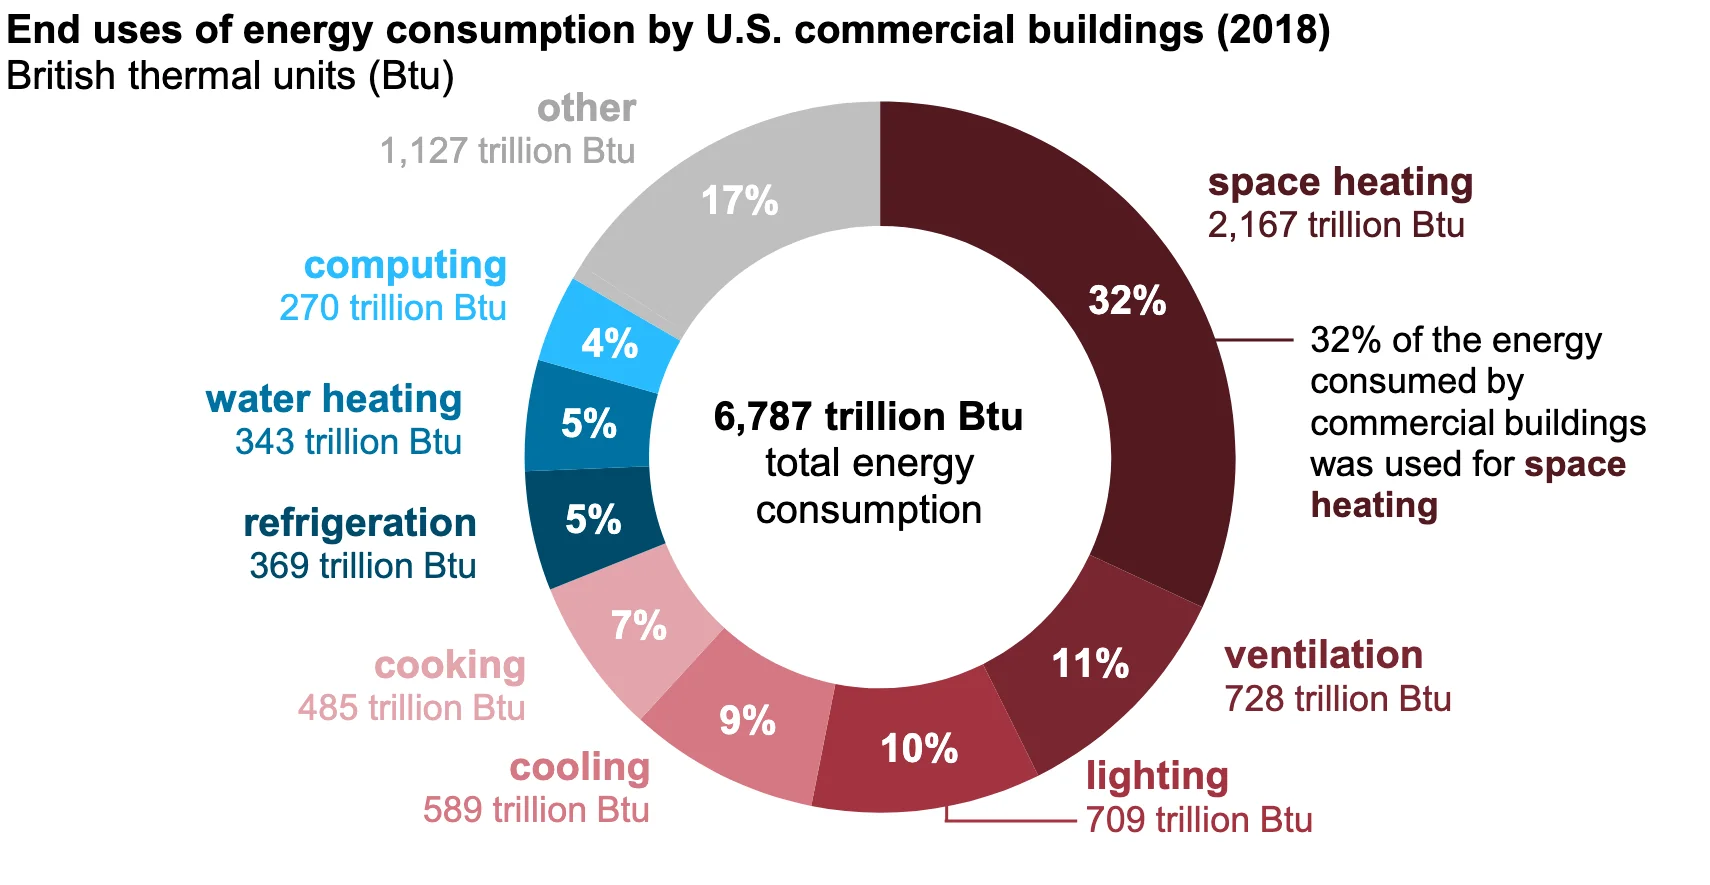
- Natural gas supplied 73% of the 2,167 trillion Btu used for commercial space heating in 2018 (EIA, Sep 2023).
- District heat supplied 12%, electricity 11% and fuel oil 4% (EIA, Sep 2023).
- Overall, electricity made up 60% and natural gas 34% of energy use in commercial buildings in 2018 (EIA, Jun 2023).
- In cold climates 62% of buildings heated all of their floor space, against 40% in hot climates (EIA, Sep 2023).
Which performance deadlines are coming?
- Washington’s Clean Buildings Performance Standard set a compliance date of 1 June 2026 for buildings over 220,000 square feet (Washington Department of Commerce, Oct 2026).
- The next dates are 1 June 2027 for buildings from 90,000 to 220,000 square feet and 1 June 2028 for those from 50,000 to 90,000 (Washington Department of Commerce, Oct 2026).
- Buildings from 20,000 to 50,000 square feet, and all multifamily buildings over 20,000 square feet, must comply by 1 July 2027 (Washington Department of Commerce, Oct 2026).
- Singapore has required at least 60% energy savings against 2005 levels in new public buildings and in existing ones that go through major retrofits since 2021 (UNEP, May 2026).
Are there enough workers to do the work?
Installers carry out every grant and every code. The labor pool is large, and in the UK data most installer firms are small.
How big is the HVAC workforce?
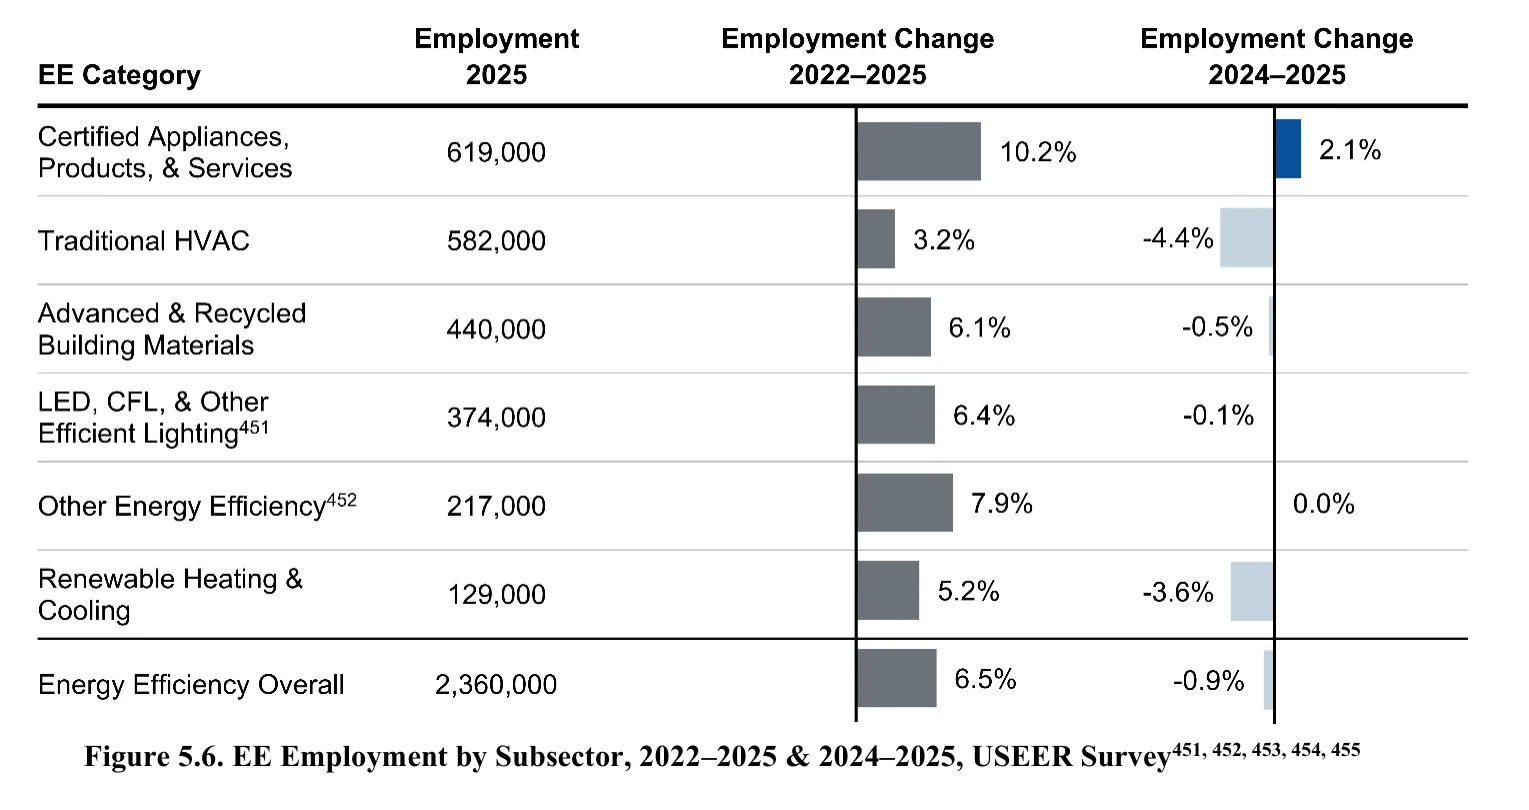
- Traditional HVAC employed 582,000 people in 2025, which is 3.2% more than in 2022 (U.S. DOE, Aug 2026).
- That is 4.4% fewer than in 2024 (U.S. DOE, Aug 2026).
- Renewable heating and cooling employed 129,000 people in 2025, down 3.6% from 2024 (U.S. DOE, Aug 2026).
- Employment in certified ground-source and geothermal heat pumps grew 19%, or 1,200 workers, from 2022 to 2025 (U.S. DOE, Aug 2026).
Who does the installing?
- Among UK installers registered for the heat pump grant, 61% employed 2 to 9 people and 7% were sole traders (UK DESNZ, Sep 2026).
- The median registered installer completed five grant-funded installations, and the mean was 26 (UK DESNZ, Sep 2026).
- The UK Warm Homes Plan expects to support 180,000 new jobs (UK DESNZ, Jan 2026).
- U.S. panel and service upgrades face a shortage of skilled electricians and transformer lead times of more than a year (Lawrence Berkeley National Laboratory, Apr 2024).
Methodology and Sources
Every figure comes from the agency, laboratory, operator, regulator or journal that produced it. Each link was opened and the number was read on the page or in the PDF before it went in. Trade blogs, vendor pages and roundups were not used. Where a page has no publication date, the month shown is the month the page was checked. Figures on separate pages can differ in year, region and method, so the page never blends them into one claim. Cost and price figures are in the currency and year the source uses. The page is updated monthly. This page is not affiliated with any agency named here.
Glossary
- AMI: area median income.
- ASHP: air-source heat pump.
- BTU/h: British thermal units per hour, a measure of heating or cooling output.
- BUS: the UK Boiler Upgrade Scheme, a grant for heat pumps.
- CELT: the Forecast Report of Capacity, Energy, Loads, and Transmission published by ISO New England.
- EPCA: the Energy Policy and Conservation Act, a federal law on appliance energy use.
- ERCOT: the Electric Reliability Council of Texas, the grid operator for most of Texas.
- GWh, MW, GW: gigawatt-hours of energy, and megawatts and gigawatts of power.
- ISO: independent system operator, a grid operator.
- LCH: low-carbon heating.
- NOx: nitrogen oxides, an air pollutant from burning fuel.
- Operational emissions: emissions from the energy a building uses, not from making it.
- Zero-emission building: a building with no on-site fossil fuel emissions and very high energy performance, as the EU defines it.
Sources
- EPA, Commercial and Residential Sector Emissions
- UNEP, Global Status Report for Buildings and Construction 2025-2026
- IEA, Electrification
- IEA, Electricity 2026: Demand
- EIA, U.S. Energy-Related Carbon Dioxide Emissions, 2025
- EIA, The majority of U.S. households used natural gas in 2020
- EIA, In 2020, most U.S. households prepared at least one hot meal a day at home
- EIA, Electricity use is becoming more common for residential heating
- EIA, Short-Term Energy Outlook: Electricity, Coal and Renewables
- EIA, Natural Gas Prices
- EIA, U.S. commercial buildings consumed more fuel for space heating than anything else in 2018
- EIA, Heating U.S. commercial buildings is most energy intensive in cold climates
- EIA, Use of energy in commercial buildings
- California Energy Commission, 2025 California Energy Code Fact Sheet
- Bay Area Air Quality Management District, Building Appliances Rule Implementation
- Congressional Research Service, Natural Gas Appliances, Energy Policy, and Federalism (LSB11461)
- Congressional Research Service, IRA Tax Credit Repeal in the FY2025 Reconciliation Law: Part 2 (IN12625)
- U.S. Court of Appeals for the Ninth Circuit, California Restaurant Ass’n v. City of Berkeley
- NYC Department of Buildings, Local Law 154: Building Electrification
- New York Department of State, Draft Scope for the Energy Code rulemaking
- European Commission, Nearly-zero energy and zero-emission buildings
- EUR-Lex, Directive (EU) 2024/1275 on the energy performance of buildings
- NESCAUM and the Ozone Transport Commission, Heat Pumps in the Northeast and Mid-Atlantic: Costs and Market Trends
- Lawrence Berkeley National Laboratory, Understanding the Costs and Barriers of Residential Electrical Panel and Service Upgrades
- Journal of Building Engineering, Characterizing electrical panel capacity, breaker space, and loads in U.S. single-family homes
- Lawrence Berkeley National Laboratory, Optimizing Heating and Electric Loads in Retrofits (2025)
- Lawrence Berkeley National Laboratory, Affordable Home Electrification: Avoiding Electric Panel and Service Costs (2024)
- U.S. DOE, Affordable and Equitable Residential Electrification Under Electrical Panel and Service Constraints
- U.S. DOE, Home Energy Rebates Program Office Hours (December 2024)
- U.S. DOE, 2026 United States Energy and Employment Report
- IRS, 2025 Instructions for Form 5695
- Joule, Heat pumps for all? Distributions of the costs and benefits of residential air-source heat pumps in the United States
- Energy Policy, Greenhouse gas emission forecasts for electrification of space heating in residential homes in the US
- Applied Energy, Quantifying the impact of residential space heating electrification on the Texas electric grid
- Scientific Reports, Effects of uncoordinated electrification on energy burdens for natural gas customers
- ISO New England, 2026 CELT Overview webinar (June 2026)
- ISO New England, 2026 Final Draft Energy and Seasonal Peak Forecasts (March 2026)
- NYISO, 2026 Power Trends Report
- NERC, 2025 Long-Term Reliability Assessment
- UK DESNZ, Evaluation of the Boiler Upgrade Scheme: 2026 Final Report
- UK DESNZ, Warm Homes Plan
- GOV.UK, Boiler Upgrade Scheme: what you can get
- GOV.UK, Heat pumps in demand as grant applications soar by 75%
- Destatis, Rund drei Viertel der im Jahr 2025 errichteten Wohngebäude heizen mit Wärmepumpen
- Eurostat, Small increase in renewable heating and cooling in 2024
- Washington Department of Commerce, Clean Buildings Performance Standard