HVAC energy consumption statistics tell one story again and again: heating and cooling decide the size of a building’s energy bill, and weather, climate and the building shell decide the size of the heating and cooling. In U.S. homes the two uses took more than half of all site energy in 2020, and in the summer of 2026 they pushed three major grid operators to new peak records.
This page collects 129 dated figures from government agencies, national laboratories, the International Energy Agency and peer-reviewed journals. Every number links to the document that produced it. The data covers U.S. homes and commercial buildings first, then the grid, installation losses and the world picture.
Use it to size a system against real averages, to explain a bill to a customer, or to check a claim before you repeat it. Each stat appears once, so scan the headings for the question you need. The figures are refreshed every month.
Key Takeaways
- Space heating and air conditioning together took 52% of a U.S. household’s annual energy in 2020, more than every other use combined (EIA, Dec 2023).
- Air conditioning used 254 billion kWh in 2020, about 19% of the electricity used in U.S. homes (EIA, Mar 2024).
- Households in very cold and cold climates used 54.0 million Btu for space heating in 2020, about 4.7 times the 11.5 million Btu used in hot-humid climates (EIA, Mar 2024).
- ERCOT peaked at 91.1 GW on July 22, 2026, 6.5% above its previous record, in what EIA describes as the hottest U.S. summer on record (EIA, Oct 2026).
- Air conditioners and fans use about a fifth of the electricity in buildings worldwide, which is 10% of all electricity (IEA, May 2018).
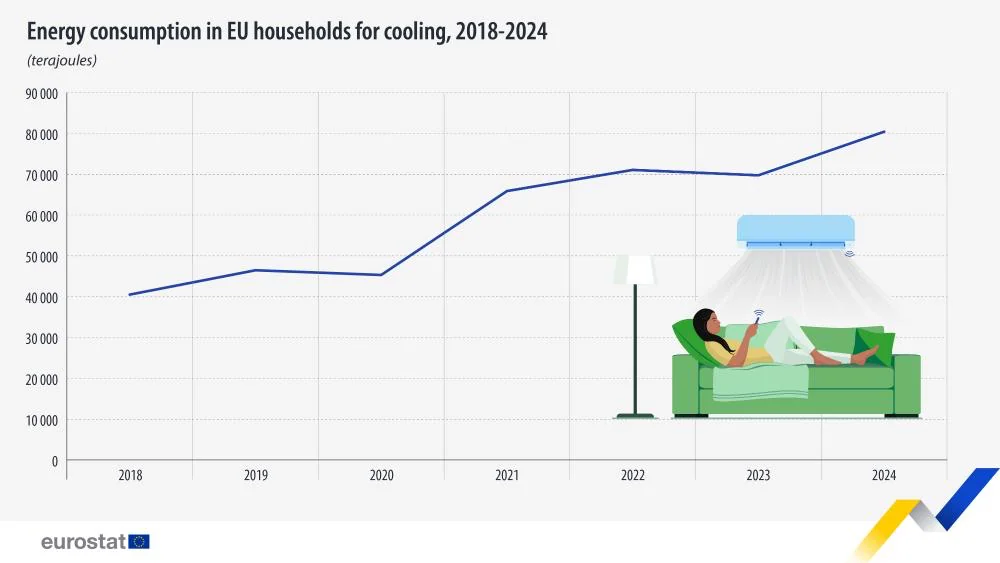
- EU households used 80.4 thousand terajoules for cooling in 2024, double the 2018 level (Eurostat, Jul 2026).
- Field research finds that 70% to 90% of residential air conditioners and heat pumps have at least one performance fault, rising to 90% to 100% when duct leakage counts (U.S. DOE, Jun 2018).
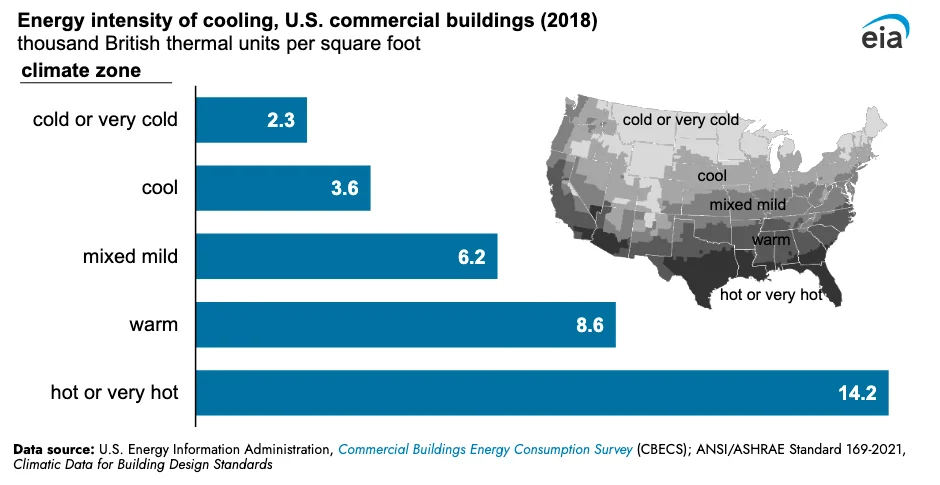
- U.S. commercial buildings in hot climates used more than six times as much energy per square foot for cooling as buildings in cold climates: 14.2 against 2.3 thousand Btu (EIA, Jul 2023).
- Space cooling has been the fastest-growing end use in buildings since 2000, at more than 4% a year (IEA, Nov 2025).
- Global cooling demand could more than triple by 2050 if nothing changes (UNEP, Nov 2025).
- Space heating was 60.8% of domestic energy use in the UK in 2025 (UK DESNZ, Sep 2026).
- 91% of owner-built single-family homes completed in the U.S. in 2025 had air conditioning (U.S. Census Bureau, Jul 2026).
- An oversized air conditioner that draws power while it is off can use 10% to 21% more energy than a right-sized unit (NREL, Nov 2014).
What share of home energy goes to heating and cooling?
Heating and cooling are the biggest line on most home energy bills, and the weather and the building shell set most of it. Appliances matter less than people assume.
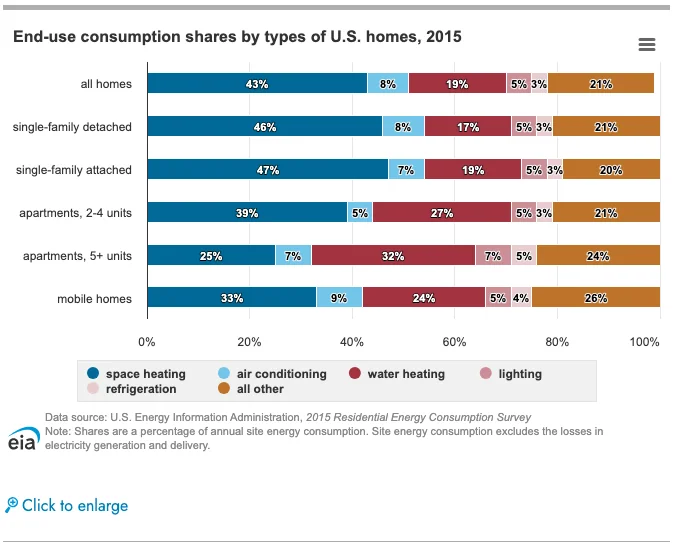
How big is the heating and cooling share of household energy?
Space heating is the largest single end use in U.S. homes. Air conditioning is a smaller slice that still varies hugely by state.
- Space heating accounted for 42% of residential energy consumption in 2020 (EIA, Jun 2023).
- Air conditioning accounted for 9% of total site energy across all U.S. households (EIA, Jun 2023).
- The air conditioning share ranged from 28% of site energy in Florida to 2% in Maine (EIA, Jun 2023).
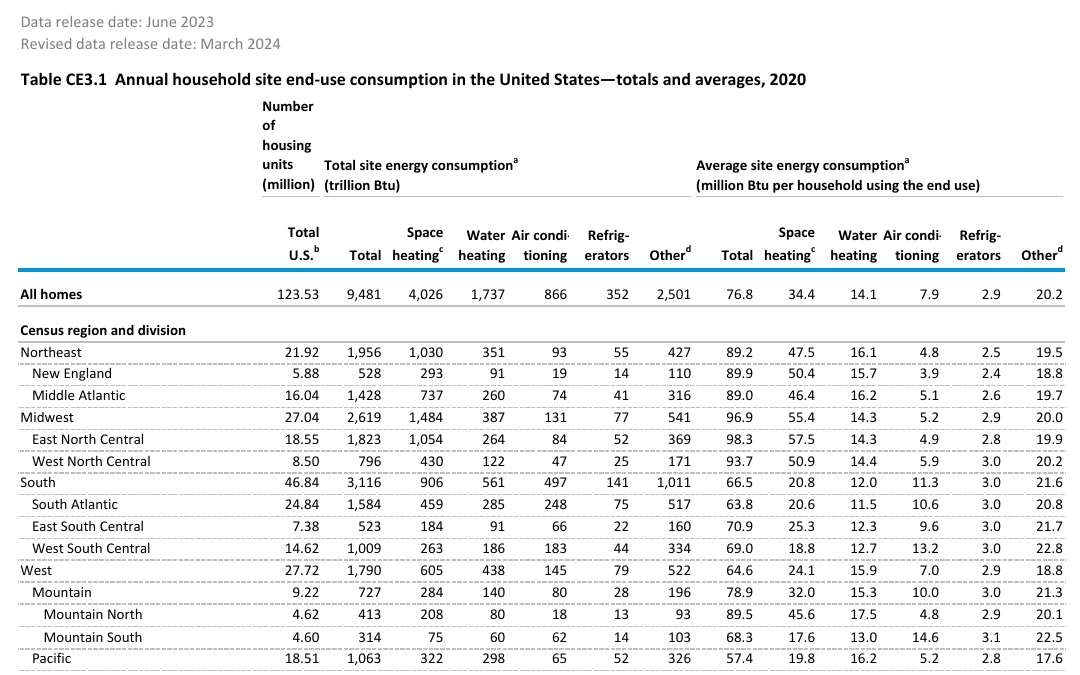
- Homes used 9,481 trillion Btu of site energy in 2020: 4,026 trillion Btu for space heating, 1,737 for water heating and 866 for air conditioning (EIA, Mar 2024).
- Households spent $232.76 billion on site energy in 2020, of which $60.78 billion went to space heating and $32.77 billion to air conditioning (EIA, Mar 2024).
Which fuels supply the heating load?
Natural gas carries most of the load, and electricity still supplies a small share of it.
- Of the 4,026 trillion Btu used for space heating, 2,887 came from natural gas, 550 from electricity and 274 from propane (EIA, Mar 2024).
- Natural gas, used in 58% of homes, supplied 43% of residential end-use energy in 2020, while electricity supplied 44% (EIA, Dec 2023).
- Average space heating bills in 2020 were $1,164 with fuel oil or kerosene, $1,010 with propane, $519 with natural gas and $396 with electricity (EIA, Jun 2023).
- Heat pumps were the main heating equipment in 13% of households (EIA, Dec 2023).
- Among single-family homes completed in 2025, 42% were fueled with gas and 56% with electricity (U.S. Census Bureau, Jul 2026).
- In the South, 63% of new single-family homes had a heat pump and 36% had a forced-air furnace (U.S. Census Bureau, Jul 2026).
How much energy does HVAC use per household?
The national average hides a wide spread. A small, newer apartment can use a fraction of the heating energy of a large, older house.
What does the average household use for heating and cooling?
A typical U.S. home used 76.8 million Btu of site energy in 2020, and heating was the biggest piece of it.
- Households that used space heating averaged 34.4 million Btu a year for it, and households with air conditioning averaged 7.9 million Btu (EIA, Mar 2024).
- The average household using space heating spent $519 on it in 2020, and the average household using air conditioning spent $299 (EIA, Mar 2024).
- DOE’s end-use load profiles describe the building stock with about 900,000 building energy models (U.S. DOE, Dec 2022).
How do size, age and type of home change the load?
Floor area, year built and home type each move heating energy by a factor of three or more.
- Homes under 1,000 square feet used 14.5 million Btu for space heating and 4.6 for cooling, against 61.2 and 11.3 in homes of 3,000 square feet or more (EIA, Mar 2024).
- Homes built before 1950 averaged 50.9 million Btu for space heating, against 20.2 million Btu for homes built from 2016 to 2020 (EIA, Mar 2024).
- Detached single-family homes averaged 44.0 million Btu for space heating, while apartments in buildings of five or more units averaged 9.1 (EIA, Mar 2024).
- In the marine climate region, mobile homes have the highest heating load intensity of any building type of comparable age (NREL, Jul 2022).
- Among single-family homes, 43% had a basement and 69% had an attic in 2024, spaces that can add heating and cooling load (EIA, Sep 2026).
- In New England the average home had 1,616 heated square feet but only 912 cooled square feet (EIA, Sep 2026).
- The median new single-family home sold in 2025 had 2,194 square feet (U.S. Census Bureau, Jul 2026).
Do income, household size and renting matter?
They do, mostly because they track home size and who pays the bill.
- Air conditioning energy rose from 5.6 million Btu in one-person households to 10.8 million Btu in five-person households (EIA, Mar 2024).
- Households that paid all their own energy bills averaged 35.9 million Btu for space heating, against 16.1 where energy was included in rent or condo fees (EIA, Mar 2024).
How does climate zone change heating and cooling energy use?
Climate zone sorts homes more than any other factor. A cold-climate house is a heating problem, and a hot-humid house is a cooling problem.
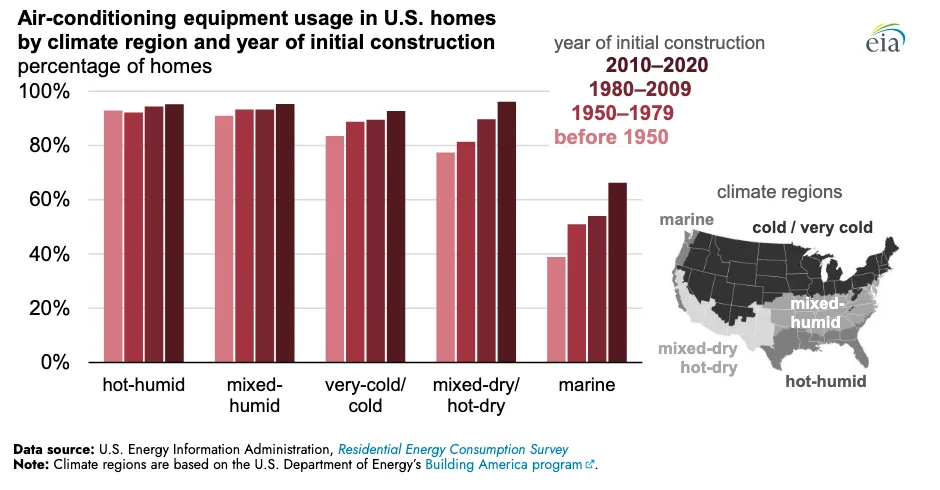
How much energy does each climate region use?
Heating dominates the north and cooling grows steadily toward the south, but even hot regions still heat.
- Mixed-humid households averaged 32.6 million Btu for space heating and 7.8 for cooling (EIA, Mar 2024).
- Hot-humid households averaged 14.2 million Btu for cooling, against 3.1 in the marine region (EIA, Mar 2024).
- Midwest households averaged 55.4 million Btu for space heating and Northeast households 47.5, while South households averaged 20.8 (EIA, Mar 2024).
- Average space heating bills were $684 in very cold and cold climates and $262 in mixed-dry and hot-dry climates (EIA, Mar 2024).
- Average cooling bills were $482 in hot-humid climates and $124 in the marine region (EIA, Mar 2024).
Which states and homes use the most?
State averages show the same spread as climate zones, and the gap is wide even inside one region.
- New Hampshire households spent an average of $981 on space heating, while Louisiana households spent $244 (EIA, Jun 2023).
- In the Midwest and South, 92% and 93% of households used air conditioning, against 73% in the West (EIA, May 2022).
- Half of Northeast households primarily use individual units such as window, wall, portable or mini-split air conditioners (EIA, May 2022).
- In British Columbia, nearly 70% of households now have some form of air conditioning (BC Hydro, Jul 2026).
Is the climate itself shifting the load?
Yes. Heating need is falling slowly in most places, and cooling need and cooling peaks are rising.
- Across the contiguous U.S. over 70 years, average heating demand decreased and cooling demand increased, and climate change drives robust increases in peak cooling demand (Communications Earth & Environment, Nov 2023).
- Worldwide, 5 billion people experience more than 100 additional cooling degree days a year than a generation ago (Nature Energy, Sep 2023).
- Cooling service demand is increasing by up to 5% a year in some regions because of climate change (Nature Energy, Sep 2023).
- Ignoring warming trends underestimates cooling demand by up to 23% in low-warming scenarios and 79% in high-warming ones by 2100 (Nature Communications, Jun 2026).
- The same models overestimate heating demand by up to 14% and 40% in those scenarios (Nature Communications, Jun 2026).
- In Los Angeles, residential electricity demand could rise 41% to 87% between 2020 and 2060 under warming, and efficiency upgrades could hold the rise to 28% (Nature Communications, May 2017).
- UK domestic energy use rose 0.2% to 34.0 million tonnes of oil equivalent in 2025 despite higher temperatures (UK DESNZ, Sep 2026).
How do cooling and heating loads compare?
Heating still dominates the energy ledger in cold countries. Cooling is the faster-growing half, and in the U.S. it is already standard equipment.
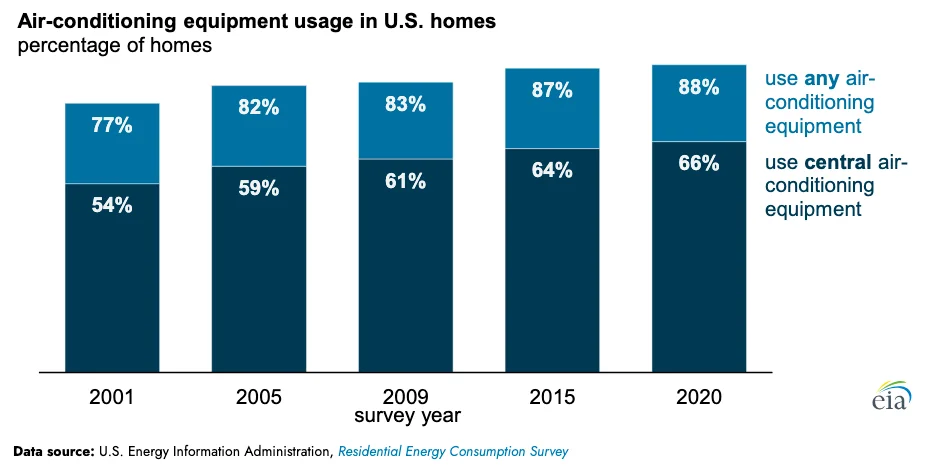
Is air conditioning now standard in U.S. homes?
Almost. About nine in ten homes have some cooling, and nearly every new building does.
- In 2020, 88% of U.S. households used air conditioning, and two-thirds used central AC or a central heat pump as main equipment (EIA, May 2022).
- In 1980 only 57% of homes had air conditioning and only 27% had central air conditioning (EIA, Dec 2023).
- Of 17,000 multifamily buildings completed in 2025, 99% had air conditioning and 53% used a heat pump for heating (U.S. Census Bureau, Jul 2026).
- In the West, 4% of new multifamily units had no air conditioning (U.S. Census Bureau, Jul 2026).
How does residential electricity use for cooling compare with heating?
Cooling is the largest residential electricity use, but electric heating is close behind per home that uses it.
- Space heating and water heating each took 12% of residential site electricity in 2020 (EIA, Dec 2023).
- Households with electric space heating used 8.48 million Btu of electricity for it, against 7.91 million Btu for air conditioning (EIA, Mar 2024).
- Air handlers used 1.56 million Btu for cooling and 0.79 for heating (EIA, Mar 2024).
How big is heating compared with cooling outside the U.S.?
In cooler countries heating is most of the household load, and cooling is a rounding error that is starting to grow.
- Space heating was 61.5% of EU household final energy use in 2024, and space cooling was 0.8% (Eurostat, Jun 2026).
- Water heating took 15.6% of EU household energy, lighting and appliances 14.8% and cooking 6.4% (Eurostat, Jun 2026).
- The space heating share was 20.0% in Malta and 76.5% in Luxembourg (Eurostat, Jun 2026).
- Natural gas supplied 34.7% of EU space heating and renewables 32.3% (Eurostat, Jun 2026).
- UK homes used 66.4% of their energy for space heating in 2000 and 60.8% in 2025 (UK DESNZ, Sep 2026).
- UK energy for space and water heating fell 32% from 2000 to 2025, from 39.3 to 26.6 million tonnes of oil equivalent (UK DESNZ, Sep 2026).
- In advanced economies, space and water heating together account for about 70% of home energy use (IEA, Nov 2025).
How much energy does HVAC use in commercial buildings?
Commercial buildings are a different problem. Ventilation, packaged rooftop equipment and building use matter as much as climate.
How much energy do U.S. commercial buildings use?
A bit under 7 quadrillion Btu, with heating the largest single end use.
- In 2018 the U.S. had about 5.9 million commercial buildings with 96.4 billion square feet of floorspace, using about 6.8 quadrillion Btu (EIA, Jun 2023).
- About 32% of commercial building energy use was for space heating, and ventilation and lighting each took about 10% (EIA, Jun 2023).
- Small packaged HVAC units serve 55% of commercial floor area and 73% of commercial buildings (NREL, Jul 2022).
- 63% of existing small packaged units use fossil fuel (NREL, Jul 2022).
- Rooftop units serve more than 2.5 million U.S. buildings (PNNL, Jul 2026).
How much electricity goes to cooling and ventilation?
Together they take about a third of commercial electricity.
- Cooling took about 14% of commercial building electricity in 2018, or 170 billion kWh (EIA, Mar 2024).
- Ventilation took another 18%, or 213 billion kWh (EIA, Mar 2024).
- Electricity supplied 98% of the 589 trillion Btu of major fuels used for commercial cooling in 2018 (EIA, Jul 2023).
- Computing was 8% of commercial electricity in 2024 and is projected to reach 20% by 2050, which could pass space cooling and ventilation (EIA, Jun 2025).
What changes the cooling load in a commercial building?
Climate sets how much floor space is cooled, and equipment type sets how well.
- In the hot or very hot climate zone, 52% of buildings cooled all their floorspace, against 25% in the cold or very cold zone (EIA, Jul 2023).
- Advanced rooftop units under test can cut HVAC costs by up to 50% against current systems (PNNL, Jul 2026).
- A single crane lift for a rooftop unit can cost $30,000 (PNNL, Jul 2026).
- In mid-size retail buildings with small packaged units, heating was 40% of thermal energy use (NREL, Jul 2022).
How much does air conditioning add to peak electricity demand?
Peak demand is where HVAC stops being a bill and becomes an infrastructure problem. The hottest hours set how much generation and wire a region needs.
How high did U.S. peaks climb in 2026?
Three operators set records, and several others came within a few percent.
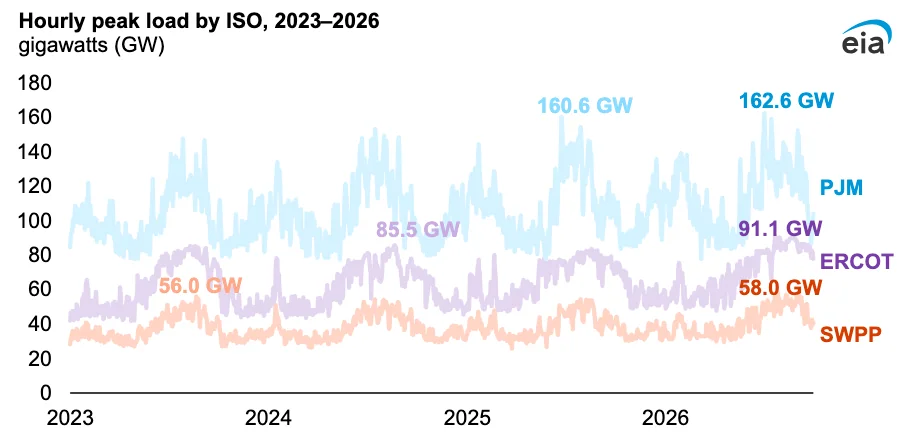
- PJM peaked at 162.6 GW on July 2, 2026, 1.3% above its previous peak of 160.6 GW (EIA, Oct 2026).
- The Southwest Power Pool peaked at 58.0 GW on July 27, 2026, 3.5% above its previous peak (EIA, Oct 2026).
- MISO peaked at 121.5 GW on June 30, 2026, the highest in EIA’s hourly grid data but below its 127.1 GW peak from 2011 (EIA, Oct 2026).
- ERCOT lists 91,089 MW on July 22, 2026 as its record, unofficial until final settlement (ERCOT, Aug 2026).
- One megawatt serves about 250 residential customers during ERCOT peak hours (ERCOT, Aug 2026).
How much does heat raise demand?
Each degree above a threshold adds load, and in the hottest regions cooling is most of the peak.
- In Texas, each 1 °C rise in average daily temperature above 24 °C raises electricity demand by about 4% (IEA, Jul 2023).
- In India the same rise raises demand by about 2% (IEA, Jul 2023).
- In hotter countries cooling can raise electricity demand by more than 50% in summer, and it can be over 70% of peak demand in the hottest regions (IEA, Jul 2023).
- Sustained average daily temperatures of 30 °C typically lift weekly air conditioner sales by about 16% (IEA, Jul 2023).
- BC Hydro set a summer peak of 8,715 MW in 2026, above the 8,652 MW record from August 2025 (BC Hydro, Jul 2026).
- NERC found summer 2026 peak demand across its assessment areas up by over 11 GW from forecasts made for summer 2025 (NERC, May 2026).
What does a sizing mistake add to peak load?
A system that is too large raises the connected load on every hot afternoon, and field data shows it is common.
- One study reviewed by DOE estimated that 31% of systems were oversized, adding up to 41 MW of excess peak demand (U.S. DOE, Jun 2018).
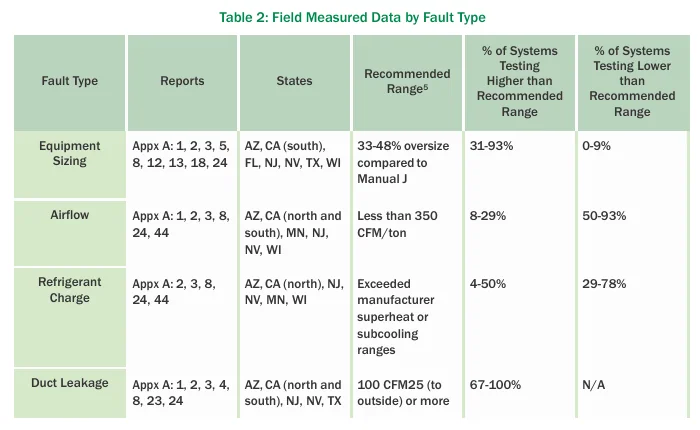
- Field studies found 31% to 93% of tested systems larger than the recommended range, and 0% to 9% smaller (U.S. DOE, Jun 2018).
- Repairing duct, airflow and charge faults together can save 12% to 47% of energy (U.S. DOE, Jun 2018).
How much energy do HVAC faults and oversizing waste?
Installed performance often falls short of the label. The losses come from ducts, airflow, refrigerant charge and sizing, not from the equipment brand.
How common are installation and maintenance faults?
Faults are the rule, not the exception.
- Duct leakage is the most common source of degradation, with most studies finding 90% to 100% of systems needing duct sealing or repair (U.S. DOE, Jun 2018).
- Low airflow, below 350 CFM per ton, was found in 50% to 93% of systems tested, and high airflow in 8% to 29% (U.S. DOE, Jun 2018).
- Refrigerant undercharge ranged from 29% to 78% of systems and overcharge from 4% to 50% (U.S. DOE, Jun 2018).
- One reviewed study found about 20% of the efficiency of newly installed air conditioners is lost at installation (U.S. DOE, Jun 2018).
- One small study measured central air conditioners at 59% to 84% of their rated SEER (U.S. DOE, Jun 2018).
What do ducts and tune-ups recover?
Duct work offers the largest gain, and a plain tune-up the smallest.
- Duct sealing and insulation can raise cooling capacity by 33% and seasonal efficiency by 16% to 41% (U.S. DOE, Jun 2018).
- Repairs to static pressure, capacity, charge and expansion valves improved air conditioner and heat pump efficiency by 24% in one study (U.S. DOE, Jun 2018).
- The incremental saving from tuning up an existing air conditioner or heat pump is about 5% (U.S. DOE, Jun 2018).
- A 1 °C lower thermostat setting across all buildings could cut Europe’s gas use by 240 TWh a year, about one-sixth of its historical Russian imports (Nature Energy, Sep 2023).
Does an oversized system waste energy?
Sometimes a little, and sometimes a lot, depending on what the unit draws when it is off.
- Without off-cycle parasitic power, oversizing penalties ranged from -2% to 4% at capacity ratios of 1.8 and 2.2 (NREL, Nov 2014).
- With off-cycle parasitic power proportional to capacity, the penalties ranged from 10% to 21% (NREL, Nov 2014).
- In one reviewed study, cooling systems were oversized by 23% on average, and 53% of measured airflows were below 350 CFM per ton (U.S. DOE, Jun 2018).
- Another reviewed study found common sensible heat gain calculations overestimated loads by as much as 50% (U.S. DOE, Jun 2018).
A room-by-room estimate such as the BTU calculator is the quick way to check a unit size against the load before you buy.
What do federal efficiency standards require now?
A floor of 13.4 SEER2 for most split air conditioners in the north, with higher floors in the south and for heat pumps.
- Split-system air conditioners sold since 2023 must meet 13.4 SEER2 in the northern region (eCFR, 10 CFR 430.32, Oct 2026).
- Split-system heat pumps must meet 14.3 SEER2 and 7.5 HSPF2 (eCFR, 10 CFR 430.32, Oct 2026).
- Split-system air conditioners under 45,000 Btu per hour installed in the southeast or southwest must meet 14.3 SEER2 (eCFR, 10 CFR 430.32, Oct 2026).
- Minimum standards and labels have helped more than halve the energy use of air conditioners in the United States and the EU (IEA, Jul 2023).
When you size a heat pump against these ratings, the heat pump sizing calculator shows the load it has to meet.
What do HVAC system energy statistics show worldwide?
Worldwide, cooling is where growth is. Demand is rising fastest where few homes have air conditioning today.
How fast is household cooling growing in the EU?
Fast, from a low base, and unevenly across member states.
- EU household cooling energy was 40.5 thousand terajoules in 2018 (Eurostat, Jul 2026).
- Consumption fell 2.5% in 2020 and 1.9% in 2023 and rose in every other year (Eurostat, Jul 2026).
- Italy, Spain and Greece used the most, at 26.3, 14.3 and 11.9 thousand terajoules (Eurostat, Jul 2026).
- Cooling was 16.0% of household energy in Cyprus and 15.0% in Malta (Eurostat, Jul 2026).
- Cooling was 7.4% of household energy in Greece, 2.5% in Spain and 2.3% in Italy (Eurostat, Jul 2026).
How big is global cooling demand, and where is it going?
Several agencies agree on the direction even where the exact numbers differ.
- Global air conditioner stock is projected to grow from 1.6 billion units to 5.6 billion by 2050, about 10 new units sold every second (IEA, May 2018).
- Energy demand for air conditioning is projected to triple by 2050 without action (IEA, May 2018).
- Less than a third of global households own an air conditioner, while more than 90% do in the United States and Japan, against 8% of the 2.8 billion people in the hottest parts of the world (IEA, May 2018).
- Air conditioners sold in Japan and the EU are typically 25% more efficient than those sold in the United States and China (IEA, May 2018).
- In India, air conditioning could rise from 10% of peak electricity load to 45% by 2050 without action (IEA, May 2018).
- Buildings were about 30% of global energy demand in 2024, and homes made up about 70% of that (IEA, Nov 2025).
- Under business as usual, cooling emissions could reach about 7.2 billion tons of CO2 by 2050, and a sustainable pathway could cut them by 64% (UNEP, Nov 2025).
- Heat islands can raise city temperatures by 5 to 10 °C (UNEP, Nov 2025).
- Buildings and construction account for 37% of global emissions (UNEP, May 2026).
Who will have air conditioning by 2050?
Income decides, and the research points to a large unmet need.
- The share of households with air conditioning could grow from 27% to 41% by 2050, and residential cooling electricity from 1,220 to 1,940 TWh a year (Nature Communications, Sep 2024).
- Up to 4 billion people may lack air conditioning in 2050 (Nature Communications, Sep 2024).
- Air conditioning could emit 113.3 GtCO2eq cumulatively from 2010 to 2050 in a middle-of-the-road scenario, with only about 8.3% tied to climate-driven cooling demand (Nature Communications, Feb 2026).
- India’s cooling demand is projected to grow about 8 times by 2037-38 from 2017-18, and building cooling demand about 11 times (Ministry of Environment, Forest and Climate Change, India, Mar 2019).
- India’s per-capita space cooling use is 69 kWh a year, against a world average of 272 kWh (Ministry of Environment, Forest and Climate Change, India, Mar 2019).
Methodology and Sources
Every figure comes from the agency, laboratory or journal that produced it, and each link points to the report, table or release itself. Roundups and trade blogs were not used. Where two EIA pages differ slightly, for example on the share of homes with air conditioning, the page named in the citation is the one quoted. Older figures are kept only where no newer measurement exists, and each one carries its date. The page is reviewed every month against new releases from EIA, IEA, the national grid operators and the journals listed below.
Glossary
- Btu: British thermal unit, a standard unit of heat energy. One million Btu is written MMBtu or “million Btu”.
- CBECS: Commercial Buildings Energy Consumption Survey, run by EIA.
- CDD and HDD: cooling and heating degree days, a measure of how far outdoor temperature sits above or below a base.
- CFM: cubic feet per minute, a measure of airflow.
- GW and MW: gigawatt and megawatt, units of power. One GW is 1,000 MW.
- HSPF2: Heating Seasonal Performance Factor 2, the efficiency rating for heat pump heating.
- MEPS: minimum energy performance standards.
- RECS: Residential Energy Consumption Survey, run by EIA.
- SEER2: Seasonal Energy Efficiency Ratio 2, the efficiency rating for cooling.
- Site energy: energy used at the building, not counting losses in power generation and delivery.
Sources
- BC Hydro, Extreme heat leads to record-breaking summer electricity demand, Jul 2026
- Communications Earth & Environment, Differential effects of climate change on average and peak demand for heating and cooling across the contiguous USA, Nov 2023
- eCFR, 10 CFR 430.32, 10 CFR 430.32, 10 CFR 430.32, Energy and water conservation standards and their compliance dates, Oct 2026
- EIA, 2020 RECS Table CE3.1, household site end-use consumption, Mar 2024
- EIA, 2020 RECS Table CE3.6, household end-use expenditures, Mar 2024
- EIA, 2020 RECS Table CE4.1, end-use consumption by fuel, Mar 2024
- EIA, 2020 RECS Table CE5.3a, detailed electricity end-use consumption, Mar 2024
- EIA, 2024 RECS Housing Characteristics Highlights, Sep 2026
- EIA, Cooling commercial buildings is six times more energy-intensive in hot climates than cold, Jul 2023
- EIA, Electricity use for commercial computing could surpass space cooling, ventilation, Jun 2025
- EIA, Electricity use in homes, Dec 2023
- EIA, How much electricity is used for air conditioning in the United States?, Mar 2024
- EIA, Nearly 90% of U.S. households used air conditioning in 2020, May 2022
- EIA, PJM, ERCOT, and SWPP all set peak load records this summer, Oct 2026
- EIA, Press release: 2020 RECS energy end-use results, Jun 2023
- EIA, Use of energy in commercial buildings, Jun 2023
- EIA, Use of energy in homes, Dec 2023
- ERCOT, ERCOT Yearly Peak Demand Records, Aug 2026
- Eurostat, Energy consumption in households, Jun 2026
- Eurostat, Energy use for cooling in EU households doubled in 6 years, Jul 2026
- IEA, Air conditioning use emerges as one of the key drivers of global electricity demand growth, May 2018
- IEA, Energy Efficiency 2025, Buildings, Nov 2025
- IEA, Energy Efficiency 2025, Executive summary, Nov 2025
- IEA, Keeping cool in a hotter world is using more energy, making efficiency more important than ever, Jul 2023
- Ministry of Environment, Forest and Climate Change, India, Forest and Climate Change, India, India Cooling Action Plan, Mar 2019
- Nature Communications, Energy efficiency to reduce residential electricity and natural gas use under climate change, May 2017
- Nature Communications, Inequalities in global residential cooling energy use to 2050, Sep 2024
- Nature Communications, Rising Air-Conditioning Use Intensifies Global Warming, Feb 2026
- Nature Communications, Warming-driven shifts in global building energy use reshape climate mitigation planning, Jun 2026
- Nature Energy, A global model of hourly space heating and cooling demand at multiple spatial scales, Sep 2023
- NERC, 2026 Summer Reliability Assessment, May 2026
- NREL, Energy Impacts of Oversized Residential Air Conditioners, Nov 2014
- NREL, U.S. Building Stock Characterization Study (NREL/TP-5500-83063), Jul 2022
- PNNL, New HVAC Technologies Lower Energy Costs for Businesses, Jul 2026
- U.S. Census Bureau, Highlights of 2025 Characteristics of New Housing, Jul 2026
- U.S. DOE, End-Use Load Profiles for the U.S. Building Stock, Dec 2022
- U.S. DOE, Residential HVAC Installation Practices: A Review of Research Findings, Jun 2018
- UK DESNZ, Energy Consumption in the UK (ECUK) 2026, Sep 2026
- UNEP, Global Cooling Watch 2025, Nov 2025
- UNEP, Global Status Report for Buildings and Construction 2025-2026, May 2026