Green building statistics show a market that is large, uneven and easier to measure than it used to be. LEED projects keep landing in the same few states, the cost premium is small, and design models and utility bills agree on average but differ a lot from one building to the next. Every number below is linked to the group that produced it, with a date.
If you size heating and cooling for a living, the question under all of this is simple: does the building use less energy once people move in? The answer depends on how the envelope, the equipment and the controls were sized and tuned together. Sizing is the one part you can check on day one.
Where a number comes from a small sample or a single study, the text says so.
Key Takeaways
- Buildings are responsible for 39% of global energy related carbon emissions: 28% from operations and 11% from materials and construction (WorldGBC, Oct 2026).
- California certified 470 LEED projects in 2025, more than any other state (USGBC, Mar 2026).
- Washington, D.C. certified 49.20 square feet of LEED space per resident in 2025, far above any state (USGBC, Mar 2026).
- 22 sustainably designed federal buildings, 13 of them LEED certified, used 25% less energy than the national office average (PNNL, Sep 2011).
- In a 2006 study of 21 early LEED buildings, the number of LEED energy points did not correlate with actual energy savings (LBNL, May 2006).
- LEED buildings show a rent premium of 15.2% to 17.3% across 51 studies reviewed by Finch (LBNL, Oct 2015).
- Construction costs for LEED Silver and Gold run about 0% to 2% above non-rated buildings (LBNL, Oct 2015).
- The 2024 IECC saves an average of $2,954 per dwelling unit in 30-year life-cycle cost compared with the 2021 IECC (PNNL, Jan 2025).
- 2.6 billion square metres of floor space built in 2023 had no mandatory energy performance requirement (IEA, Nov 2025).
- 52 of 88 K-12 schools studied by NREL, or 59%, used less than 30 kBtu per square foot per year (NREL, Dec 2021).
- Workers in green certified offices scored 26.4% higher on cognitive tests (MacNaughton et al., Building and Environment, Nov 2016).
- WELL reports more than 100,000 locations across 6.48 billion square feet in 130 countries (IWBI, Oct 2026).
- 40% of HVAC units in commercial buildings are oversized by at least 25% (LBNL, Aug 2026).
How many buildings are LEED certified?
LEED is still the yardstick most American owners reach for, and its top-ranked states have barely moved in two years. The growth is no longer only offices: labs, warehouses and data centers now push the totals.
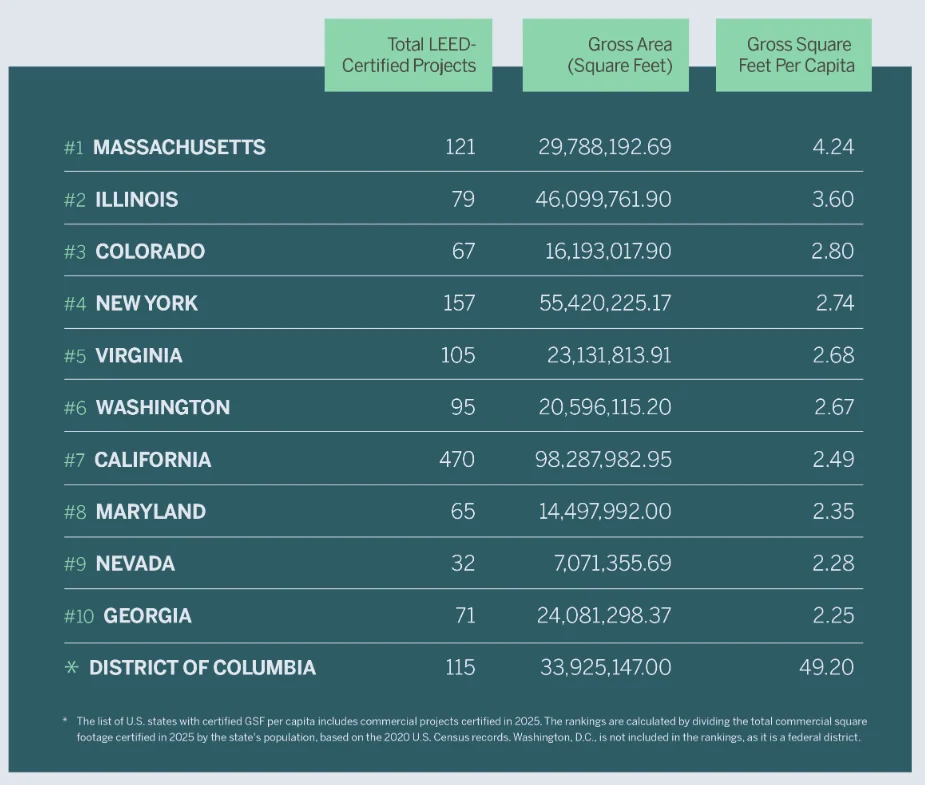
Which states certified the most LEED space in 2025?
Massachusetts ranked first for the second year in a row, with 4.24 gross square feet of LEED space per resident (USGBC, Mar 2026).
- Massachusetts certified 121 projects covering 29.8 million gross square feet (USGBC, Mar 2026).
- Illinois ranked second with 79 projects and 46.1 million gross square feet, or 3.60 square feet per resident (USGBC, Mar 2026).
- Illinois has been in the Top 10 States for LEED since 2010 (USGBC, Mar 2026).
- Colorado ranked third with 67 projects and 16.2 million gross square feet (USGBC, Mar 2026).
- Colorado climbed six spots to reach third place (USGBC, Mar 2026).
- New York ranked fourth with 157 projects and 55.4 million gross square feet (USGBC, Mar 2026).
- Virginia ranked fifth with 105 projects and 23.1 million gross square feet (USGBC, Mar 2026).
- Washington ranked sixth with 95 projects and 20.6 million gross square feet (USGBC, Mar 2026).
- Maryland ranked eighth with 65 projects and 14.5 million gross square feet (USGBC, Mar 2026).
- Nevada ranked ninth with 32 projects and 7.1 million gross square feet (USGBC, Mar 2026).
- Georgia ranked tenth with 71 projects and 24.1 million gross square feet (USGBC, Mar 2026).
- Georgia entered the top 10 for the first time since 2023 (USGBC, Mar 2026).
- Washington, D.C. is not ranked because it is a federal district, but it certified 115 projects covering 33.9 million gross square feet (USGBC, Mar 2026).
What is driving LEED growth now?
USGBC says life sciences, data centers and advanced manufacturing are fueling notable growth in several top states (USGBC, Mar 2026).
- Illinois saw LEED growth in industrial and logistics buildings, with steady demand for warehouse and distribution certification (USGBC, Mar 2026).
- Georgia saw an uptick in LEED certification from warehouses and distribution centers, especially in Atlanta and Savannah (USGBC, Mar 2026).
- California had a notable increase in data center certification (USGBC, Mar 2026).
How did 2025 compare with 2024?
Several leaders certified fewer projects in 2025 than a year earlier, so the rankings held while the volume moved.
- Massachusetts certified 132 projects and more than 34 million square feet in 2024, at 4.95 square feet per resident (USGBC, Jan 2025).
- Illinois certified 102 projects in 2024, equal to more than 51 million gross square feet (USGBC, Jan 2025).
- New York certified 170 projects in 2024, adding over 69 million square feet of LEED space (USGBC, Jan 2025).
- Washington certified 90 projects covering 23.3 million gross square feet in 2024 (USGBC, Jan 2025).
- Washington, D.C. certified 33.3 square feet per resident across 111 projects in 2024 (USGBC, Jan 2025).
How many people hold LEED credentials, and who references LEED?
More than 204,000 professionals have earned a LEED credential (USGBC, Oct 2026).
- More than 400 municipalities, 32 states and 14 federal agencies reference LEED as a best practice (USGBC, Oct 2026).
- California had 26,195 LEED credential holders in 2024, the most of any state (USGBC, Jan 2025).
- Canada has 6,286 LEED certified buildings (CAGBC, Oct 2026).
- CAGBC credits LEED certifications in Canada with 7.8 million tonnes less greenhouse gas emissions (CAGBC, Oct 2026).
Which rating systems outside LEED are growing?
LEED is not the only name on the door anymore. Regional systems now count their projects in the thousands, and several publish the floor area they cover.

How big are the systems in India and Hong Kong?
IGBC counts 20,458+ registered projects (IGBC, Oct 2026).
- IGBC reports a green building footprint of 16.48 billion square feet (IGBC, Oct 2026).
- IGBC says its certified buildings save 66.4 billion units of energy per year (IGBC, Oct 2026).
- IGBC says its certified buildings cut CO2 emissions by 53.1 million tonnes per year (IGBC, Oct 2026).
- Hong Kong’s BEAM Plus lists 2,244 certified projects (BEAM Society, Oct 2026).
Where do WELL, BREEAM and DGNB stand?
BREEAM has been used in more than 100 countries since 1990 (BRE, Oct 2026).
- BREEAM certifications in North America were more than 90% higher in 2025 than in 2023 (BRE, Oct 2026).
- BREEAM certifications have been issued for assets in 36 states and the District of Columbia (BRE, Oct 2026).
- DGNB has recognised more than 10,000 projects in over 30 countries (DGNB, Oct 2026).
- WELL lists 16,162 credentialed WELL accredited professionals (IWBI, Oct 2026).
What do passive and living building programs add up to?
Phius has certified more than 11.2 million square feet of passive building projects (Phius, Oct 2026).
- Living Future programs have shaped more than 55 million square feet of real estate development (Living Future, Oct 2026).
Which governments set targets for the share of green floor area?
Singapore aims for at least 80% of building gross floor area to be green by 2030 (SGBC, Oct 2026).
- At the end of 2020, 43% of Singapore’s buildings had been greened (SGBC, Oct 2026).
- Singapore’s best-in-class buildings achieve more than 65% better energy efficiency than 2005 levels, and the target is 80% by 2030 (SGBC, Oct 2026).
- From 2030, 80% of new developments by gross floor area are to be Super Low Energy buildings (SGBC, Oct 2026).
- Singapore plans to require new buildings to be 50% and major retrofits 40% more energy efficient than 2005 levels (SGBC, Oct 2026).
How many US buildings carry the ENERGY STAR label?
More than 43,000 commercial buildings, covering more than 6.5 billion square feet, have earned the ENERGY STAR since 1992 (EPA ENERGY STAR, Oct 2026).
How much energy do energy efficient buildings save?
Certified buildings usually beat the average, but the size of the gain depends on what you measure against. Utility bills show a wider spread than design models.
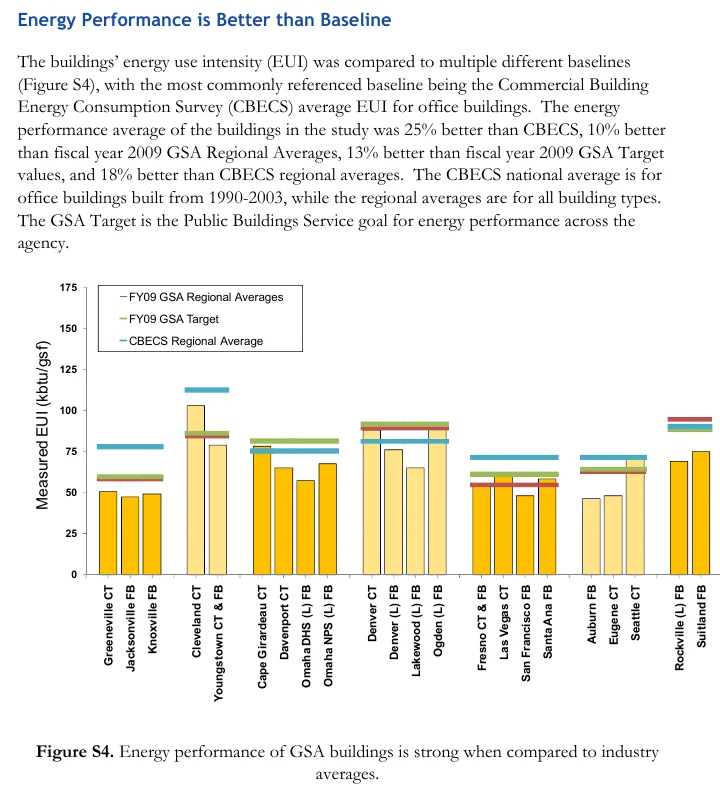
Do LEED buildings use less energy than typical ones?
In a PNNL study of 22 sustainably designed federal buildings, average energy use was 18% better than CBECS regional averages (PNNL, Sep 2011).
-
Thirteen of the 22 buildings are LEED certified and three are LEED registered (PNNL, Sep 2011).
-
Energy use was 10% better than fiscal year 2009 GSA regional averages and 13% better than the GSA target (PNNL, Sep 2011).
-
All 22 buildings were at or above the 50th percentile of the ENERGY STAR Portfolio Manager database, and all but 4 scored above the 75th (PNNL, Sep 2011).
-
GSA had 40 LEED-certified buildings in the winter of 2009, and the sample includes about one-third of them (PNNL, Sep 2011).
-
Water use averaged 11% below the baseline (PNNL, Sep 2011).
-
Aggregate operations costs were 19% lower than the industry average (PNNL, Sep 2011).
-
Carbon dioxide equivalent emissions were 34% lower than in typical buildings (PNNL, Sep 2011).
-
Commute emissions linked to the buildings were 29% lower than the average commute (PNNL, Sep 2011).
How close are design models to real utility bills?
Not very close for any single building. A 2006 LBNL review found that over 300 buildings had been LEED certified as of January 2006 (LBNL, May 2006).
- The mean energy savings modeled for the 21 sampled buildings was 27% against their modeled baselines (LBNL, May 2006).
- For the 18 buildings with both modeled and billed data, actual use was 1% lower than modeled, with a standard deviation of 46% (LBNL, May 2006).
- The mean ENERGY STAR score was 71, against an average of 50 and an award threshold of 75 (LBNL, May 2006).
- The sample of 21 buildings was only 7% of the roughly 300 LEED-NC buildings certified at the time (LBNL, May 2006).
What does energy benchmarking save?
Most studies of benchmarking and transparency policies show 3% to 8% lower gross energy use or energy use intensity over two to four years (LBNL, Apr 2017).
- All but one of the policy evaluations showed a reduction of between 1.6% and 14% in energy use, energy costs or energy intensity (LBNL, Apr 2017).
- New York City’s policy covers 2.06 billion square feet, 64% of it in multifamily buildings (LBNL, Apr 2017).
How much energy do US commercial buildings use today?
Commercial buildings used 12% less energy per square foot in 2018 than in 2012 (EIA, Dec 2022).
- Major fuels energy intensity fell from 80.0 to 70.4 thousand Btu per square foot (EIA, Dec 2022).
- Electricity intensity fell 14% and natural gas intensity fell 11% (EIA, Dec 2022).
- Buildings over 100,000 square feet were 2% of buildings but consumed over one-third of the energy (EIA, Dec 2022).
- EIA completed the 2018 survey for 6,436 buildings (EIA, Dec 2022).
- 10,319 million square feet of US commercial floorspace was built from 2010 to 2018 (EIA, Dec 2022).
- ENERGY STAR certified buildings use 35% less energy than typical buildings nationwide (EPA ENERGY STAR, Oct 2026).
Do certified buildings cost more, and do they earn more?
The cost premium for a certified building is small and the market premium is large, but few studies tie that value to measured performance.
How much do zero energy features add to project cost?
NREL found that adding enough solar PV to go from zero energy ready to zero energy costs less than 3% of the project budget in a select group of projects (NREL, Dec 2021).
- Before 2011, the incremental cost of PV to match building energy use was more than 7% of total project costs (NREL, Dec 2021).
- State average school costs range from $205 to $495 per square foot, and in NREL’s sample project cost did not depend on energy use intensity (NREL, Dec 2021).
- Combined spending on building retrofits and envelopes in China, the United States and the EU rose over 20% since 2019, to around USD 120 billion in 2024 (IEA, Nov 2025).
What do rents, occupancy and sale prices show for commercial buildings?
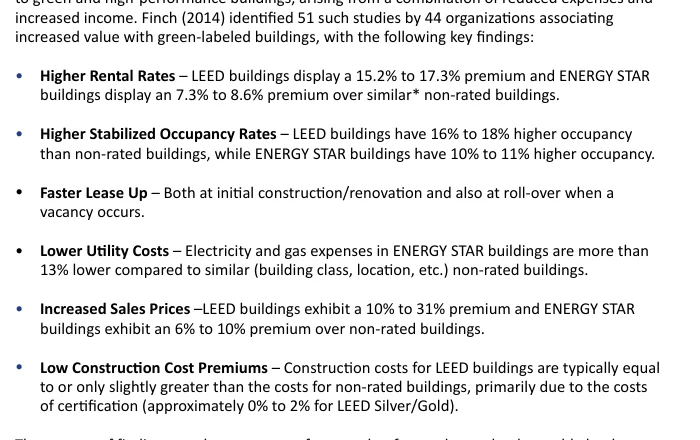
Finch identified 51 studies by 44 organizations that link higher value to green-labeled buildings (LBNL, Oct 2015).
- ENERGY STAR buildings show a rent premium of 7.3% to 8.6% over similar non-rated buildings (LBNL, Oct 2015).
- LEED buildings have 16% to 18% higher occupancy, and ENERGY STAR buildings 10% to 11% higher (LBNL, Oct 2015).
- Electricity and gas expenses in ENERGY STAR buildings are more than 13% lower than in similar non-rated buildings (LBNL, Oct 2015).
- LEED buildings show a sale price premium of 10% to 31%, and ENERGY STAR buildings 6% to 10% (LBNL, Oct 2015).
- EPA says studies find ENERGY STAR certified buildings command a premium of up to 16% for sale prices and rental rates (EPA ENERGY STAR, Oct 2026).
Do green homes sell for more?
Homes with a green rating sold for a 12% premium on average in a California study of more than 4,000 green homes and 1.6 million control homes (LBNL, Oct 2015).
- The premium was 8.7% for homes built in the five years before that study (LBNL, Oct 2015).
- LEED for Homes and GreenPoint did not show a statistically significant price difference on their own (LBNL, Oct 2015).
- A study of 170,000 home sales from 2005 to 2011 found no significant price effect for ENERGY STAR homes built after 2006 (LBNL, Oct 2015).
- Local certifications corresponded to price increases of 9% to 20% in Austin and 5% to 12% in Portland (LBNL, Oct 2015).
- Practicing appraisers valued 26 Denver homes and found a value increment of 1% to 15% for green and high-performance features (LBNL, Oct 2015).
- In Portland, 92 certified homes achieved a 4.2% value difference and sold 18 days faster than comparison homes (LBNL, Oct 2015).
- In Seattle, 68 certified homes achieved a 9.6% value difference (LBNL, Oct 2015).
- One appraiser said fewer than one-half of 1% of the homes he had appraised were green (LBNL, Oct 2015).
How common are zero energy and ultra low energy buildings?
Zero energy used to mean a showpiece. School districts are now building it on ordinary budgets and publishing the meter data.
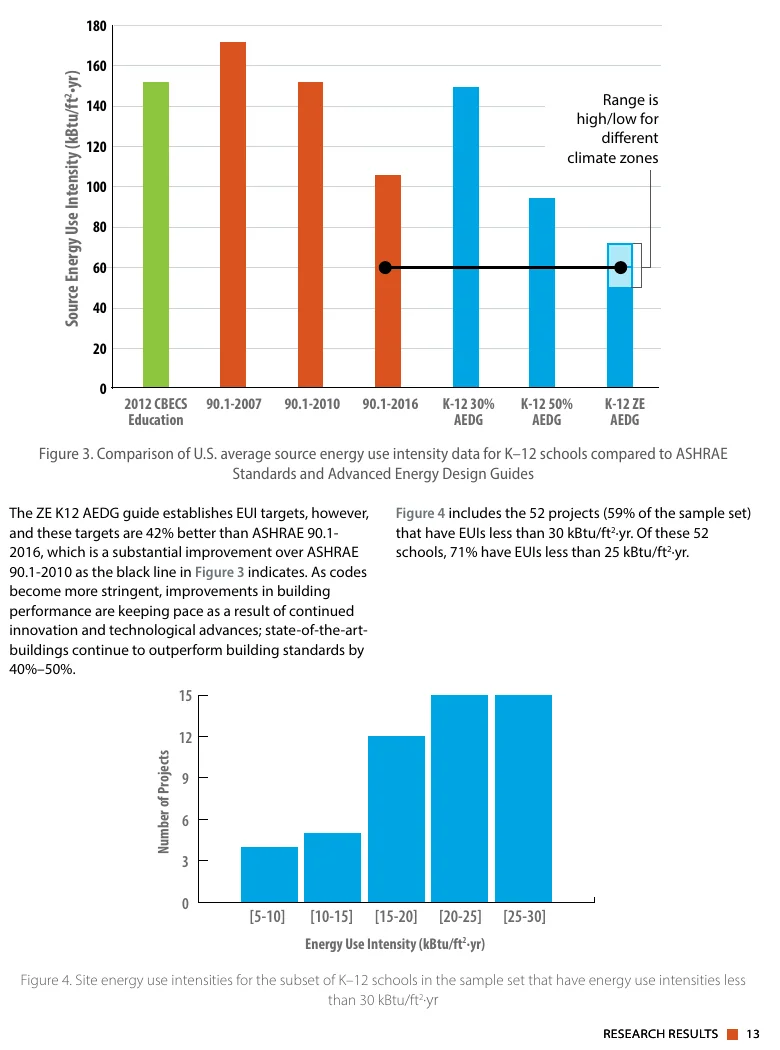
How many zero energy schools has NREL tracked?
NREL narrowed roughly 150 schools to 88 with cost, energy use intensity and location data (NREL, Dec 2021).
- Of the 52 schools under 30 kBtu per square foot per year, 71% were under 25 (NREL, Dec 2021).
- The zero energy K-12 design guide sets targets 42% better than ASHRAE 90.1-2016 (NREL, Dec 2021).
- State-of-the-art buildings continue to outperform building standards by 40% to 50% (NREL, Dec 2021).
- Jennings Creek Elementary in Kentucky cost $1.5 million less to build than the average Kentucky school (NREL, Dec 2021).
- The same school saves more than $195,000 a year in energy costs compared with a conventional school (NREL, Dec 2021).
- NREL reported that California had set a target of making all new commercial buildings zero energy by 2030 (NREL, Dec 2021).
What do building energy codes require and return?
Codes set the floor, and about half the world still has no floor at all. Where codes exist, the US analyses show they pay back.
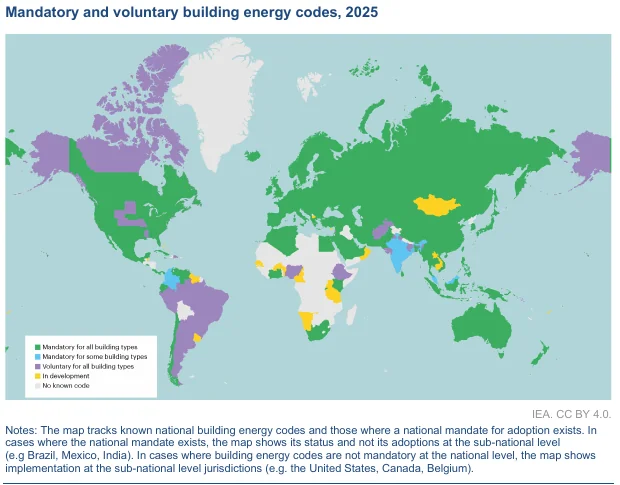
How many countries have mandatory building energy codes?
As of mid-2025, there were 95 mandatory building energy codes or standards for residential buildings and 97 for non-residential buildings (IEA, Nov 2025).
- Around half of all countries do not have mandatory energy efficiency requirements for buildings (IEA, Nov 2025).
- Eight governments implemented new or updated building energy codes in 2025 (IEA, Nov 2025).
- At least 60 building energy codes had mandatory requirements for space cooling in residential buildings (IEA, Nov 2025).
- Seventeen countries published national cooling action plans that contain passive cooling elements (IEA, Nov 2025).
- Building energy codes apply to around half of new floor area in emerging market and developing economies (IEA, Nov 2025).
What do US model codes save per project?
ASHRAE 90.1-2022 saves a weighted $2.58 per square foot in net life-cycle cost compared with the 2019 edition (PNNL, Dec 2024).
- The weighted simple payback for 90.1-2022 is 6.1 years (PNNL, Dec 2024).
- The standalone retail prototype pays back in 4.6 years and the small office in 7.5 years (PNNL, Dec 2024).
- The analysis covers six prototype buildings in five climate locations, for 30 cost-effectiveness assessments (PNNL, Dec 2024).
- The 2024 IECC has a national weighted average simple payback of 2.5 years against the 2021 IECC (PNNL, Jan 2025).
- Homeowners see net positive cash flow after a national weighted average of 1 year (PNNL, Jan 2025).
- The average net annual cash flow saving in year one is $144 (PNNL, Jan 2025).
What does the EU now require?
For non-residential buildings, the revised EU directive triggers renovation of the 16% worst-performing buildings by 2030 and the 26% worst-performing by 2033 (European Commission, Oct 2026).
- Life-cycle global warming potential must be disclosed in energy certificates from January 2028 for new buildings over 1,000 square metres, and from January 2030 for all new buildings (European Commission, Oct 2026).
- Around 50% of the EU’s gas consumption is attributable to buildings (European Commission, Oct 2026).
- The EU construction industry employs almost 25 million people (European Commission, Oct 2026).
Are certified buildings better for the people inside?
Certification does not guarantee happier occupants. Some studies find large gains and others find almost none, and the honest answer sits between them.
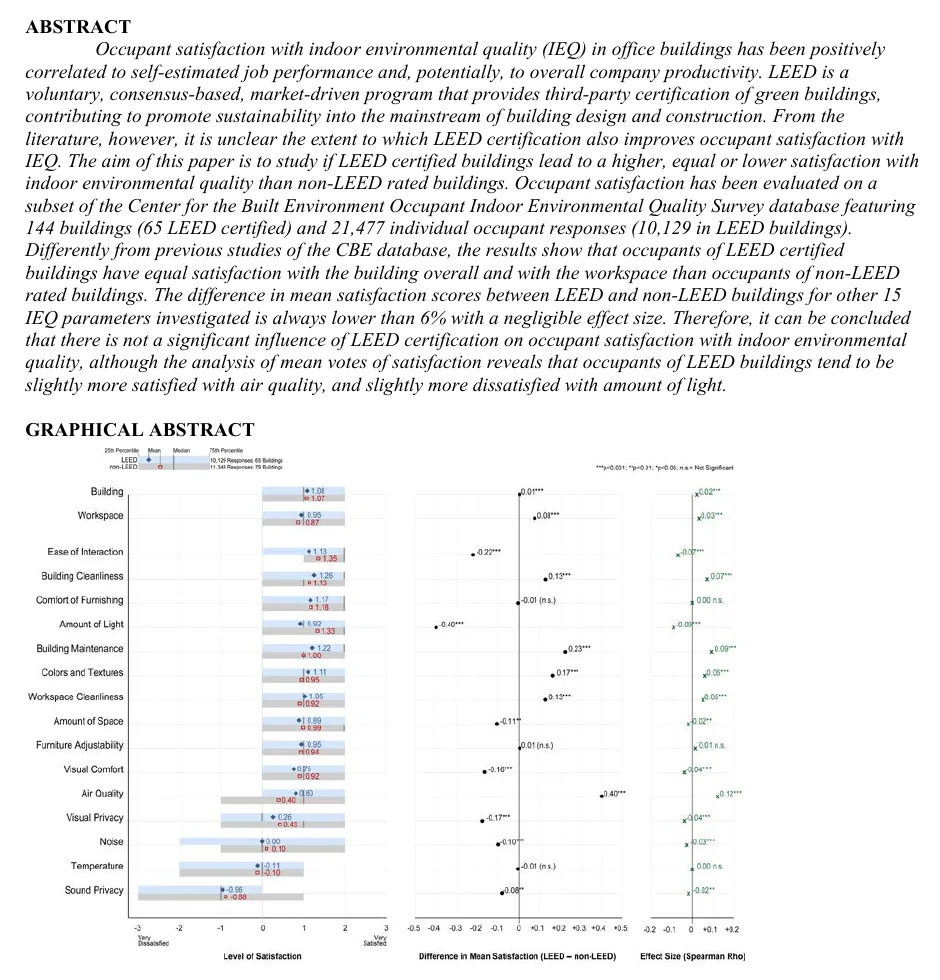
Do occupants of LEED offices rate their buildings higher?
A Berkeley survey database held 144 buildings, 65 of them LEED certified (UC Berkeley CBE, Jun 2013).
- The analysis used 21,477 occupant responses, 10,129 of them from LEED buildings (UC Berkeley CBE, Jun 2013).
- For 15 other indoor environment factors, the difference in mean satisfaction between LEED and non-LEED buildings was always lower than 6% (UC Berkeley CBE, Jun 2013).
- Occupants of the 22 federal buildings in the PNNL study reported general satisfaction 27% higher than the 50th percentile of the same Berkeley database (PNNL, Sep 2011).
Do workers in certified buildings score higher on tests?
In one matched study, yes. It recruited 109 participants from 10 high-performing buildings in five US cities, and the certified buildings came out ahead (MacNaughton et al., Building and Environment, Nov 2016).
- Workers in green certified buildings had 30% fewer sick building symptoms (MacNaughton et al., Building and Environment, Nov 2016).
- Participants in green certified buildings had 6.4% higher sleep scores (MacNaughton et al., Building and Environment, Nov 2016).
- Better ventilation and fewer indoor pollutant sources can reduce sick building syndrome by up to 70% to 85% (SGBC, Oct 2026).
How much carbon do buildings carry before and after they open?
Running a building is only part of its carbon. The materials and the construction carry a share that is paid before the doors open.
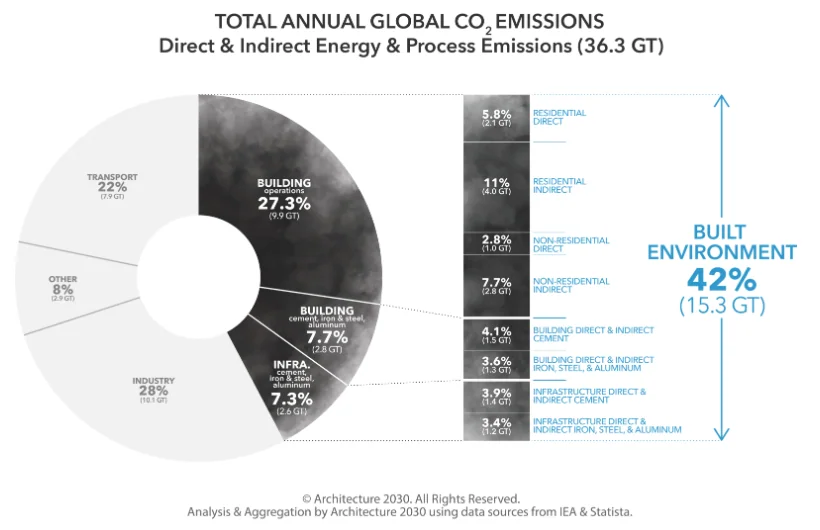
What share of global emissions comes from buildings?
The built environment is responsible for about 42% of annual global CO2 emissions, or 15.3 gigatonnes of 36.3 (Architecture 2030, Oct 2026).
- Building operations account for 27.3% of annual global CO2, or 9.9 gigatonnes (Architecture 2030, Oct 2026).
- Cement, iron, steel and aluminum used in buildings add 7.7%, or 2.8 gigatonnes (Architecture 2030, Oct 2026).
- The world is expected to add about 2.6 trillion square feet of floor area from 2020 to 2060 (Architecture 2030, Oct 2026).
- Upfront carbon will be responsible for half of the entire carbon footprint of new construction between now and 2050 (WorldGBC, Oct 2026).
- WorldGBC’s vision is at least 40% less embodied carbon in all new buildings, infrastructure and renovations by 2030 (WorldGBC, Oct 2026).
- The built environment is responsible for 25% of the UK’s greenhouse gas emissions (UKGBC, Oct 2026).
- Embodied carbon makes up 20% of UK built environment emissions (UKGBC, Oct 2026).
- Construction, demolition and excavation account for 60% of material use and waste generation in the UK (UKGBC, Oct 2026).
What does one LEED building’s embodied carbon look like?
Argonne National Laboratory estimated total embodied emissions of about 817 metric tons, or about 538 kilograms per square metre, for a LEED-certified public library in Chicago (Argonne National Laboratory, Dec 2021).
- The embodied emissions payback period was 0.9 to 2.6 years, depending on the baseline used (Argonne National Laboratory, Dec 2021).
- Per square metre, the library’s embodied emissions were 22% to 99% higher than baseline emissions (Argonne National Laboratory, Dec 2021).
- Adding the mechanical, electrical and plumbing system added approximately 67 metric tons, or 8% of the total (Argonne National Laboratory, Dec 2021).
- Annual refrigerant emissions from production, leakage and end-of-life loss were estimated at about 3.7 metric tons, or 8.4% of the library’s annual operational emissions excluding refrigerants (Argonne National Laboratory, Dec 2021).
Why does HVAC sizing decide how well a high performance building works?
A tight envelope cuts the load. If the equipment is still sized for the old load, the building pays for capacity it never uses and runs it badly.
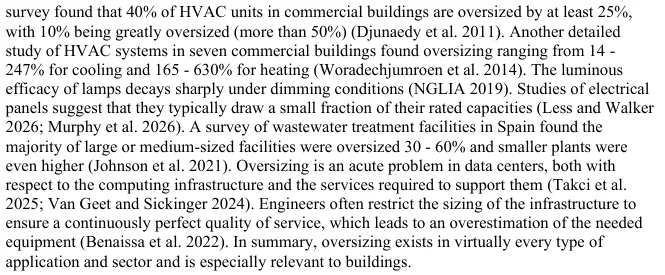
How often is HVAC equipment oversized?
In the same survey, 10% of commercial HVAC units were greatly oversized, by more than 50% (LBNL, Aug 2026).
- A study of HVAC systems in seven commercial buildings found oversizing of 14% to 247% for cooling and 165% to 630% for heating (LBNL, Aug 2026).
- A device oversized by 40% sees a maximum load of about 71% of its capacity (LBNL, Aug 2026).
- When the load falls to half of peak, the part-load factor of that device falls to about 36% (LBNL, Aug 2026).
Does a better envelope mean smaller equipment?
It can. In PNNL’s analysis of ASHRAE 90.1-2022, the mid-rise apartment in New York had a scalar ratio of -0.47, and PNNL notes that a negative ratio means net costs fell, for example from reductions in HVAC capacity (PNNL, Dec 2024).
A load calculation, not a rule of thumb, is what lets that saving show up. The free BTU calculator gives a first estimate of the heating and cooling load, and the AC tonnage calculator turns a cooling load into tons. Both give estimates, not a full room-by-room design.
Methodology and Sources
Every number comes from the group that produced it: government agencies, national laboratories, rating bodies, standards bodies and peer-reviewed or university-hosted studies. Each link was opened and read before the number was written down. Pages that show live counters, such as rating body home pages, are dated to the month the page was read, and the text says what the counter measures. Premium and cost figures from older studies are shown as ranges and attributed to the review that reported them. The page is refreshed monthly.
Sources
- WorldGBC, Bringing Embodied Carbon Upfront
- USGBC, Top 10 States for LEED 2025
- USGBC, Top 10 States for LEED 2025: Massachusetts
- USGBC, Top 10 States for LEED 2025: Illinois
- USGBC, Top 10 States for LEED 2025: Colorado
- USGBC, Top 10 States for LEED 2025: New York
- USGBC, Top 10 States for LEED 2025: Virginia
- USGBC, Top 10 States for LEED 2025: Washington
- USGBC, Top 10 States for LEED 2025: California
- USGBC, Top 10 States for LEED 2025: Maryland
- USGBC, Top 10 States for LEED 2025: Nevada
- USGBC, Top 10 States for LEED 2025: Georgia
- USGBC, Top 10 States for LEED 2025: District of Columbia
- USGBC, Top 10 States for LEED 2024
- USGBC, About the U.S. Green Building Council
- CAGBC, Canada Green Building Council
- IGBC, Indian Green Building Council
- BEAM Society Limited
- BRE, BREEAM marks 10 years in the U.S.
- DGNB, Important facts about DGNB Certification
- IWBI, WELL
- Phius, Passive House Institute US
- Living Future, About
- SGBC, Singapore Green Building Masterplan
- SGBC, Benefits of Green Building
- EPA ENERGY STAR, Facts and Stats for commercial buildings
- PNNL for GSA, Re-Assessing Green Building Performance
- LBNL, Evaluating the Energy Performance of the First Generation of LEED-Certified Commercial Buildings
- LBNL, Evaluation of U.S. Building Energy Benchmarking and Transparency Programs
- LBNL, Looking For Value in All The Wrong Places
- LBNL, A New Appraisal
- LBNL and DOE, Oversizing and Part-Load Problems
- EIA, 2018 CBECS Consumption and Expenditures Highlights
- EIA, CBECS Table B9, Year constructed, floorspace
- NREL, Affordable Zero Energy K-12 Schools
- IEA, Energy Efficiency 2025
- PNNL, National Cost-Effectiveness of ANSI/ASHRAE/IES Standard 90.1-2022
- PNNL, National Cost-Effectiveness of the Residential Provisions of the 2024 IECC
- European Commission, Energy Performance of Buildings Directive
- UC Berkeley Center for the Built Environment, Occupant satisfaction in LEED and non-LEED certified buildings
- MacNaughton et al., The impact of working in a green certified building on cognitive function and health
- Architecture 2030, Why The Built Environment
- UKGBC
- Argonne National Laboratory, Whole-Building Life-Cycle Analysis with a New GREET Tool