HVAC facts are easy to repeat and easy to get wrong. The story that air conditioning began with one printing plant is half true, and the number that gets quoted for a “ton” of cooling has nothing to do with weight. This page checks each one against the people who wrote the record down.
It collects 163 dated figures from the National Archives, the U.S. Senate, NIST, NASA, NOAA, the Bureau of Labor Statistics and other primary sources. Every number links to the page that holds it. The page runs from the first ice machine to the ozone treaty, from record temperatures to the cooling loops on the space station, and from the trade that installs it all to the leaks inside an ordinary home.
Each stat appears once, so scan the headings for the question you want. Some pages state a year but no publication date. For those, the date after the source is the month the page was checked. The page is refreshed every month.
Key Takeaways
- U.S. patent 808,897, “Apparatus for Treating Air,” was issued to the Buffalo Forge Company on January 2, 1906, with Willis Carrier’s drawing filed alongside it (National Archives, Jan 1906).
- Between 1916 and 1924, 22 sitting U.S. senators died, and one senator who was also a physician blamed the poor air in the Senate chamber (U.S. Senate, Aug 2021).
- In July 1881 an experimental air conditioner with an electric blower and screens wet with ice water was installed in the sick room of the wounded President Garfield (White House Historical Association, Jul 1881).
- In 1940 coal or coke heated 55 percent of U.S. homes, and by 2000 only 0.1 percent used these fuels (U.S. Census Bureau, Oct 2021).
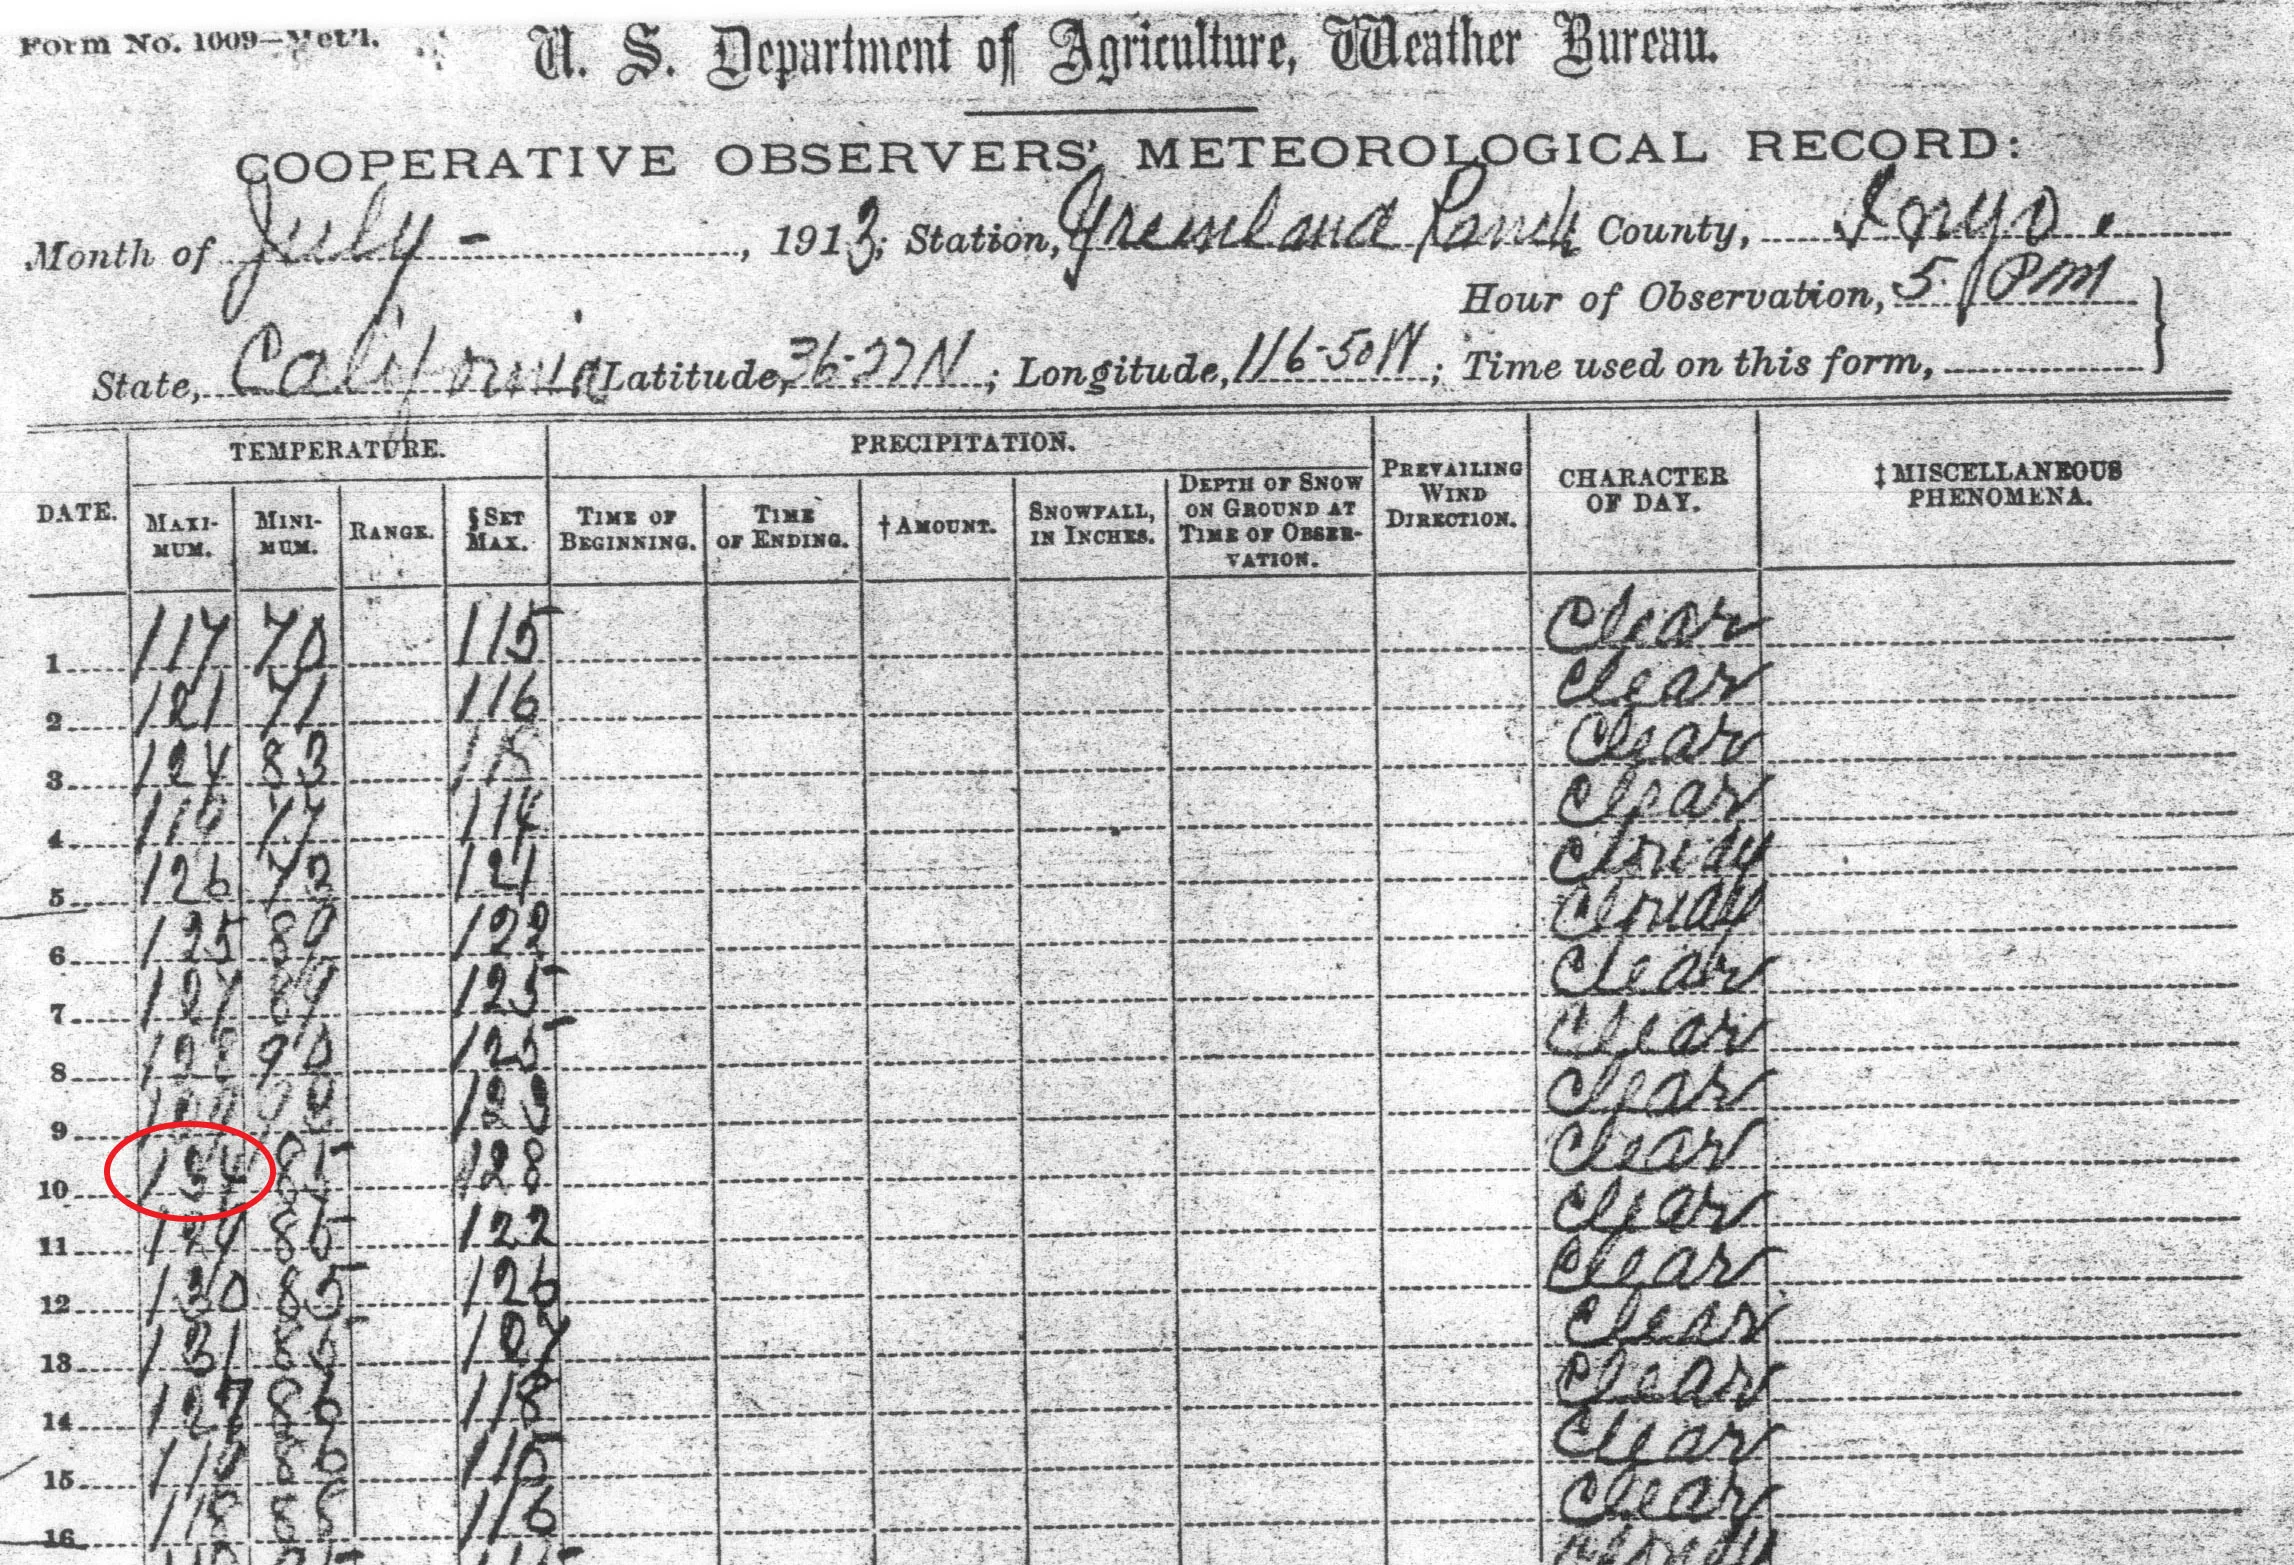
- The hottest air temperature ever recorded on Earth is 134°F, observed at Greenland Ranch in Death Valley on July 10, 1913 (NOAA NCEI, Jul 2023).
- The world’s coldest temperature is -89.2°C (-128.6°F), recorded at Vostok station in Antarctica on 21 July 1983 (WMO, Sep 2020).
- A weather station in Loma, Montana, recorded a 103°F swing in 24 hours in January 1972, from -54°F to 49°F (NOAA NCEI, Jan 1972).
- On 16 September 2009 the Montreal Protocol became one of the first two treaties in United Nations history to be ratified by every country (United Nations, Sep 2009).
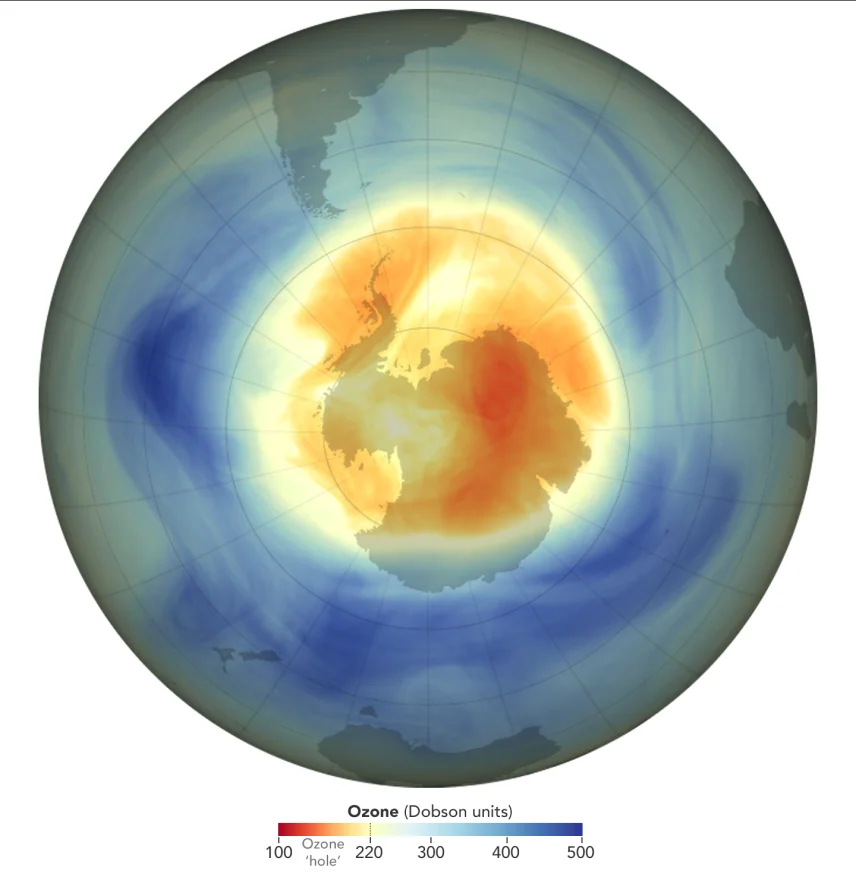
- The average 2025 Antarctic ozone hole covered about 7.23 million square miles, roughly 30 percent less than the record year of 2006 (NOAA, Nov 2025).
- One ton of refrigeration, defined as 12,000 Btu per hour, equals 3.516853 kilowatts (NIST, Aug 2025).
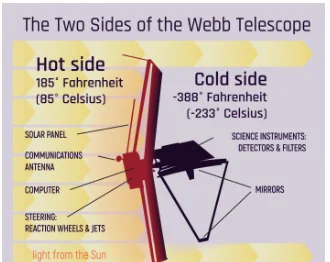
- The Webb telescope’s sunshield separates a hot side at 185°F from a cold side at -388°F (NASA, Oct 2026).
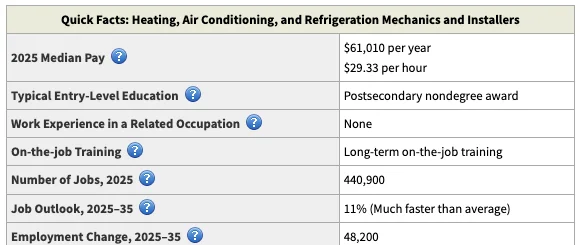
- Employment of heating, air conditioning and refrigeration mechanics and installers is projected to grow 11 percent from 2025 to 2035, much faster than the average for all occupations (BLS, Aug 2026).
- In a typical house, about 20 to 30 percent of the air moving through the duct system is lost to leaks, holes and poorly connected ducts (ENERGY STAR, Oct 2026).
- Under very hot conditions, running a car’s air conditioning can cut a conventional vehicle’s fuel economy by more than 25 percent (U.S. DOE and EPA, fueleconomy.gov, Oct 2026).
Who invented air conditioning, and when did it start?
Cooling a building did not start with one inventor in one year. A doctor in Florida, a young engineer in Buffalo and a string of builders each solved one piece, and the records show how slowly the pieces fit together.
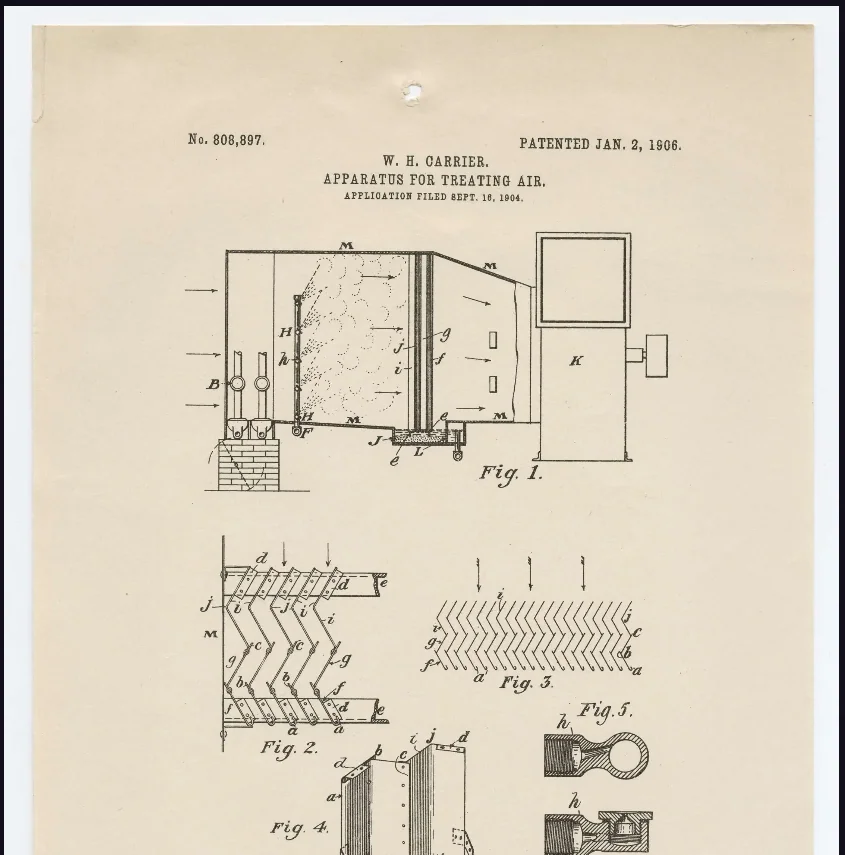
Who patented the first ice machine and the first air treatment system?
The first patents were about ice and humidity, not comfort. Comfort came later.
- Dr. John Gorrie of Florida was granted a patent in 1851 for a machine that made ice with a compressor powered by a horse, water, wind-driven sails or steam (U.S. DOE, Jul 2015).
- Willis Carrier was working for the Buffalo Forge Company in 1902 when he was asked to fix a humidity problem that made magazine pages wrinkle at a Brooklyn printing company (U.S. DOE, Jul 2015).
- Buffalo Forge set up a research lab for fans and air heating and cooling in 1902 (ASHRAE, Oct 2026).
- Carrier’s psychrometric chart was first published in a Buffalo Forge catalog in 1905 (ASHRAE, Oct 2026).
- The term “air conditioning” was coined in 1906 by Stuart Cramer (ASHRAE, Oct 2026).
- Carrier patented a “dew point control” system for controlling room humidity in 1907 (ASHRAE, Oct 2026).
- Patent 1,085,971, issued on February 3, 1914, described a method of humidifying air and controlling its humidity and temperature in textile mills (Library of Congress, Feb 1914).
When did people first feel air conditioning in a public place?
Public cooling began with big rooms that held a crowd.
- The first air-conditioned house in the U.S. was built in San Lorenzo, California, in 1892 (ASHRAE, Oct 2026).
- A 300-ton comfort cooling system was installed at the New York Exchange in 1901 (ASHRAE, Oct 2026).
- At the 1904 St. Louis World’s Fair, a system moved 35,000 cubic feet of air per minute to cool the 1,000-seat auditorium of the Missouri State Building (U.S. DOE, Jul 2015).
- The Brooklyn Bridge subway station was air conditioned in 1906 (ASHRAE, Oct 2026).
- The Boston Floating Hospital was the first air-conditioned hospital, also in 1906 (ASHRAE, Oct 2026).
- In May 1922, Carrier showed a centrifugal chiller at the Rivoli Theater in New York, a design with fewer moving parts and compressor stages than earlier units (U.S. DOE, Jul 2015).
- Rich’s Department Store in Atlanta was completely air conditioned in 1924 (ASHRAE, Oct 2026).
- Rockefeller Center was designed with air conditioning in 1931 (ASHRAE, Oct 2026).
When did air conditioning reach trains, planes, cars and homes?
Once the equipment shrank, it moved into everything that carried people.
- The Chesapeake and Ohio Railroad ran the first overnight air-conditioned train between New York and Washington in 1932 (ASHRAE, Oct 2026).
- United Air Lines used air conditioning on its “three mile a minute” passenger planes in 1936 (ASHRAE, Oct 2026).
- Packard marketed the first successful year-round auto air conditioning system in 1939 (ASHRAE, Oct 2026).
- Frigidaire introduced a split-system room cooler in 1929, shaped like a radio cabinet, but heavy and expensive (U.S. DOE, Jul 2015).
- Six air-conditioned homes were displayed at the 1934 “Century of Progress” world’s fair in Chicago (ASHRAE, Oct 2026).
- A window air conditioner design reached the market in 1932 but sold poorly because of its price (U.S. DOE, Jul 2015).
- By 1947, 43,000 window air conditioners had been sold (U.S. DOE, Jul 2015).
- By the late 1960s most new U.S. homes had central air conditioning (U.S. DOE, Jul 2015).
What are fun facts about HVAC in the U.S. Capitol and the White House?
Washington had the heat, the money and the loudest complaints, so government buildings were early test cases. The Senate’s own history office tells the story in detail.
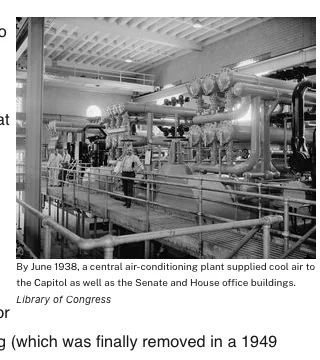
Why was the Senate chamber so hard to cool?
The chamber had no windows, a glass ceiling and gas lights. Every fix before 1929 came up short.
- The Senate wing opened in 1859 with a windowless chamber and large steam-engine powered fans that pushed outside air up through floor registers (U.S. Senate, Aug 2021).
- In June 1860, senators complained of hot, stale air in the chamber during their first summer session there (U.S. Senate, Aug 2021).
- An 1865 report named the glass ceiling as a major source of excess heat (U.S. Senate, Aug 2021).
- A stone tower built on the Capitol grounds in 1889 brought in cleaner air, but it did little to cool the room (U.S. Senate, Aug 2021).
- When the Capitol gained electricity in 1890, electric fans were placed in hallways, often blowing over blocks of ice (U.S. Senate, Aug 2021).
- An 1895 engineer’s report found that cooling 600,000 cubic feet of chamber air from 95 to 80 degrees would take 1,150 pounds of melting ice (U.S. Senate, Aug 2021).
- The 1895 renovation added a refrigerant machine, but it cooled the air by no more than five degrees (U.S. Senate, Aug 2021).
- The “bypass method” of air conditioning was first proposed in 1895 by S. Woodbridge to cool the Senate wing (ASHRAE, Oct 2026).
- Another 12 senators died in office over the four years after the 1924 resolution on the chamber’s air (U.S. Senate, Aug 2021).
When did the Capitol finally get air conditioning?
The answer came from a contract, not a vote on the chamber’s design.
- In April 1928 Senator Royal Copeland added $500,000 to an appropriations bill to rebuild the Senate chamber (U.S. Senate, Aug 2021).
- The Carrier Corporation won the 1928 contract to condition the air in both chambers, and its system went into the Hall of the House in December 1928 (U.S. Senate, Aug 2021).
- The Senate had its first air-conditioning system by August 1929 (U.S. Senate, Aug 2021).
- Air conditioning spread to the rest of the Capitol and the Senate Office Building between 1935 and 1939 (U.S. Senate, Aug 2021).
- In 1938 the Capitol and the Senate and House office buildings had the largest air conditioning system in the world, built by York Ice Machinery (ASHRAE, Oct 2026).
- The chamber’s glass ceiling was finally removed in a 1949 renovation (U.S. Senate, Aug 2021).
What did the National Archives building do about heat and health?
The Archives was one of the first Washington buildings with air conditioning, and officials asked the Surgeon General if cool air would harm the staff.
- The National Archives building’s system was designed to hold 70 degrees in winter and 80 degrees in summer throughout the building (National Archives, Aug 2012).
- Relative humidity was set at 55 percent in the stacks and 45 percent in the workrooms (National Archives, Aug 2012).
- The Surgeon General expected complaints from workers, mostly older ones, if indoor air stayed below 80 degrees while it was 95 degrees or more outside (National Archives, Aug 2012).
- The Surgeon General also wrote that no directly harmful effect on health needed to be expected (National Archives, Aug 2012).
How did people heat and cool buildings before modern systems?
For most of history, comfort meant a fire, a pit of ice or a thick wall. The shift to gas, oil and electricity is recent, and the Census Bureau can show it decade by decade.
How did people keep food and rooms cold before refrigerators?
They cut ice from lakes and stored it in pits and boxes.
- A seven-foot pit found at Jamestown is believed to be modeled on an English-style ice pit (Smithsonian National Museum of American History, Apr 2015).
- An octagon-shaped, stone-lined icehouse pit built in the 1780s was found at the site of the President’s House in Philadelphia (Smithsonian National Museum of American History, Apr 2015).
- Frederic Tudor of Boston founded the natural ice industry in 1805 (ASHRAE, Oct 2026).
- Harvesters measured ice and rejected anything under eight inches thick, because thinner ice melted too fast in transit (Smithsonian National Museum of American History, Apr 2015).
- Households used large blocks of ice in iceboxes into the 1930s (Smithsonian National Museum of American History, Apr 2015).
- An iceman delivered blocks in four sizes: 25, 50, 75 or 100 pounds (Smithsonian National Museum of American History, Apr 2015).
- In 1916 the average employee had to work 3,162 hours to pay for a refrigerator (ASHRAE, Oct 2026).
How did people heat buildings long ago?
Fire came first, then smarter ways to move the heat.
- Builders at Stonehenge about 4,500 years ago kept a well-stoked fire at the heart of the home (English Heritage, Oct 2026).
- The recreated Neolithic houses there use white chalk walls and floors that reflect sunlight and capture the heat from the fire (English Heritage, Oct 2026).
- The Roman hypocaust moved warm air through spaces under floors and between walls, and it needed a lot of labor and fuel (English Heritage, Oct 2026).
- Lullingstone Roman Villa in Kent had three heated rooms served by a purpose-built furnace (English Heritage, Oct 2026).
- Reuben Trane developed the first successful convector radiator in 1925 (ASHRAE, Oct 2026).
- Radiant panel heating was introduced in the U.S. in 1928 (ASHRAE, Oct 2026).
How fast did U.S. home heating fuels change?
The changes came in a single lifetime, and each fuel followed its own curve.
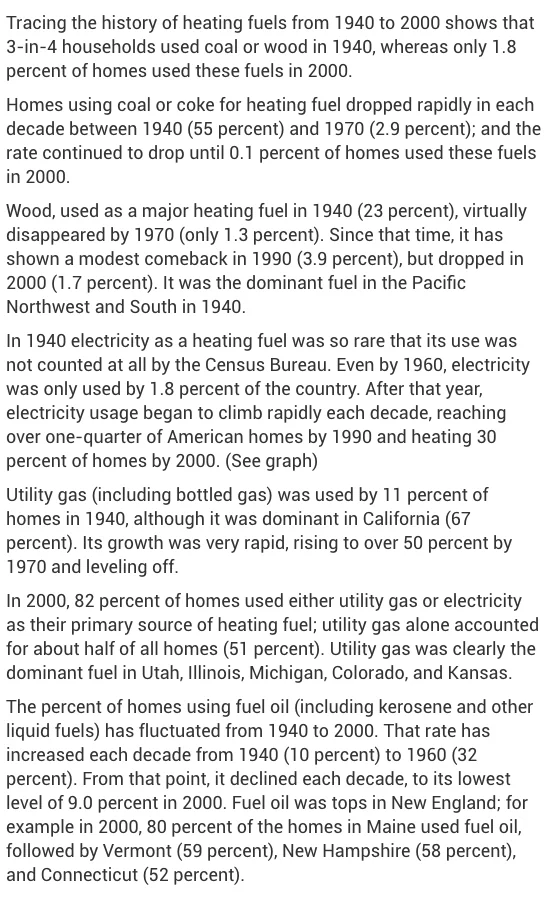
- Coal use fell to 2.9 percent of homes by 1970 (U.S. Census Bureau, Oct 2021).
- Wood heated 23 percent of homes in 1940 and only 1.3 percent by 1970 (U.S. Census Bureau, Oct 2021).
- Wood made a modest comeback to 3.9 percent in 1990 (U.S. Census Bureau, Oct 2021).
- Electricity was so rare in 1940 that the Census Bureau did not count it, and it was used by 1.8 percent of homes in 1960 (U.S. Census Bureau, Oct 2021).
- Electricity heated 30 percent of homes by 2000 (U.S. Census Bureau, Oct 2021).
- Utility gas, including bottled gas, heated 11 percent of homes in 1940 and 67 percent of homes in California (U.S. Census Bureau, Oct 2021).
- Gas passed 50 percent of homes by 1970 and then leveled off (U.S. Census Bureau, Oct 2021).
- Fuel oil grew from 10 percent of homes in 1940 to 32 percent in 1960, then fell to 9.0 percent in 2000 (U.S. Census Bureau, Oct 2021).
- In 2000, 80 percent of homes in Maine still used fuel oil (U.S. Census Bureau, Oct 2021).
- By 2000, 82 percent of homes used either utility gas or electricity as their main heating fuel (U.S. Census Bureau, Oct 2021).
How are heating and cooling power measured?
A “ton” of cooling has nothing to do with weight, and a Btu is smaller than most people guess. Here is where each unit comes from.
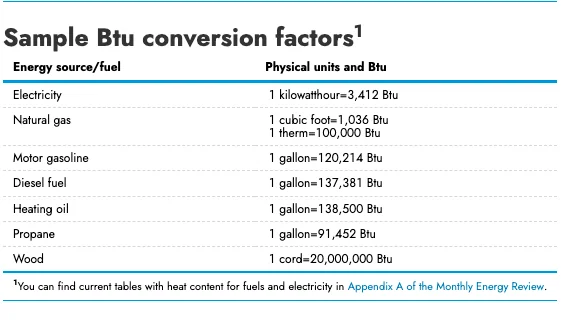
What is a Btu, and what is a ton of cooling?
A Btu is a tiny amount of heat. A ton of cooling is a rate, not a weight.
- One Btu is the heat needed to raise the temperature of one pound of water by 1°F (U.S. Energy Information Administration, Oct 2026).
- One Btu is roughly the energy released by burning a match (U.S. Energy Information Administration, Oct 2026).
- The international table Btu equals 1,055.056 joules (NIST, Aug 2025).
- In 1893 the American Society of Mechanical Engineers set up a committee to define the “standard ton of refrigeration” (ASHRAE, Oct 2026).
How do electricity, gas and wood compare in Btu?
Putting fuels in one unit makes bills and equipment comparable.
- One kilowatthour of electricity equals 3,412 Btu (U.S. Energy Information Administration, Oct 2026).
- One therm of natural gas equals 100,000 Btu (U.S. Energy Information Administration, Oct 2026).
- One cord of wood equals about 20,000,000 Btu (U.S. Energy Information Administration, Oct 2026).
- A quadrillion Btu, or one quad, is a 1 followed by 15 zeros, and national energy use is counted in quads (U.S. Energy Information Administration, Oct 2026).
When did the math of heating and cooling a building begin?
Sizing a system is an old idea. The rules of thumb came after the formulas.
- The concept of heating load calculation entered U.S. practice in 1890, introduced by consulting engineer Alfred Wolff (ASHRAE, Oct 2026).
- Wolff used a downward distribution system for conditioned air at Carnegie Hall in 1889 (ASHRAE, Oct 2026).
- The American Society of Heating and Ventilating Engineers was founded by Hugh Barron, Louis Hart and William Mackay in 1894 (ASHRAE, Oct 2026).
- Hermann Rietschel’s 1894 guide was the first HVAC engineering textbook to take a scientific approach to heating and cooling (ASHRAE, Oct 2026).
- In 1908, G. B. Wilson defined the elements of year-round air conditioning as heating, cooling, humidifying, dehumidifying and filtering (ASHRAE, Oct 2026).
- The ASHVE Guide was first published in 1922 (ASHRAE, Oct 2026).
What do refrigerants have to do with the ozone layer?
The chemicals that made home cooling safe in the 1930s are the same ones that opened a hole over Antarctica. The fix is one of the few global treaties that worked.
Why did the first safe refrigerants cause a problem?
They did not burn, and that was the point. The harm took decades to show.
- Thomas Midgley, Albert Henne and Robert McNary of General Motors synthesized CFC coolants around 1930, the first non-flammable refrigerating fluids (U.S. DOE, Jul 2015).
- The team’s CFCs were made for Frigidaire in 1928 and announced in 1930 (ASHRAE, Oct 2026).
- Albert Henne synthesized R-134a in 1936, and in the 1980s it was hailed as the best non-ozone depleting replacement for the most commonly used CFC (ASHRAE, Oct 2026).
- In 1974, Sherwood Rowland and Mario Molina warned in the journal Nature that human-made CFCs were harming the ozone layer (UNEP Ozone Secretariat, Oct 2026).
- British Antarctic Survey scientists reported the recurring springtime ozone hole in 1985 (UNEP Ozone Secretariat, Oct 2026).
How fast did the world act?
Once the proof was in, the treaty moved quickly and then kept growing.
- The Montreal Protocol was adopted on 16 September 1987 (UNEP Ozone Secretariat, Oct 2026).
- It entered into force on 1 January 1989 (UNEP Ozone Secretariat, Oct 2026).
- In 1994 the UN General Assembly proclaimed 16 September the International Day for the Preservation of the Ozone Layer (United Nations, Oct 2026).
- All four amendments to the Protocol reached universal ratification by 197 parties in 2014 (UNEP Ozone Secretariat, Oct 2026).
- A 2009 paper in PNAS found that the Protocol had averted more than 135 billion tonnes of carbon dioxide equivalent emissions (UNEP Ozone Secretariat, Oct 2026).
- The final phase-out of HCFCs is set for 2030 in developed countries and 2040 in developing countries (United Nations, Oct 2026).
How big is the ozone hole now?
It is shrinking but not gone.
- The 2025 hole was the fifth smallest since 1992, the year the Montreal Protocol began to take effect (NOAA, Nov 2025).
- The largest hole ever observed, in 2006, averaged 10.27 million square miles (NOAA, Nov 2025).
- Across 46 years of observations, the 2025 hole ranked 14th smallest (NOAA, Nov 2025).
- The 2025 hole would have been more than one million square miles larger if the stratosphere still held as much chlorine as it did 25 years earlier (NOAA, Nov 2025).
- Scientists project that the Antarctic ozone hole should recover around the late 2060s (NOAA, Nov 2025).
What are the hottest and coldest temperatures buildings face?
Heating and cooling systems are sized for ordinary extremes, but the planet’s records show how far the range can run. These readings are official and they are checked.
Is the hottest recorded temperature still the official record?
Yes, but it took a century and one rejected reading to settle.
- The World Meteorological Organization officially certified the Death Valley reading as the all-time highest surface air temperature on September 12, 2012 (NOAA NCEI, Jul 2023).
- A reading of 136°F at El Azizia, Libya, on September 13, 1922, was once certified as the world record, but later evidence showed it was invalid (NOAA NCEI, Jul 2023).
- Death Valley temperatures frequently reach or exceed 100°F from mid-May until early October (NOAA NCEI, Jul 2023).
How cold and how fast can temperatures swing?
The cold records are as wild as the hot ones.
- A weather station in Greenland recorded -69.6°C, accepted by the WMO as the Northern Hemisphere record (WMO, Sep 2020).
- The previous Northern Hemisphere low was -67.8°C, recorded at Verkhoyansk in February 1892 and Oimekon in January 1933 (WMO, Sep 2020).
- The record before Loma’s was a 100°F fall in 24 hours at Browning, Montana, on January 23 and 24, 1916 (NOAA NCEI, Jan 1972).
How much hotter can a city or a roof get?
Concrete and dark roofs add heat that the cooling system then has to remove.
- Conventional roofing materials can reach as much as 66°F warmer than the surrounding air on a warm day (EPA, Oct 2026).
- In the United States, daytime temperatures in urban areas run about 1 to 7°F higher than in outlying areas (EPA, Oct 2026).
- Electricity demand for air conditioning rises 1 to 9 percent for each 2°F increase in temperature (EPA, Oct 2026).
A system has to be sized for the hot design day, not the average one. The tonnage calculator shows what a hot design day does to the number.
How does cooling work in space?
In space there is no air to carry heat away, so every watt has to be moved by pipe and shed as radiation. Two NASA systems show how.
How does the space station get rid of its heat?
Water loops inside, ammonia loops outside.
- The internal loops use water because it is an efficient thermal transport fluid and is safe inside a habitable module (NASA, Feb 2021).
- The heated ammonia outside the station circulates through large radiators and releases its heat to space by radiation (NASA, Feb 2021).
- The U.S. Destiny Laboratory has two independent loops, a low-temperature loop and a moderate-temperature loop (NASA, Feb 2021).
- The low-temperature loop is designed to run at 40°F (4°C) (NASA, Feb 2021).
- The moderate-temperature loop normally runs at 63°F (17°C) (NASA, Feb 2021).
- The low-temperature loop holds about 63 liters of fluid (NASA, Feb 2021).
- The moderate-temperature loop holds about 200 liters (NASA, Feb 2021).
- When the station is fully assembled, nine separate water loops will serve the U.S. and international partner modules (NASA, Feb 2021).
- The photovoltaic thermal control system can dissipate an average of 6,000 watts of heat per orbit (NASA, Feb 2021).
How does the Webb telescope stay cold?
It uses a sunshield first and a small cooler second.
- The sunshield cuts the temperature difference between the hot and cold side of the spacecraft by about 570°F (299°C) across its five layers (NASA, Oct 2026).
- Each of the five layers is thinner than a human hair and is made of Kapton coated with a reflective metal (NASA, Oct 2026).
- The sunshield is roughly the size of a tennis court, 69.5 feet by 46.5 feet (NASA, Oct 2026).
- Webb orbits the Sun 1.5 million kilometers from the Earth (NASA, Oct 2026).
- Webb launched on December 25, 2021 (NASA, Dec 2021).
- Three of Webb’s four instruments use detectors that work best at 37 kelvin (NASA, Oct 2026).
- The fourth, the mid-infrared instrument, needs detectors at less than 7 kelvin, which passive cooling alone cannot reach (NASA, Oct 2026).
- That instrument operates at no more than 6.7 degrees above absolute zero, or minus 448°F (NASA, Oct 2026).
- Webb’s cryocooler is a heat pump with a precooler that makes about a quarter of a watt of cooling at about 14 kelvin, using helium gas (NASA, Oct 2026).
How big is the HVAC trade, and what does it pay?
The trade that installs and repairs all of this is large, growing and well paid, and it carries real physical risk. The Bureau of Labor Statistics tracks it closely.
How many HVAC technicians are there, and how fast is the trade growing?
There are well over 400,000 jobs, and demand comes from retirements as much as from new systems.
- Heating, air conditioning and refrigeration mechanics and installers held about 440,900 jobs in 2025 (BLS, Aug 2026).
- BLS projects employment to rise by 48,200 jobs from 2025 to 2035 (BLS, Aug 2026).
- About 40,600 openings are projected each year, on average, over the decade (BLS, Aug 2026).
- Plumbing, heating and air-conditioning contractors employed 68 percent of these workers in 2025 (BLS, Aug 2026).
- Self-employed workers made up 6 percent of the trade (BLS, Aug 2026).
How do people become HVAC technicians?
Most learn on the job after a short program or an apprenticeship.
- Technical school and community college programs generally last from 6 months to 2 years (BLS, Aug 2026).
- An apprenticeship usually lasts several years and mixes paid on-the-job training with technical instruction (BLS, Aug 2026).
- HVAC technicians have one of the highest rates of injuries and illnesses of all occupations (BLS, Aug 2026).
- The EPA requires nearly all HVAC technicians to be certified in proper refrigerant handling (BLS, Aug 2026).
- Section 608 certification credentials do not expire (EPA, Oct 2026).
- Section 608 tests must be given by an EPA-approved certifying organization (EPA, Oct 2026).
What do HVAC technicians earn, and where do they work?
Pay varies a lot by industry and by state.
- The median annual wage was $61,010 in May 2025 (BLS, Aug 2026).
- The lowest 10 percent earned less than $40,050 and the highest 10 percent earned more than $95,210 (BLS, Aug 2026).
- Wholesale trade paid the highest median wage among the top industries listed, at $71,190 in May 2025 (BLS, Aug 2026).
- Florida had the most employed in the trade, at 37,370 in May 2023 (BLS, May 2023).
- Delaware had the highest concentration, at 4.23 jobs per thousand in May 2023 (BLS, May 2023).
- Scheduled air transportation was the top paying industry in May 2023, with an annual mean wage of $99,380 (BLS, May 2023).
- Natural gas distribution followed with an annual mean wage of $90,620 (BLS, May 2023).
What surprising facts about HVAC hide inside a home?
The biggest losses are usually out of sight, in ducts and filters and the way people use the system. A few facts here point to small fixes.
How much do ducts, filters and fans change a cooling bill?
Small parts decide big results.
- Leaky ducts can reduce heating and cooling system efficiency by as much as 20 percent (ENERGY STAR, Oct 2026).
- Air loss through ducts accounts for about 30 percent of a cooling system’s energy consumption (U.S. DOE, Nov 2016).
- Ceiling fans let you raise the thermostat setting about 4 degrees without affecting comfort (U.S. DOE, Nov 2016).
- Routinely replacing or cleaning air filters can lower an air conditioner’s energy consumption by 5 to 15 percent (U.S. DOE, Nov 2016).
If a home has rooms that never cool or heat well, check the ducts before you size up. The ductulator checks duct sizes against airflow.
What famous outbreak was linked to an air conditioning system?
A building’s cooling system became a medical mystery.
- In 1976, CDC received a report of an outbreak of a mystery illness in Pennsylvania, the first new infectious disease challenge of its kind for the agency (CDC, Oct 2026).
- Most of the people affected had attended the American Legion convention at the Bellevue-Stratford hotel in Philadelphia (CDC, Oct 2026).
- The bacterium was named Legionella pneumophila after the Legionnaires’ convention (CDC, Oct 2026).
- Investigators suspected the hotel’s air conditioning system, and the CDC museum displays a jug of chiller water taken from the hotel’s cooling system during the investigation (CDC, Oct 2026).
- Since 1976, agencies around the world have set more stringent cleaning and hygiene standards for cooling towers and large air-conditioning systems (CDC, Oct 2026).
Glossary
- Btu: British thermal unit, the heat needed to raise one pound of water by 1°F.
- CFC: chlorofluorocarbon, an early refrigerant that harms the ozone layer.
- HCFC: hydrochlorofluorocarbon, a refrigerant being phased out under the Montreal Protocol.
- HVAC: heating, ventilation and air conditioning.
- HVACR: heating, ventilation, air conditioning and refrigeration.
- ASHRAE: American Society of Heating, Refrigerating and Air-Conditioning Engineers.
- NIST: National Institute of Standards and Technology.
- WMO: World Meteorological Organization.
- Ton of refrigeration: a rate of cooling equal to 12,000 Btu per hour, not a weight.
Methodology and Sources
Each figure comes from the body that produced it: a government agency, a national archive, a standards institute, an international treaty body, a laboratory or a professional society for its own timeline. Roundups and listicles were not used. Every link was opened and the number was read on the page before it was kept. Some sources were checked for a newer edition, and the live Bureau of Labor Statistics handbook page replaced the older cached figures. Where a source gives a publication or revision date, that date follows the link. Where a page states a year but no publication date, the date is the month the page was checked, and the year of the event is in the sentence. Historical facts come from the people who recorded them. The page is refreshed every month.
Sources
- National Archives
- U.S. Senate
- White House Historical Association
- U.S. Census Bureau
- NOAA NCEI
- WMO
- NOAA NCEI
- United Nations
- NOAA
- NIST
- NASA
- BLS
- ENERGY STAR
- U.S. DOE and EPA, fueleconomy.gov
- U.S. DOE
- ASHRAE
- Library of Congress
- National Archives
- Smithsonian National Museum of American History
- English Heritage
- U.S. Energy Information Administration
- UNEP Ozone Secretariat
- EPA
- NASA
- NASA
- NASA
- EPA
- BLS
- ENERGY STAR
- U.S. DOE
- CDC