Heat pump statistics tell two stories at once. In several large markets, heat pumps already outsell gas heating equipment. Across the world, they still heat a small share of buildings.
The market is not a straight line. Sales peaked in 2022, slid for two years, and turned up again in Europe in 2025 and 2026. The US sold fewer units in 2025, yet heat pumps still beat gas furnaces. This page tracks adoption, sales, efficiency, cost and cold-climate performance from primary sources only: agencies, regulators, national labs and trade bodies that collect the data themselves.
Every number below is dated and linked to the report that published it. We refresh the page every month. For the wider energy picture, see HVAC energy consumption.
Key Takeaways
- US heat pump sales in 2025 were around 12% higher than sales of fossil fuel heating systems (IEA, Jul 2026).
- Heat pumps heated 483,000 of the 1,005,000 new single-family homes finished in the US in 2025, or 48% (U.S. Census Bureau, May 2026).
- In Germany, heat pumps were the main heat source in 77.9% of new single-family houses finished in 2025 (Destatis, Jun 2026).
- Global heat pump sales fell about 2% in 2025, while European sales rose 11% (IEA, Apr 2026).
- Heat pumps avoided about 53 billion cubic metres of gas use in Europe, Japan and China in 2025 (IEA, Jul 2026).
- Europe has 29.3 million installed heat pumps (EHPA, Jul 2026).
- Sales in 12 European countries rose 11% in the first half of 2026, to 1,163,000 units (EHPA, Sep 2026).
- In field tests of cold-climate heat pumps, the median COP in the 0 to 5°F bin was 1.9 (PNNL, Jan 2025).
- Heat pumps heated 63% of new single-family homes finished in the US South in 2025 (U.S. Census Bureau, May 2026).
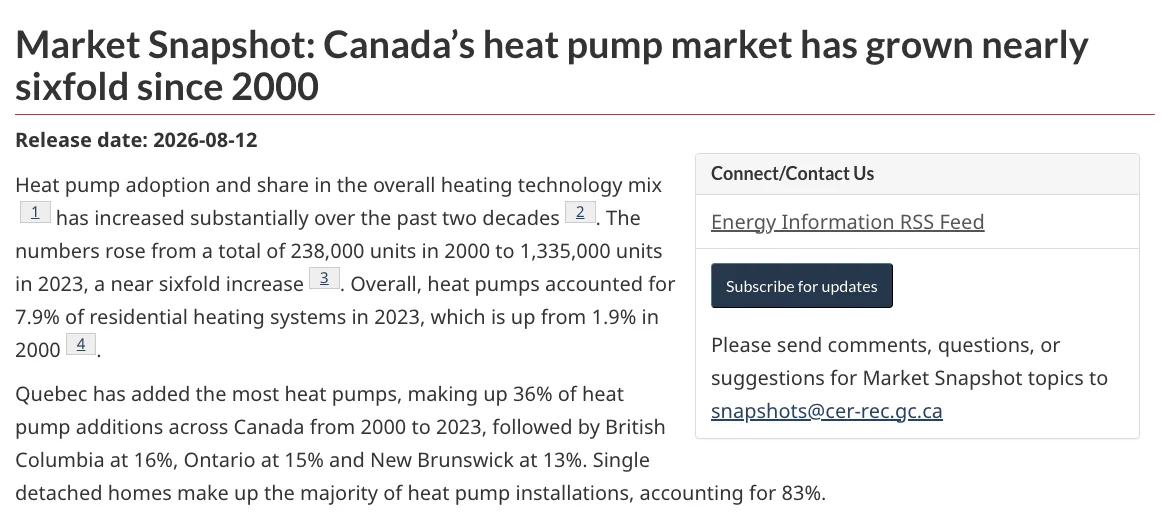
- Canada’s heat pump stock grew from 238,000 units in 2000 to 1,335,000 in 2023 (CER, Aug 2026).
- Heat pumps are 3 to 5 times more efficient than natural gas boiler alternatives (IEA, Jul 2026).
- The median cost of an air-source heat pump installed under the UK Boiler Upgrade Scheme was £13,041 in 2025/26 (Nesta, Apr 2026).
Heat Pump Adoption Around the World
Heat pumps heat a small share of the world, and the gap between countries is wide. The Nordic countries show how far adoption can go. Most other regions are still early.
How much of the world’s heating comes from heat pumps?
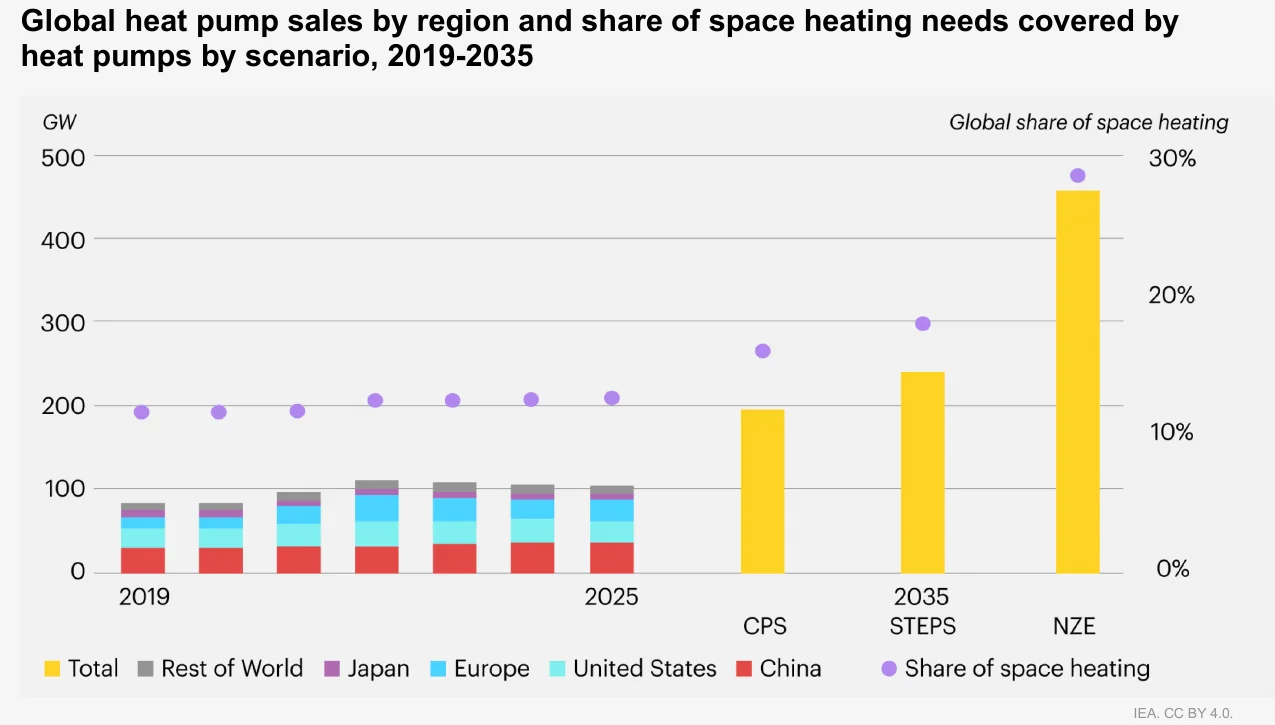
Heat pumps supplied around 5% of global heating needs in 2024, across buildings, industry and district heating (IEA, Jul 2026).
- In buildings alone, heat pumps covered about 12% of space heating needs worldwide (IEA, Jul 2026).
- Heat pumps met 6% of space heating needs in Europe, 8% in China and 28% in Japan in 2024 (IEA, Jul 2026).
- Heat pumps installed in Chinese buildings total more than 250 GW and cover around 4% of building heating needs there (IEA, Mar 2024).
- Heat pumps made up 8% of heating equipment sales for buildings in China in 2022 (IEA, Mar 2024).
Which countries use the most heat pumps?
Norway leads: 60% of its buildings are equipped with heat pumps, with Sweden and Finland above 40% (IEA, Nov 2022).
- Japan shipped its 10 millionth CO2 heat pump water heater, the Eco Cute, by March 2025 (HPTCJ, May 2025).
- The HPTCJ chairman called that total a milestone in a potential market of 60 million Japanese households (HPTCJ, May 2025).
- Eco Cute units hold close to 15% of the Japanese residential water heating market (IEA, Jul 2026).
How big could heat pump adoption get by 2035?
Under stated policies, global heat pump sales more than double by 2035 and cover about 20% of space heating needs (IEA, Jul 2026).
- Under current policies only, sales rise about 80% above 2025 levels by 2035 (IEA, Jul 2026).
- Commercially available industrial heat pumps could already supply up to about 20% of global industrial heat demand (IEA, Jul 2026).
Heat Pump Sales: Peak, Dip and Recovery
Sales hit a record in 2022 and have not come back to it. The dip was real, but the market is not shrinking everywhere. Europe is growing again and the US is still ahead of gas.
What happened to global heat pump sales?
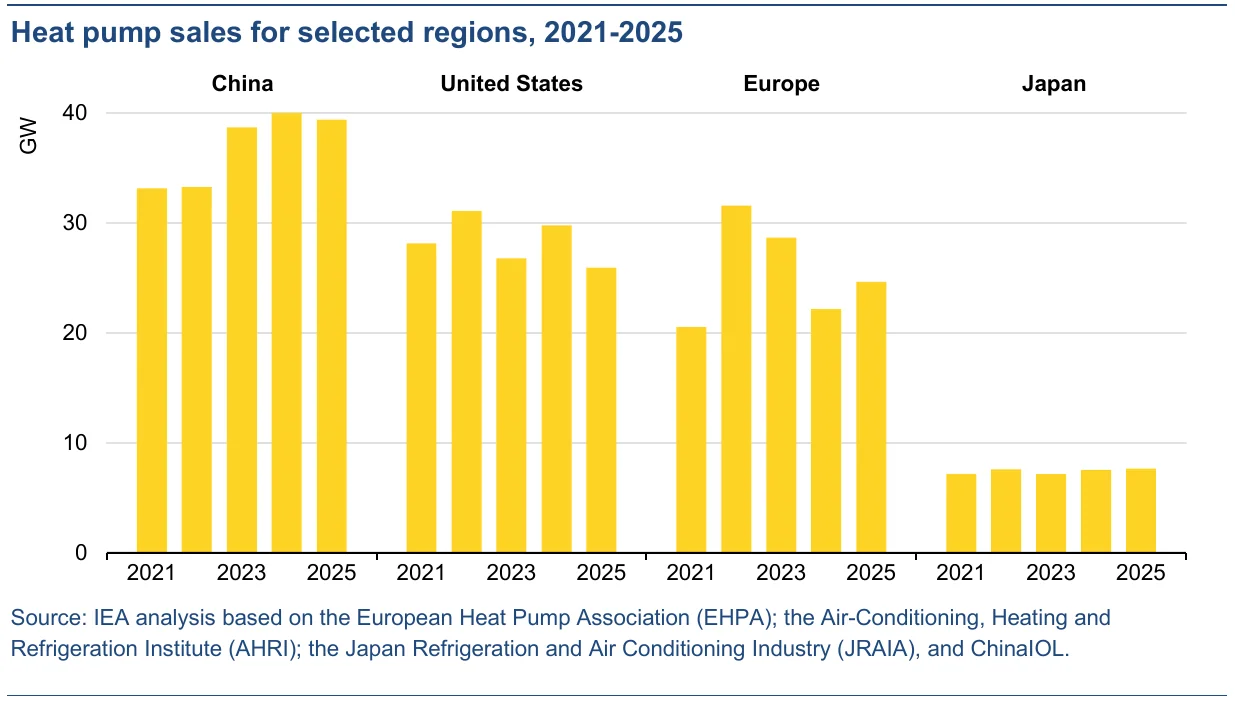
Global heat pump sales slipped from 111 GW in 2023 to 107 GW in 2025 (IEA, Apr 2026).
- Sales peaked in 2022, slowed in 2023 and 2024, and stabilised in 2025 (IEA, Jul 2026).
- Europe accounts for over 20% of global heat pump sales (IEA, Jul 2026).
- China holds more than one-quarter of global sales, and in 2023 it was the only major market where sales grew, by 12% (IEA, Mar 2024).
- Reversible air conditioners used as primary heating make up about half of the Chinese heat pump market (IEA, Apr 2026).
Why did US and German heat pump sales move in opposite directions?
US sales fell about 13% in 2025, after manufacturers rushed older models to market in 2024 ahead of the switch to A2L refrigerants (IEA, Apr 2026).
- German sales rose 55% in the first half of 2025, and 2025 was the first year heat pumps outsold gas boilers there (IEA, Apr 2026).
How did European heat pump sales change from 2012 to 2025?
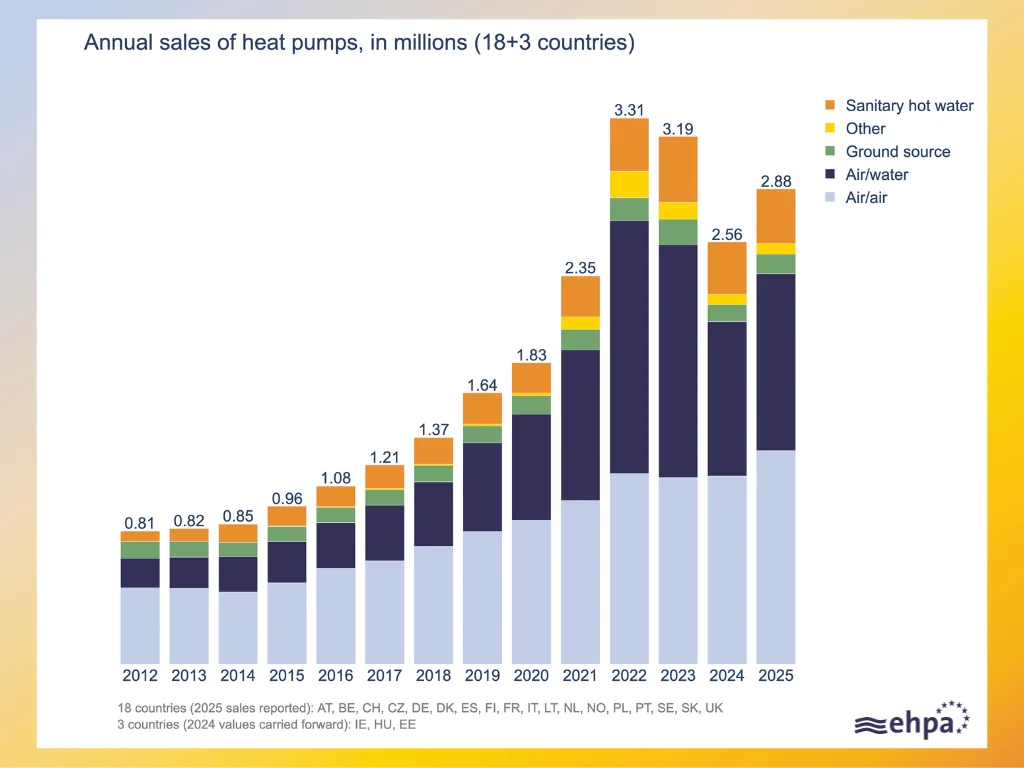
Annual European sales grew from 0.81 million units in 2012 to a peak of 3.31 million in 2022 across 21 countries (EHPA, Jul 2026).
- Sales then fell to 2.56 million in 2024 and recovered to 2.88 million in 2025 (EHPA, Jul 2026).
- Sales dropped 21% in 14 European countries in 2024, from 2.8 million to 2.2 million units (EHPA, Feb 2025).
- In the first half of 2025, sales in 13 countries rose 9%, from 898,000 to 980,000 units (EHPA, Oct 2025).
Heat Pump Adoption in the United States
Heat pumps now outsell gas heating equipment in the US. New homes led the shift, and the air conditioner replacement cycle is the next lever. The change is strongest in the South.
How many US homes use a heat pump?
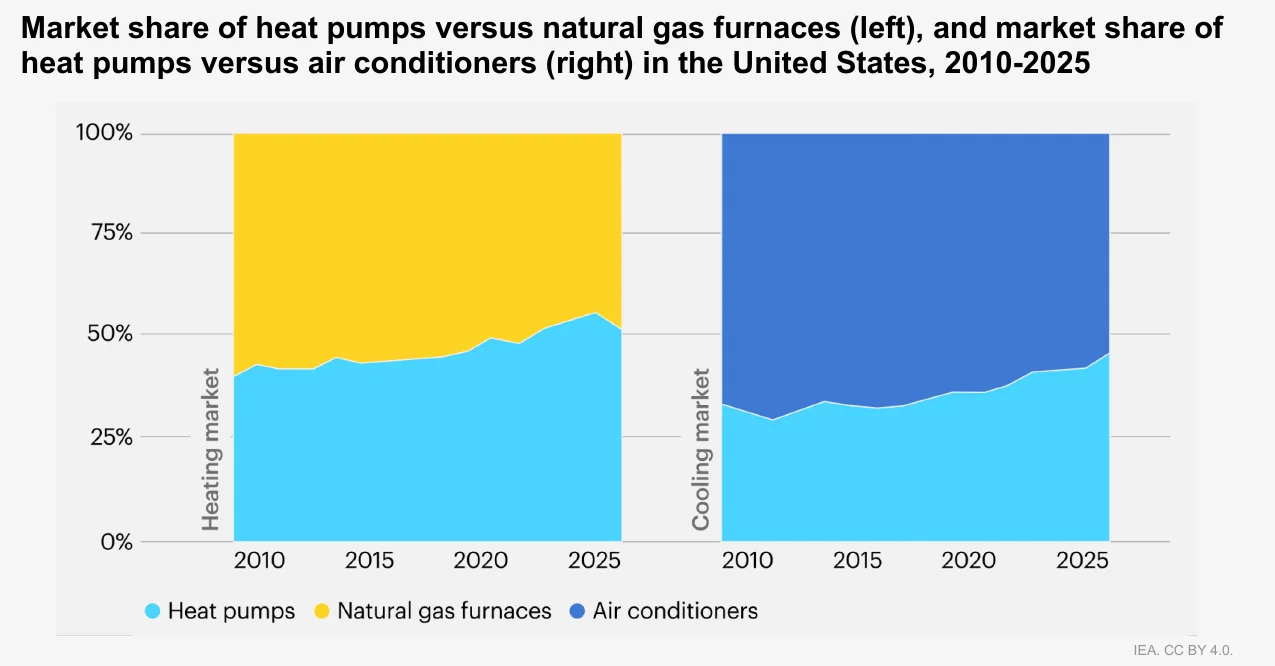
Over 20% of US households now rely on a heat pump as their primary heating equipment (IEA, Jul 2026).
- Central warm-air furnaces were still the main heating equipment in 74.42 million US homes in 2020 (EIA, Mar 2023).
- Heat pumps were the main heating equipment in 10.01 million single-family detached homes, 2.87 million apartments in large buildings and 1.58 million mobile homes (EIA, Mar 2023).
- Another 1.06 million homes used a ductless mini-split heat pump as main heating (EIA, Mar 2023).
- Between 2005 and 2015, the share of heated homes using a heat pump rose from 8% to 12% (EIA, May 2019).
How do US heat pump shipments compare with furnaces?
In December 2025, US makers shipped 219,529 air-source heat pumps, down 2.4% from December 2024 (AHRI, Feb 2026).
- Gas warm air furnace shipments rose 4.1% in 2025, to 3,247,426 units (AHRI, Feb 2026).
- Oil warm air furnace shipments rose 9.2% to 32,799 units, a tiny market next to either gas or heat pumps (AHRI, Feb 2026).
- US makers shipped 3,616,632 heat pumps in 2023, the base year before the 2024 refrigerant rush (AHRI, Feb 2026).
Are new US homes built with heat pumps?
In 2024, 45% of new single-family homes had a heat pump, or 463,000 of 1,019,000 homes (U.S. Census Bureau, May 2026).
- The heat pump share of new single-family homes was 25% in 1978 and 38% in 2010 (U.S. Census Bureau, May 2026).
- In 2025, heat pumps heated 14% of new homes in the Northeast and 7% in the Midwest (U.S. Census Bureau, May 2026).
- Among new multifamily buildings finished in 2025, 53% used a heat pump for heating (U.S. Census Bureau, May 2026).
- Of new single-family homes finished in 2025, 56% were fueled with electricity and 42% with gas (U.S. Census Bureau, May 2026).
Can air conditioner replacement bring heat pumps to more homes?
About 90% of US households use air conditioning, and around 75% of those rely on central systems with ducts already in place (IEA, Jul 2026).
- Upgrading a cooling-only central unit to a reversible heat pump typically costs just USD 200 to 500 more (IEA, Jul 2026).
- If every cooling-only air conditioner were replaced by a reversible system at end of life, heat pumps could heat roughly 60% of US households by 2035 (IEA, Jul 2026).
Colder regions may need a larger unit to cover peak heating load, so sizing for heat, not only for cooling, matters. The AC tonnage calculator shows the cooling side of that sizing. For the replacement side, see residential HVAC replacement.
Heat Pump Adoption in Europe
Europe’s heat pump sales follow energy prices and subsidy rules. Norway and Finland already have more than one heat pump for every two homes. Germany, Italy and France supply the volume.
How many heat pumps are installed in Europe?
Across 19 countries, about 25.5 million heat pumps were installed by the end of 2024, roughly 12% of European households (EHPA, Jul 2025).
- France has the largest stock at around 7 million units, and Italy follows with just under 5 million (EHPA, Jul 2026).
- Norway has 650 heat pumps per 1,000 households and Finland just above 540 (EHPA, Jul 2026).
- European heat pump sales rose 13% in 2025 across 21 countries (EHPA, Jul 2026).
Which European countries sell the most heat pumps?
France sold 528,000 heat pumps in 2025 and Italy sold 423,000 (EHPA, Jul 2026).
- German sales grew 50%, and heat pumps reached 50% of the national space heating market for the first time (EHPA, Jul 2026).
- Dutch suppliers sold 393,000 heat pumps in 2024, the first year-on-year decline after years of growth (CBS, Oct 2025).
- Hybrid units made up 45% of Dutch air-to-water heat pump sales in 2024, up from 24% in 2022 (CBS, Oct 2025).
- Finland sold 112,000 heat pumps in 2025, a rise of 10.7% (SULPU, Jan 2026).
- One third of Finnish heat pump sales are now replacements, while in Sweden the replacement share is about 50% (SULPU, Jan 2026).
How fast is German heat pump adoption growing?
German heat pump sales reached 299,000 heating units in 2025, up 55% on 2024 (BWP, Jan 2026).
- Officials approved more than 288,000 subsidy applications for heat pumps in 2025, up 91% (BWP, Jan 2026).
- Almost 80% of German heat pump sales now go into existing buildings (BWP, Jan 2026).
- German makers also sold 49,500 heat pump water heaters in 2025, up 20% (BWP, Jan 2026).
- About 2 million heat pumps are now in use in Germany (BWP, Jan 2026).
- Heat pumps were the main heat source in only 52.7% of new German buildings with three or more homes in 2025 (Destatis, Jun 2026).
Heat Pump Adoption in the United Kingdom
The UK is growing fast from a low base. Retrofit installs are up almost fivefold since 2020, but 2026 started slower than 2025. Government grants drive most of the market.
How many heat pumps does the UK install each year?
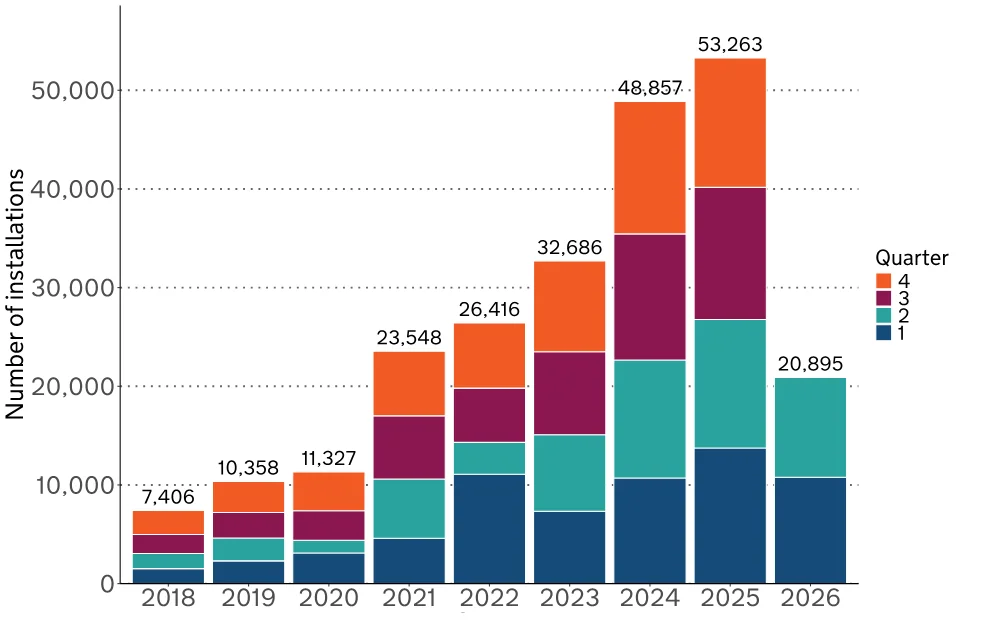
The UK installed 53,263 retrofit heat pumps in 2025, a 9% rise on the 48,857 installed in 2024 (DESNZ, Sep 2026).
- Annual retrofit installs are more than 4.5 times higher than in 2020, when 11,327 were installed (DESNZ, Sep 2026).
- Installs in the first half of 2026 reached 20,895, a 22% fall on the 26,768 installed in the same period of 2025 (DESNZ, Sep 2026).
- The Warm Homes Plan sets a goal of 450,000 heat pump installations a year by 2030 (DESNZ, Sep 2026).
- Industry data count 125,000 heat pumps sold in the UK in 2025, up 27% (EHPA, Mar 2026).
How many homes has the Boiler Upgrade Scheme reached?
Since May 2022, Ofgem has issued 96,951 grant vouchers worth £687,141,000 (Ofgem, Aug 2026).
- Ofgem has paid 90,115 grants worth £635,377,500 (Ofgem, Aug 2026).
- Air-to-water units were 97.8% of paid grants (Ofgem, Aug 2026).
- The scheme supported 30,600 air-source heat pumps in 2025/26, up 24% from 24,700 the year before (Nesta, Apr 2026).
- Nesta estimates the scheme must support around 150,000 installs a year to help reach the 2030 goal (Nesta, Apr 2026).
What is changing in UK installation costs?
The median installed cost has fallen 11% in real terms since the scheme launched in 2022 (Nesta, Apr 2026).
- The share of installs of 12 kW or more fell from over 35% to 18% (Nesta, Apr 2026).
- A majority of grants since launch, 52%, went to homes in urban areas (Nesta, Apr 2026).
Heat Pump Adoption in Canada
Canada’s heat pump stock has grown nearly sixfold since 2000, and the Atlantic provinces lead. Homes that burned heating oil show the biggest shift.
How many heat pumps does Canada have?
Single detached homes hold 83% of Canada’s heat pumps, or 1,108,000 units (CER, Aug 2026).
- Quebec added 36% of Canada’s heat pumps between 2000 and 2023, ahead of British Columbia at 16%, Ontario at 15% and New Brunswick at 13% (CER, Aug 2026).
- Heat pumps were 40% of home heating systems in New Brunswick in 2023, 23% in Prince Edward Island and 21.5% in Nova Scotia (CER, Aug 2026).
- In New Brunswick, heating oil homes fell by 34,705 (59%) while heat pumps rose by 142,414 (CER, Aug 2026).
- In 2023, 19% of households in Atlantic Canada used heating oil, against 2% in the rest of the country (CER, Aug 2026).
What support helped Canadian households switch?
Natural Resources Canada estimated that switching from heating oil to a heat pump saves $1,500 to $4,500 a year on energy bills (CER, Aug 2026).
- The Canada Greener Homes Initiative has supported close to 300,000 heat pumps since 2021 (CER, Aug 2026).
- The Greener Homes Grant paid up to $5,000 per household and the loan covered up to $40,000 (CER, Aug 2026).
- The Oil to Heat Pump Affordability program offers grants of up to $10,000 to low and median income households (CER, Aug 2026).
Heat Pump Efficiency: COP, SEER2 and HSPF2
A heat pump moves heat instead of making it, so it delivers more heat than the electricity it uses. That is the whole case for the technology. Minimum ratings keep rising, and the new test metrics are stricter.
How much more efficient is a heat pump than other heaters?
Canada’s regulator calls heat pumps about twice as efficient as the country’s most common heating systems, high efficiency gas furnaces and electric baseboard (CER, Aug 2026).
- Modern air-source heat pumps can cut electricity use for heating by 50% compared with furnaces and baseboard heaters (DOE, May 2023).
- Cold climate air-source heat pumps can reduce household energy use by up to 40% (DOE, Apr 2017).
- Improving a home’s efficiency rating by two grades can halve its heating energy demand and shrink the heat pump it needs (IEA, Nov 2022).
What are the minimum efficiency ratings for heat pumps?
Since 2023, new US central air conditioners must meet 14 SEER in the north and 15 SEER in the south (EIA, Jul 2019).
- The same rule raised the minimum heating rating of air-source heat pumps to 8.8 HSPF, up from 8.2 HSPF (EIA, Jul 2019).
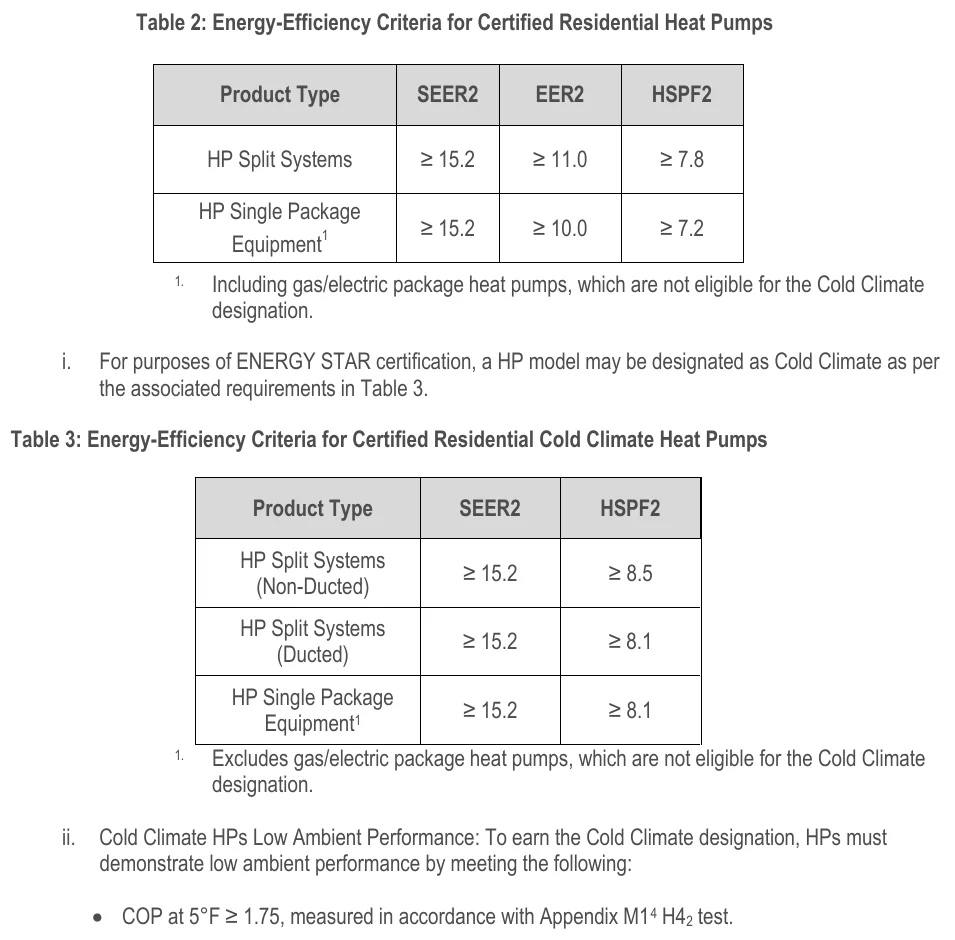
- ENERGY STAR certified heat pumps need at least 15.2 SEER2, and at least 7.8 HSPF2 for split systems or 7.2 HSPF2 for single package units (ENERGY STAR, Mar 2025).
- Cold climate designation requires at least 8.5 HSPF2 for non-ducted split systems and 8.1 HSPF2 for ducted split and single package units (ENERGY STAR, Mar 2025).
- Cold climate models must also reach a COP of at least 1.75 at 5°F (ENERGY STAR, Mar 2025).
- DOE estimated that the 2023 standards would save households $2.5 billion to $12.2 billion on energy bills over 30 years (EIA, Jul 2019).
Cold-Climate Heat Pump Performance
Cold weather lowers heat pump output, but modern cold-climate units hold up better than old advice says. The weak points in field data are sizing, controls and backup heat. Field studies are the best guide.
How does a heat pump perform in freezing weather?
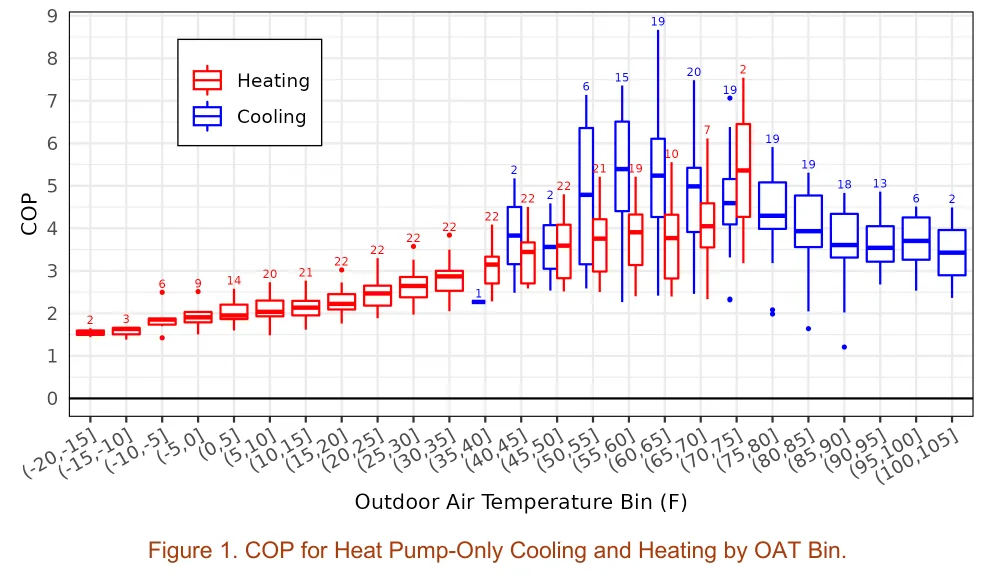
A conventional heat pump loses heating capacity once outdoor air drops below 40°F, and only a fraction of rated capacity remains in the teens (PNNL, Jan 2025).
- Median COP across 22 field sites ranged from 1.6 to 2.7 at outdoor temperatures below 30°F (PNNL, Jan 2025).
- ENERGY STAR requires a COP above 1.75 at 5°F, while the DOE challenge asked for 2.1 or 2.4 (PNNL, Jan 2025).
- In the coldest bins, from minus 10°F to 0°F, backup electric heat ran for 25% of the time (PNNL, Jan 2025).
Do cold-climate heat pumps work in real homes?
DOE’s field validation covered 22 units in the US and Canada, each monitored for 10 to 91 weeks (PNNL, Jan 2025).
- Average heating satisfaction rose from 3.61 to 3.88 on a 5-point scale after install (PNNL, Jan 2025).
- About 70% of homeowners would recommend their cold-climate unit, and those who would not mostly cited higher utility bills than with their old gas furnace (DOE, Nov 2024).
- Eight manufacturers that together hold more than 70% of the US unitary air conditioner and heat pump market completed prototype development, lab testing and field validation in the challenge (DOE, Nov 2024).
- Researchers ran an ACCA Manual J load calculation at every site before install (PNNL, Jan 2025).
Where do cold-climate field results fall short?
Across 12 monitored homes, average seasonal heat pump COP was 2.5, with a range of 1.7 to 3.5 (NREL, May 2023).
- Steady-state COP matched manufacturer data at only 7 of the 12 sites (NREL, May 2023).
- Backup electric resistance heat used more than 40% as much energy as the compressor at 5 of 11 all-electric sites (NREL, May 2023).
- Maine reached its goal of 100,000 new heat pumps in 2023, two years early, and set a new target of 175,000 more by 2027 (Maine Governor’s Office, Aug 2024).
Undersized units lean on resistance heat and raise bills. A room-by-room load estimate before quoting is the fix. The heat pump sizing calculator gives a first estimate.
Heat Pump Cost, Savings and Incentives
Heat pumps cost more upfront than the gear they replace, and they cost less to run. Whether a household comes out ahead depends on the local electricity-to-gas price ratio. Incentives close the gap in many markets.
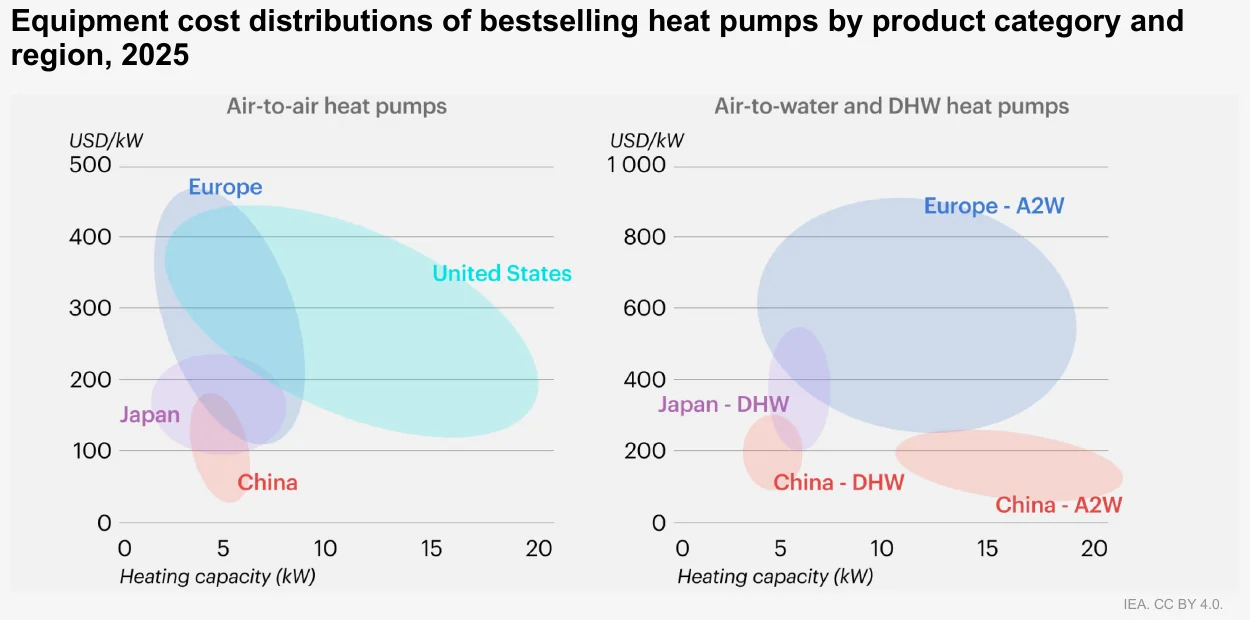
How much does a heat pump cost compared with other heaters?
In buildings, heat pump equipment often costs 2 to 3 times or more what the alternatives cost, and installation can match or exceed the equipment cost (IEA, Jul 2026).
- Prices of comparable heat pump models differ by as much as 60% between lower and higher cost products (IEA, Jul 2026).
- An air-to-air heat pump typically costs USD 3,000 to 6,000 to buy and install (IEA, Nov 2022).
- Even the cheapest air-to-water models cost two to four times as much as gas boilers in most major heating markets (IEA, Nov 2022).
- Household energy savings from a heat pump ranged from USD 300 a year in the US to USD 900 in Europe at 2022 prices (IEA, Nov 2022).
How did the US heat pump tax credit work?
The federal credit paid 30% of cost, with heat pumps capped at $2,000 inside an overall yearly limit of $3,200 (IRS, Oct 2024).
- From 2025, each item needed a qualified manufacturer PIN on the tax return before the credit was allowed (IRS, Oct 2024).
What help exists outside the US?
Financial incentives for heat pumps existed in over 30 countries by 2022, covering more than 70% of heating demand (IEA, Nov 2022).
- The EU’s Social Climate Fund can provide up to €65 billion to help households switch to heat pumps and other clean heating (EHPA, Jul 2025).
Heat Pumps, the Grid and Gas Demand
Heat pumps cut gas use and carbon, and they add load to the grid in cold weather. The numbers show the grid effect is real but manageable. Installer supply is a practical limit.
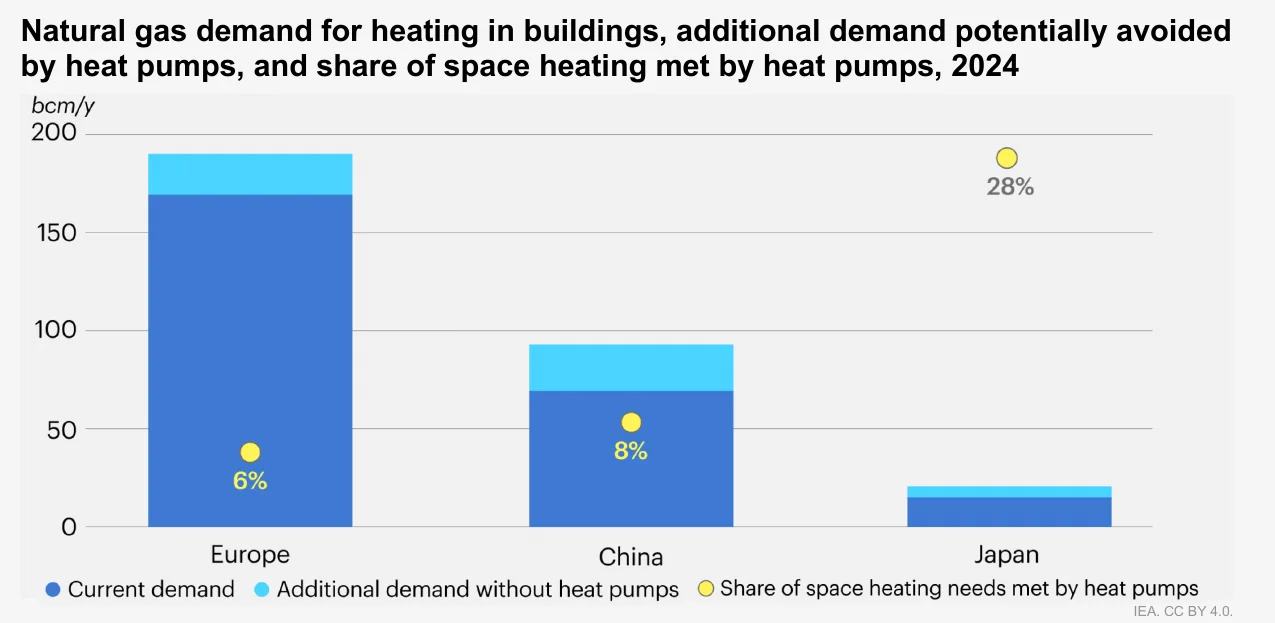
How much gas do heat pumps displace?
Without the heat pumps already installed, European gas demand for heating buildings would have been about 12% higher in 2024, or 20 billion cubic metres (IEA, Jul 2026).
- Gas demand for building heat would have been around 35% higher in Japan (6 bcm) and in China (25 bcm) (IEA, Jul 2026).
- More than 200 million gas boilers heat buildings in Europe, Japan and China (IEA, Jul 2026).
- Europe’s 25.5 million heat pumps avoid 21 billion cubic metres of gas imports and save an estimated 5.4 billion euros a year (EHPA, Jul 2025).
How much carbon do heat pumps cut?
Even on carbon-heavy electricity, heat pumps cut greenhouse gas emissions by at least 20% compared with a gas boiler, and by as much as 80% where power is cleaner (IEA, Nov 2022).
- Heating in buildings emits 4 gigatonnes of CO2 a year, about 10% of global emissions (IEA, Nov 2022).
- Heat pump deployment since 2019 avoided around 90 Mt of CO2 emissions in 2025 (IEA, Apr 2026).
Do heat pumps overload the grid?
Heat pumps made up 2% to 16% of annual peak electricity demand across major markets in 2024 (IEA, Jul 2026).
- Heat pump peak demand reaches about 130 GW in the US and about 10 GW in Japan (IEA, Jul 2026).
- Berkeley Lab found median observed demand factors of 5% and 60% in two data sets, far below the 100% of nameplate used in electrical code load calculations (LBNL, Aug 2024).
- Sub-metered data from 957 homes and smart meter data from 9,093 Vermont homes showed a small share of homes where heat pumps add 90% to 100% of their rated demand (LBNL, Aug 2024).
- A household that adds a heat pump without improving efficiency can nearly triple its winter peak demand (IEA, Nov 2022).
A whole-home load estimate before the swap shows whether the panel and the equipment fit. For policy context, see building electrification retrofits.
Who builds and installs heat pumps?
More than 70% of heat pumps sold for buildings in every major market are sourced domestically (IEA, Jul 2026).
- Global heat pump manufacturing capacity is about 145 GW a year, led by China at around 35%, the US at 25% and the EU at 20% (IEA, Jul 2026).
- Heat pump employment has grown by about 50% worldwide since 2015, yet a shortage of qualified installers remains a bottleneck (IEA, Jul 2026).
- The European heat pump sector employs 433,000 people directly and indirectly, across more than 300 manufacturing sites (EHPA, Jul 2025).
- The German heat pump industry employs about 70,000 people and earns around €3.5 billion a year (BWP, Jan 2026).
- NATE has certified more than 35,000 US technicians, and its heat pump service exam is its most popular specialty exam (DOE, Feb 2023).
Methodology and Sources
We chose each figure because it comes from the body that collected the data: statistical offices, regulators, national laboratories, trade associations that count shipments, and the IEA. We did not use roundups, market-research summaries or press stories as sources. Every link was opened and the number was found on the page or in the report PDF before it went in. Where two sources count different things, such as EHPA’s 16-country and 21-country series, each figure is attributed and not blended. Charts are cropped from the source report and credited to the publisher. We update this page every month. Manual J is a trademark of ACCA.
Sources
- AHRI, December 2025 U.S. Heating and Cooling Equipment Shipment Data, Feb 2026
- BWP, Über 50 Prozent im Plus: Wärmepumpen-Absatz steigt 2025 deutlich, Jan 2026
- CBS, Monitor Warmtepompen 2025, Oct 2025
- CER, Market Snapshot: Canada’s heat pump market has grown nearly sixfold since 2000, Aug 2026
- DESNZ, Heat pump deployment statistics June 2026, summary, Sep 2026
- Destatis, Rund drei Viertel der im Jahr 2025 errichteten Wohngebäude heizen mit Wärmepumpen, Jun 2026
- DOE, Cold Climate Air-Source Heat Pumps, Apr 2017
- DOE, Pump Up Your Savings with Heat Pumps, May 2023
- DOE, Residential Cold Climate Heat Pump Technology Challenge, field validation and market transformation, Nov 2024
- DOE, Residential Heat Pump Sales Fuel Improved Training Standards, Feb 2023
- EHPA, European heat pump market report 2025, executive summary, Jul 2025
- EHPA, Heat pump sales drop 21% in 2024, Feb 2025
- EHPA, Heat pump sales testify to government action, Mar 2026
- EHPA, Heat pump sales up 9% in 2025 so far, Oct 2025
- EHPA, Market data, Jul 2026
- EHPA, Post-Hormuz heat pump sales climb 11%, Sep 2026
- EIA, 2020 RECS Table HC6.1, Space heating in U.S. homes, Mar 2023
- EIA, Efficiency requirements for residential central AC and heat pumps to rise in 2023, Jul 2019
- EIA, One in four U.S. homes is all electric, May 2019
- ENERGY STAR, Version 6.2 Heat Pump Specification, Mar 2025
- HPTCJ, Eco Cute 10 million units achievement, May 2025
- IEA, Global Energy Review 2026, CO2 emissions, Apr 2026
- IEA, Global Energy Review 2026, Technology: Heat pumps, Apr 2026
- IEA, Heat Pump Monitor 2026, Jul 2026
- IEA, The Future of Heat Pumps in China, Executive summary, Mar 2024
- IEA, The Future of Heat Pumps, Executive summary, Nov 2022
- IRS, Guidance for the Energy Efficient Home Improvement Credit, Oct 2024
- LBNL, HVAC Heat Pump Upgrades and their Impact on Household Maximum Power Demand, Aug 2024
- Maine Governor’s Office, Expanding Use of Heat Pumps Across Maine, Aug 2024
- Nesta, Four years of the Boiler Upgrade Scheme in four charts, Apr 2026
- NREL, Field Validation of Air-Source Heat Pumps for Cold Climates, May 2023
- Ofgem, Boiler Upgrade Scheme Quarterly Report Issue 17, Aug 2026
- PNNL, Performance Results from DOE Cold Climate Heat Pump Challenge Field Validation, Jan 2025
- SULPU, Heat pump sales returned to a growth path, Jan 2026
- U.S. Census Bureau, Characteristics of New Housing, Type of heating system, May 2026
- U.S. Census Bureau, Highlights of 2025 Characteristics of New Housing, May 2026